UNITED STATES
SECURITIES AND EXCHANGE COMMISSION
Washington, D.C. 20549
FORM 10-K
ý ANNUAL REPORT PURSUANT TO SECTION 13 OR 15(d) OF THE SECURITIES EXCHANGE ACT OF 1934
For the fiscal year ended December 31, 2014
OR
¨ TRANSITION REPORT PURSUANT TO SECTION 13 OR 15(d) OF THE SECURITIES EXCHANGE ACT OF 1934
For the transition period from to .
Commission File Number: 1-8944
CLIFFS NATURAL RESOURCES INC.
(Exact Name of Registrant as Specified in Its Charter)
|
| | |
Ohio | | 34-1464672 |
(State or Other Jurisdiction of Incorporation or Organization) | | (I.R.S. Employer Identification No.) |
| |
200 Public Square, Cleveland, Ohio | | 44114-2315 |
(Address of Principal Executive Offices) | | (Zip Code) |
Registrant’s Telephone Number, Including Area Code: (216) 694-5700
Securities registered pursuant to Section 12(b) of the Act:
|
| | |
Title of Each Class | | Name of Each Exchange on Which Registered |
Common Shares, par value $0.125 per share | | New York Stock Exchange |
Depositary Shares, each representing a 1/40th ownership interest in a share of 7.00% Series A Mandatory Convertible Preferred Stock, Class A | | New York Stock Exchange |
Securities registered pursuant to Section 12(g) of the Act:
NONE
Indicate by check mark if the registrant is a well-known seasoned issuer, as defined in Rule 405 of the Securities Act. YES ý NO ¨
Indicate by check mark if the registrant is not required to file reports pursuant to Section 13 or Section 15(d) of the Act. YES ¨ NO ý
Indicate by check mark whether the registrant (1) has filed all reports required to be filed by Section 13 or 15(d) of the Securities Exchange Act of 1934 during the preceding 12 months (or for such shorter period that the registrant was required to file such reports), and (2) has been subject to such filing requirements for the past 90 days. YES ý NO ¨
Indicate by check mark whether the registrant has submitted electronically and posted on its corporate Web site, if any, every Interactive Data File required to be submitted and posted pursuant to Rule 405 of Regulation S-T (§232.405 of this chapter) during the preceding 12 months (or for such shorter period that the registrant was required to submit and post such files). YES ý NO ¨
Indicate by check mark if disclosure of delinquent filers pursuant to Item 405 of Regulation S-K (§229.405 of this chapter) is not contained herein, and will not be contained, to the best of registrant’s knowledge, in definitive proxy or information statements incorporated by reference in Part III of this Form 10-K or any amendment to this Form 10-K. ¨
Indicate by check mark whether the registrant is a large accelerated filer, an accelerated filer, a non-accelerated filer, or a smaller reporting company. See definitions of “large accelerated filer,” “accelerated filer” and “smaller reporting company” in Rule 12b-2 of the Exchange Act.
Large accelerated filer ý Accelerated filer ¨ Non-accelerated filer ¨ Smaller reporting company ¨
Indicate by check mark whether the registrant is a shell company (as defined in Rule 12b-2 of the Act). YES ¨ NO ý
As of June 30, 2014, the aggregate market value of the voting and non-voting common shares held by non-affiliates of the registrant, based on the closing price of $15.05 per share as reported on the New York Stock Exchange — Composite Index, was $2,397,182,297 (excluded from this figure is the voting stock beneficially owned by the registrant’s officers and directors).
The number of shares outstanding of the registrant’s common shares, par value $0.125 per share, was 153,279,552 as of February 23, 2015.
DOCUMENTS INCORPORATED BY REFERENCE
Portions of the registrant’s proxy statement for its 2015 annual meeting of shareholders are incorporated by reference into Part III.
TABLE OF CONTENTS |
| | | | | |
| | | | | |
| | | Page Number |
| | | | | |
DEFINITIONS | | | |
| | | |
PART I | | | |
| Item 1. | Business | | | |
| | Executive Officers of the Registrant | | | |
| Item 1A. | Risk Factors | | | |
| Item 1B. | Unresolved Staff Comments | | | |
| Item 2. | Properties | | | |
| Item 3. | Legal Proceedings | | | |
| Item 4. | Mine Safety Disclosures | | | |
| | | | | |
PART II | | | |
| Item 5. | Market for Registrant's Common Equity, Related Stockholder Matters and Issuer Purchases of Equity Securities | | | |
| Item 6. | Selected Financial Data | | | |
| Item 7. | Management's Discussion and Analysis of Financial Condition and Results of Operations | | | |
| Item 7A. | Quantitative and Qualitative Disclosures About Market Risk | | | |
| Item 8. | Financial Statements and Supplementary Data | | | |
| Item 9. | Changes in and Disagreements With Accountants on Accounting and Financial Disclosure | | | |
| Item 9A. | Controls and Procedures | | | |
| Item 9B. | Other Information | | | |
| | | |
PART III | | | |
| Item 10. | Directors, Executive Officers and Corporate Governance | | | |
| Item 11. | Executive Compensation | | | |
| Item 12. | Security Ownership of Certain Beneficial Owners and Management and Related Stockholder Matters | | | |
| Item 13. | Certain Relationships and Related Transactions, and Director Independence | | | |
| Item 14. | Principal Accountant Fees and Services | | | |
| | | | | |
PART IV | | | |
| Item 15. | Exhibits and Financial Statement Schedules | | | |
| | | |
SIGNATURES | | | |
DEFINITIONS
The following abbreviations or acronyms are used in the text. References in this report to the “Company,” “we,” “us,” “our” and “Cliffs” are to Cliffs Natural Resources Inc. and subsidiaries, collectively. References to “A$” or “AUD” refer to Australian currency, “C$” to Canadian currency and “$” to United States currency.
|
| | |
Abbreviation or acronym | | Term |
Amapá | | Anglo Ferrous Amapá Mineração Ltda. and Anglo Ferrous Logística Amapá Ltda. |
AG | | Autogenous Grinding |
Anglo | | Anglo American plc |
APBO | | Accumulated Postretirement Benefit Obligation |
ArcelorMittal | | ArcelorMittal (as the parent company of ArcelorMittal Mines Canada, ArcelorMittal USA and Dofasco, as well as, many other subsidiaries) |
ArcelorMittal USA | | ArcelorMittal USA LLC (including many of its North American affiliates, subsidiaries and representatives. References to ArcelorMittal USA comprise all such relationships unless a specific ArcelorMittal USA entity is referenced) |
ASC | | Accounting Standards Codification |
Barrick | | Barrick Gold Corporation Inc. |
BART | | Best Available Retrofit Technology |
Bloom Lake | | The Bloom Lake Iron Ore Mine Limited Partnership |
BNSF | | Burlington Northern Santa Fe, LLC |
CCAA | | Companies' Creditors Arrangement Act (Canada) |
CFR | | Cost and freight |
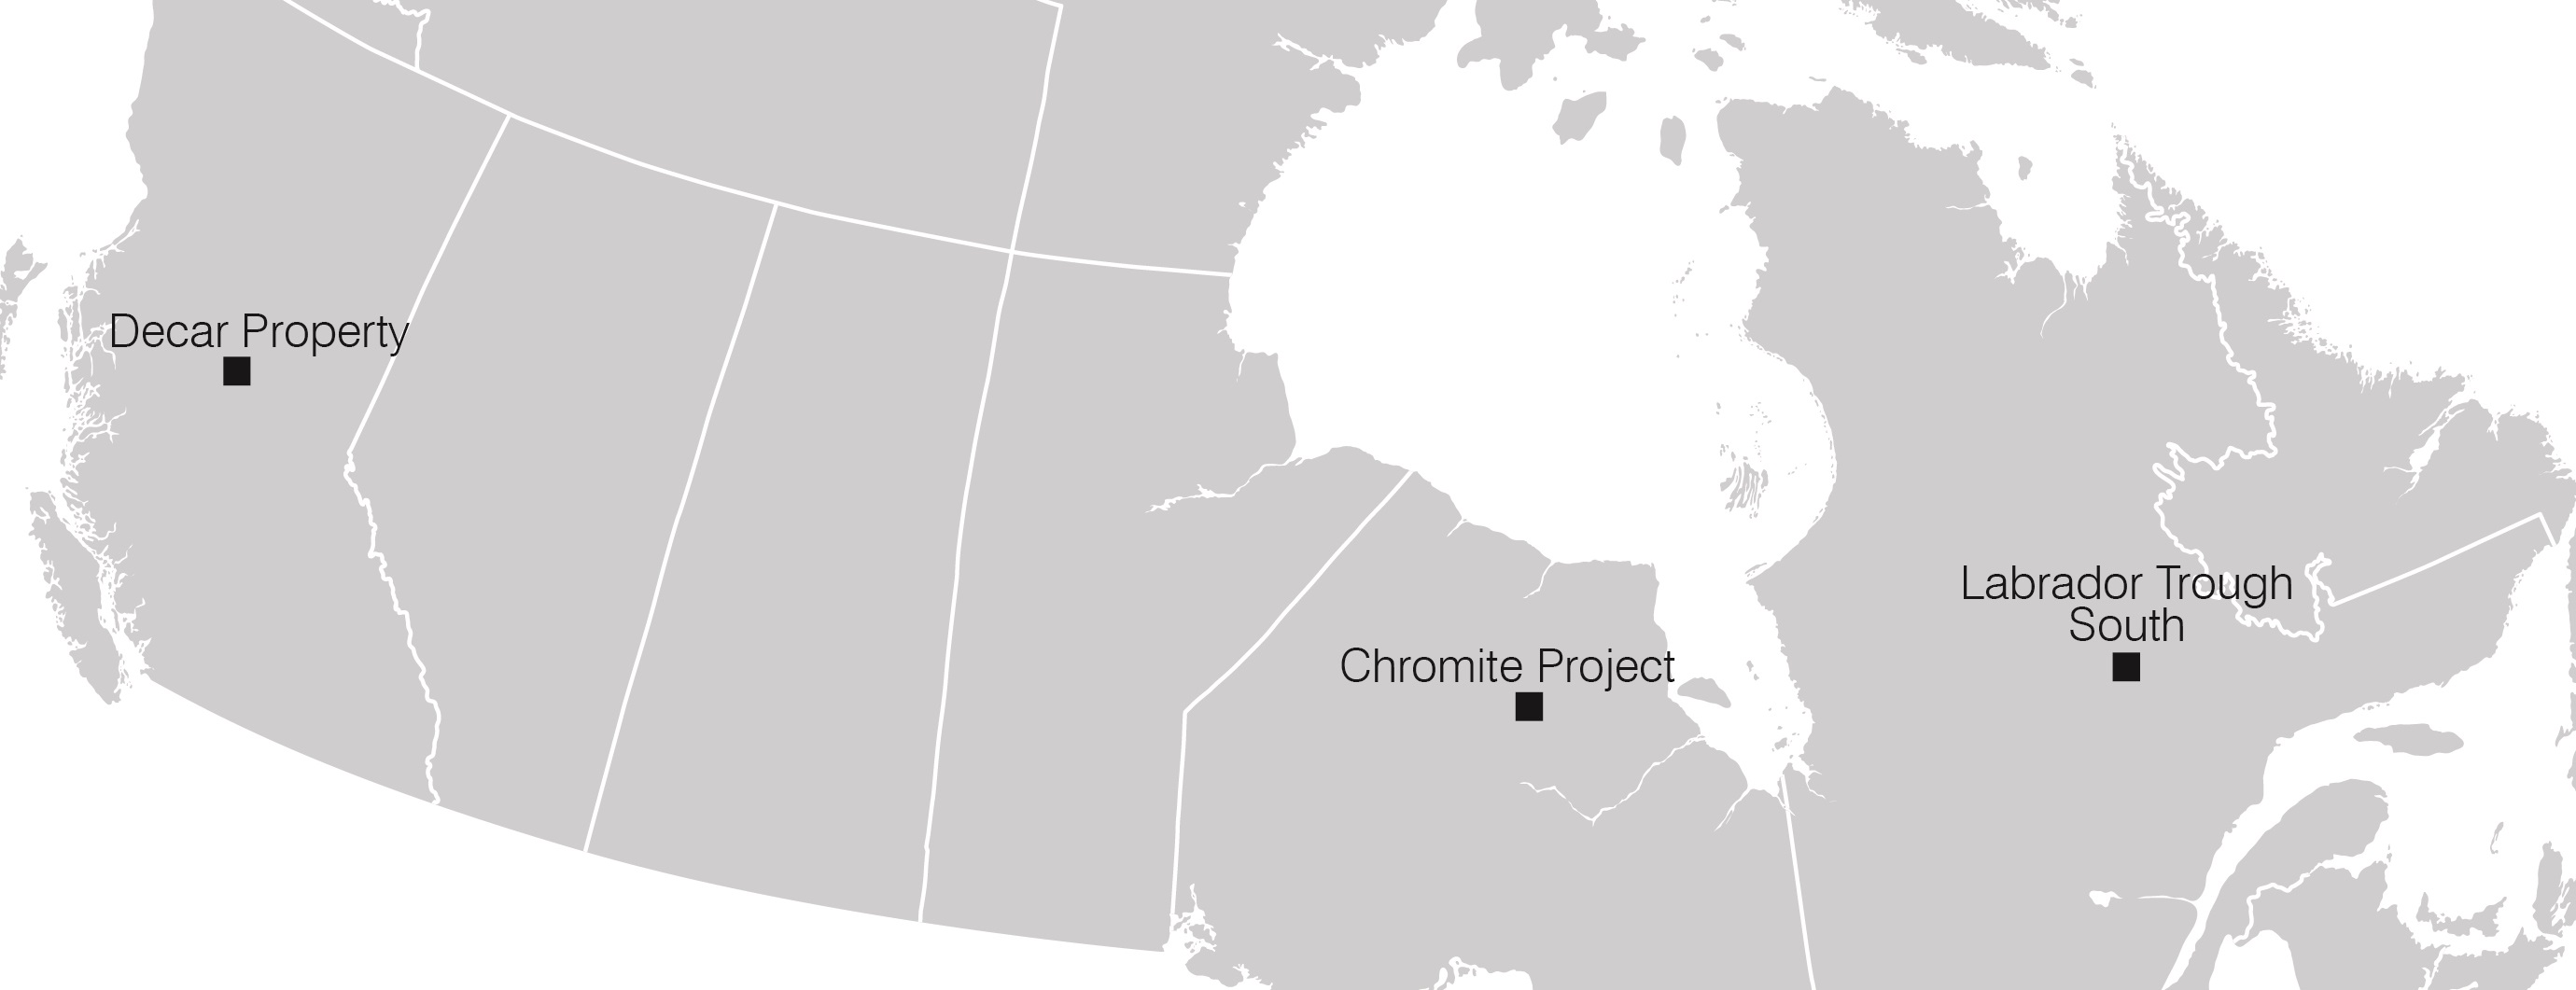
Chromite Project | | Cliffs Chromite Ontario Inc. |
CIRB | | Canadian Industrial Relations Board |
CLCC | | Cliffs Logan County Coal LLC |
Clean Water Act | | Federal Water Pollution Control Act |
Cliffs Chromite Far North Inc. | | Entity previously known as Spider Resources Inc. |
Cliffs Chromite Ontario Inc. | | Entity previously known as Freewest |
CN | | Canadian National Railway Company |
Cockatoo Island | | Cockatoo Island Joint Venture |
CODM | | Chief Operating Decision Maker |
Compensation Committee | | Compensation and Organization Committee |
Consent Order | | Administrative Order by Consent |
Consolidated Thompson | | Consolidated Thompson Iron Mining Limited (now known as Cliffs Québec Iron Mining ULC) |
CQIM | | Cliffs Québec Iron Mining ULC (formerly known as Cliffs Québec Iron Mining Limited) |
Cr2O3 | | Chromium Oxide |
CSAPR | | Cross-State Air Pollution Rule |
DD&A | | Depreciation, depletion and amortization |
DEP | | U.S. Department of Environment Protection |
Directors’ Plan | | Cliffs Natural Resources Inc. 2014 Nonemployee Directors’ Compensation Plan |
Dodd-Frank Act | | Dodd-Frank Wall Street Reform and Consumer Protection Act |
Dofasco | | ArcelorMittal Dofasco Inc. |
EBITDA | | Earnings before interest, taxes, depreciation and amortization |
Empire | | Empire Iron Mining Partnership |
EPA | | U.S. Environmental Protection Agency |
EPS | | Earnings per share |
EPSL | | Esperance Port Sea and Land |
ERM | | Enterprise Risk Management |
Essar | | Essar Steel Algoma Inc. |
Essar Sale Agreement | | 2002 Pellet Sale and Purchase Agreement as amended |
Exchange Act | | Securities Exchange Act of 1934, as amended |
FASB | | Financial Accounting Standards Board |
Fe | | Iron |
(Fe,Mg) (Cr,Al,Fe)2O4 | | Mineral Chromite |
FeT | | Total Iron |
FIP | | Federal Implementation Plan |
FMSH Act | | U.S. Federal Mine Safety and Health Act 1977, as amended |
|
| | |
Abbreviation or acronym | | Term |
Freewest | | Freewest Resources Canada Inc. (now known as Cliffs Chromite Ontario Inc.) |
GAAP | | Accounting principles generally accepted in the United States |
GHG | | Greenhouse gas |
Hibbing | | Hibbing Taconite Company |
ICE Plan | | Amended and Restated Cliffs 2007 Incentive Equity Plan, as amended |
INR | | INR Energy, LLC |
IRS | | U.S. Internal Revenue Service |
Ispat | | Ispat Inland Steel Company |
Koolyanobbing | | Collective term for the operating deposits at Koolyanobbing, Mount Jackson and Windarling |
LCM | | Lower of cost or market |
LIBOR | | London Interbank Offered Rate |
LIFO | | Last-in, first-out |
LTVSMC | | LTV Steel Mining Company |
MDEQ | | Michigan Department of Environmental Quality |
MMBtu | | Million British Thermal Units |
Moody's | | Moody's Investors Service, Inc., a subsidiary of Moody's Corporation, and its successors |
MPCA | | Minnesota Pollution Control Agency |
MPI | | Management Performance Incentive Plan |
MPSC | | Michigan Public Service Commission |
MPUC | | Minnesota Public Utilities Commission |
MRPS | | Mandatory redeemable preference shares |
MRRT | | Minerals Resource Rent Tax (Australia) |
MSHA | | U.S. Mine Safety and Health Administration |
MWh | | Megawatts per hour |
n/m | | Not meaningful |
NAAQS | | National Ambient Air Quality Standards |
NBCWA | | National Bituminous Coal Wage Agreement |
NDEP | | Nevada Department of Environmental Protection |
Ni | | Nickel |
NO2 | | Nitrogen dioxide |
NOx | | Nitrogen oxide |
Northshore | | Northshore Mining Company |
NPDES | | National Pollutant Discharge Elimination System, authorized by the U.S. Clean Water Act |
NRD | | Natural Resource Damages |
NSPS | | New Source Performance Standards |
NYSE | | New York Stock Exchange |
Oak Grove | | Oak Grove Resources, LLC |
OCI | | Other comprehensive income (loss) |
OPEB | | Other postretirement benefits |
OPEB cap | | Medical premium maximums |
P&P | | Proven and Probable |
PBO | | Projected benefit obligation |
Pinnacle | | Pinnacle Mining Company, LLC |
Pluton Resources | | Pluton Resources Limited |
Reconciliation Act | | Health Care and Education Reconciliation Act |
Ring of Fire properties | | Black Thor, Black Label and Big Daddy chromite deposits in Ontario, Canada |
ROA | | Return on asset |
RTWG | | Rio Tinto Working Group |
S&P | | Standard & Poor's Rating Services, a division of Standard & Poor's Financial Services LLC, a subsidiary of The McGraw-Hill Companies, Inc., and its successors |
SARs | | Stock Appreciation Rights |
SEC | | U.S. Securities and Exchange Commission |
Severstal | | Severstal Dearborn, LLC |
Silver Bay Power | | Silver Bay Power Company |
|
| | |
Abbreviation or acronym | | Term |
SIP | | State Implementation Plan |
SMCRA | | Surface Mining Control and Reclamation Act |
SO2 | | Sulfur dioxide |
Sonoma | | Sonoma Coal Project |
Spider | | Spider Resources Inc. (now known as Cliffs Chromite Far North Inc.) |
STRIPS | | Separate Trading of Registered Interest and Principal of Securities |
Substitute Rating Agency | | A "nationally recognized statistical rating organization" within the meaning of Section 3 (a)(62) of the Exchange Act, selected by us (as certified by a certificate of officers confirming the decision of our Board of Directors) as a replacement agency of Moody's or S&P, or both of them, as the case may be |
Tilden | | Tilden Mining Company |
TMDL | | Total Maximum Daily Load |
TRIR | | Total Reportable Incident Rate |
TSR | | Total Shareholder Return |
U/G | | Underground |
UMWA | | United Mineworkers of America |
United Taconite | | United Taconite LLC |
UP 1994 | | 1994 Uninsured Pensioner Mortality Table |
U.S. | | United States of America |
U.S. Steel Canada | | U.S. Steel Canada Inc., a subsidiary of United States Steel Corporation |
USW | | United Steelworkers |
Vale | | Companhia Vale do Rio Doce |
VEBA | | Voluntary Employee Benefit Association trusts |
VNQDC Plan | | 2005 Voluntary NonQualified Deferred Compensation Plan, as amended |
VWAP | | Volume Weighted Average Price |
Wabush | | Wabush Mines Joint Venture |
Weirton | | ArcelorMittal Weirton Inc. |
WISCO | | Wugang Canada Resources Investment Limited, a subsidiary of Wuhan Iron and Steel (Group) Corporation |
Zamin | | Zamin Ferrous Ltd |
1974 PP | | The UMWA 1974 Pension Plan |
2008 Director's Plan | | Nonemployee Directors’ Compensation Plan, as amended and restated 12/31/2008 |
2012 Equity Plan | | Cliffs Natural Resources Inc. Amended and Restated 2012 Incentive Equity Plan |
PART I
Introduction
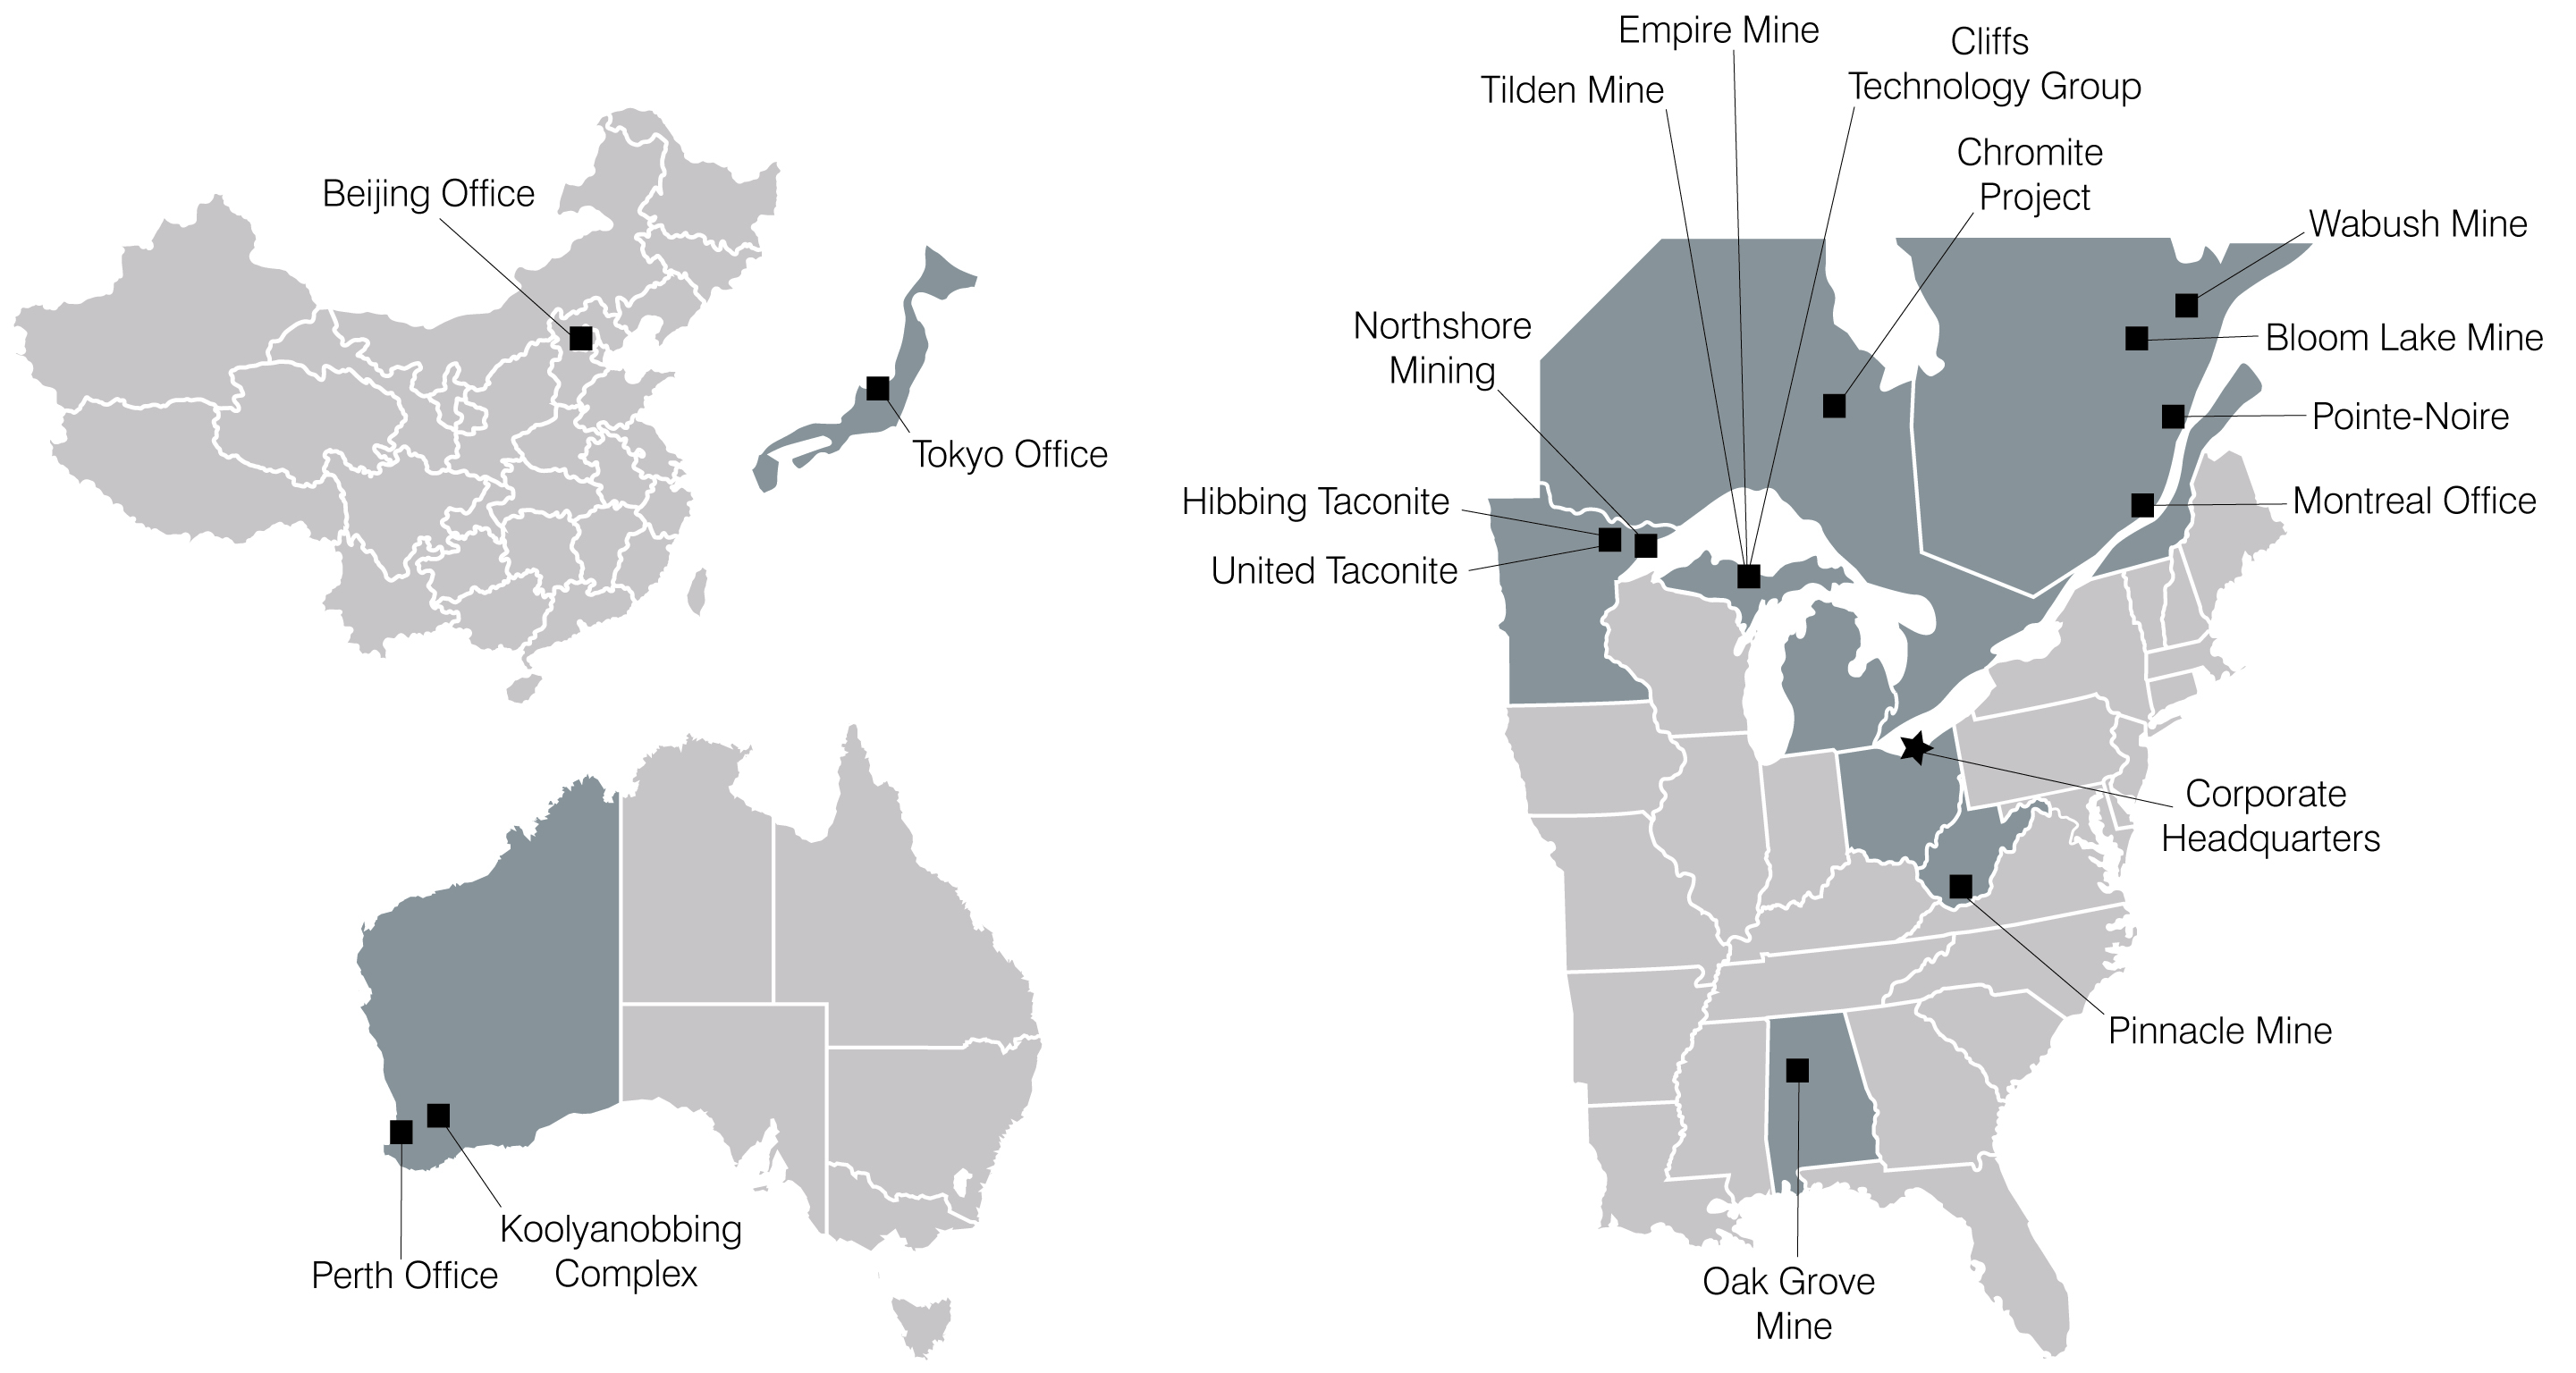
Cliffs Natural Resources Inc. traces its history back to 1847. Today, we are a leading mining and natural resources company. We are a major supplier of iron ore pellets to the North American steel industry from our mines and pellet plants located in Michigan and Minnesota. Cliffs also produces low-volatile metallurgical coal in the U.S. from its mines located in Alabama and West Virginia. Additionally, Cliffs operates an iron ore mining complex in Western Australia and owns two non-operating iron ore mines in Eastern Canada. Driven by the core values of safety, social, environmental and capital stewardship, our employees endeavor to provide all stakeholders with operating and financial transparency.
We are organized through a global commercial group responsible for sales and delivery of our products and operations groups responsible for the production of the minerals that we market. Our operations are organized according to product category and geographic location: U.S. Iron Ore, Asia Pacific Iron Ore, North American Coal and Eastern Canadian Iron Ore.
In the U.S., we currently operate five iron ore mines in Michigan and Minnesota and two metallurgical coal operations located in Alabama and West Virginia. Our Asia Pacific operations consist solely of our Koolyanobbing iron ore mining complex in Western Australia. We also own two iron ore mines in Eastern Canada, although we have currently shutdown one of the mines due to its unsustainable high cost structure and the other mine has ceased all production and transitioned to "care-and-maintenance" mode.
Re-focusing the Company on our Core U.S. Iron Ore Business
Our leadership changed over the past year. Subsequent to our 2014 Annual Meeting of Shareholders, where shareholders elected six new directors to our Board of Directors, including our new Chairman, President and Chief Executive Officer, Lourenco Goncalves, our Board changed substantially. The reconstituted Board of Directors has established a strategy to return the Company to its core strengths.
We have shifted from a diversification based strategy to one that focuses on strengthening our U.S. Iron Ore operations. We are the market-leading iron ore producer in the U.S., supplying differentiated iron ore pellets under long-term contracts, some of which begin to expire in the end of 2016, to the largest U.S. steel producers. Pricing protections and long-term supply, certainty provided by our existing contracts and our low-cost operating profile positions U.S. Iron Ore as our most stable and profitable business. We expect to continue to strengthen U.S. Iron Ore cost operating profile through our operational expertise and disciplined capital allocation policies.
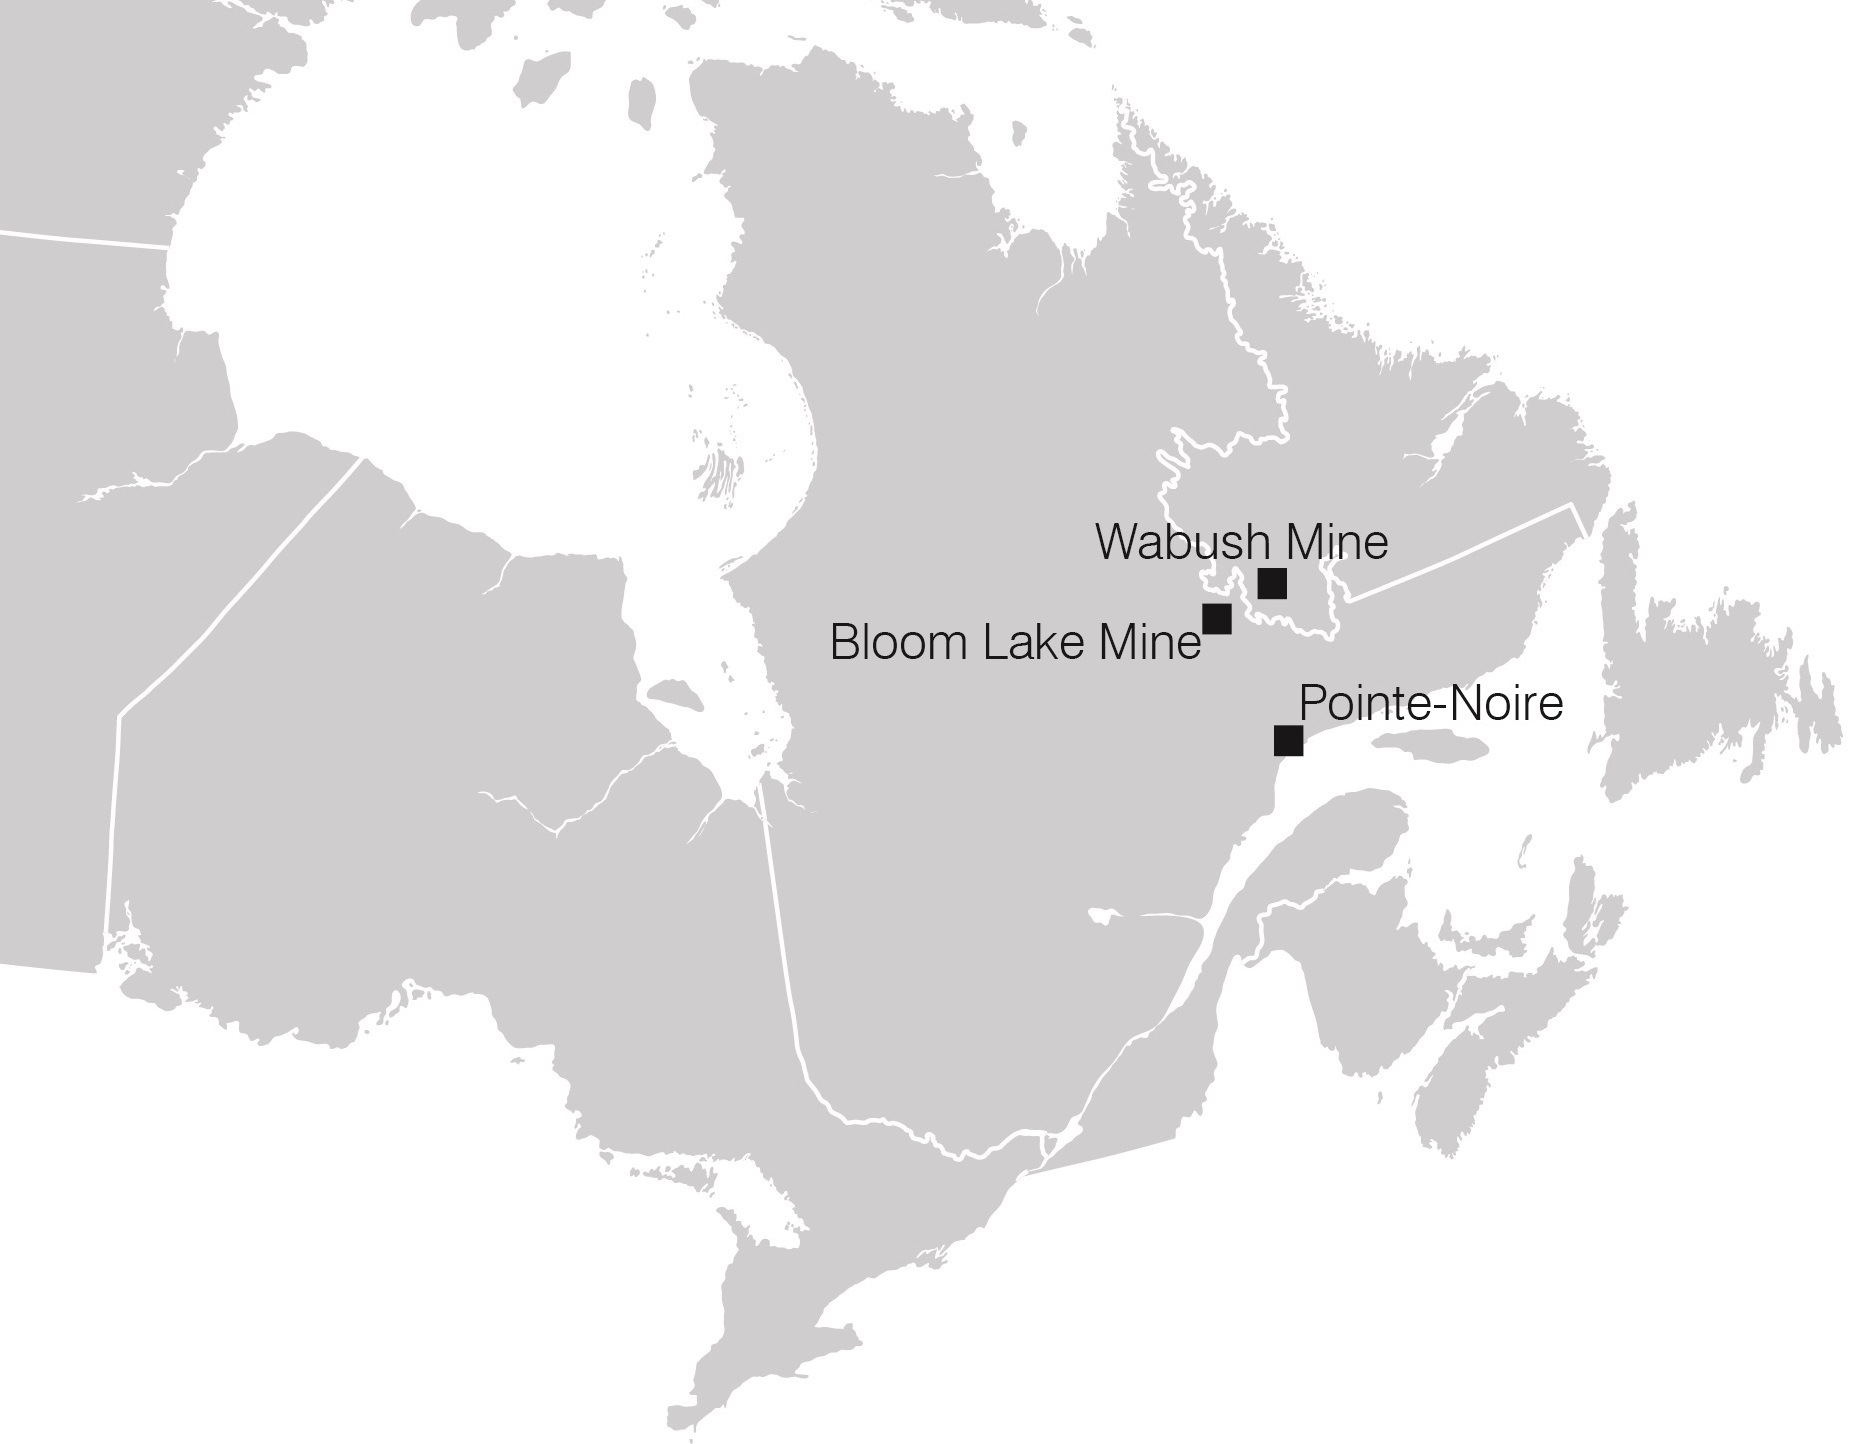
Eastern Canadian Iron Ore
The Cliffs' Wabush Scully mine in Newfoundland and Labrador was idled by the end of the first quarter of 2014 and subsequently began to commence permanent closure in the fourth quarter of 2014. With costs unsustainably high, it was not economically viable to continue running this operation. Approximately 500 employees at both the Wabush Scully mine and the Pointe Noire rail and port operation in Québec were impacted by these actions.
On November 19, 2014, we announced the pursuit of an exit option for our Eastern Canadian Iron Ore operations. With the expansion no longer viable and the Bloom Lake operation remaining unprofitable, we have shifted our focus to executing an exit option for Eastern Canadian Iron Ore operations that minimizes the cash outflows and associated liabilities.
During the fourth quarter of 2014, we disclosed that, despite our cost-cutting progress at our Bloom Lake mine, we concluded that Phase I alone was not economically feasible based on our current operating plans. For the Bloom Lake mine to be profitable, we concluded that Phase II of the Bloom Lake mine must be developed to reduce the overall cash cost of operations. We could only develop Phase II of the Bloom Lake mine if we had been able to secure new equity partners to share in the capital costs, which we estimated to be approximately $1.2 billion. As the equity partners were unable to commit within the short timeframe we required, we determined that the Phase II expansion of the Bloom Lake mine was no longer a viable option for us and we shifted our focus to considering available possibilities and executing an exit option for Eastern Canadian Iron Ore operations that minimized the cash outflows and associated liabilities. In December 2014, iron ore production at the Bloom Lake mine was suspended and the Bloom Lake mine was placed in ‘‘care-and-maintenance’’ mode.
On January 27, 2015, we announced that Bloom Lake General Partner Limited and certain of its affiliates, including Cliffs Québec Iron Mining ULC (collectively, the "Bloom Lake Group") commenced restructuring proceedings in Montreal, Québec, under the CCAA. The Bloom Lake Group had recently suspended operations, and for several months we were exploring options to sell certain of our Canadian assets, among other initiatives. The decision to seek protection under the CCAA was based on a thorough legal and financial analysis of the options available to the Bloom Lake Group. The Bloom Lake Group was no longer generating any revenues and was not able to meet its obligations as they came due. The initial CCAA order addressed the Bloom Lake Group's immediate liquidity issues and permits the Bloom Lake Group to preserve and protect its assets for the benefit of all stakeholders while restructuring and sale options are explored. As part of the CCAA process, the Court has appointed FTI Consulting Canada Inc. as the Monitor. The Monitor's role in the CCAA process is to monitor the activities of the Bloom Lake Group and provide assistance to the Bloom Lake Group and its stakeholders in respect of the CCAA process.
Business Segments
Our Company’s operations are organized and managed according to product category and geographic location: U.S. Iron Ore, Asia Pacific Iron Ore, North American Coal and Eastern Canadian Iron Ore. Amapá, which was sold in the fourth quarter of 2013, previously was reported through our Latin American Iron Ore operating segment, which did not meet the criteria for a reportable segment. Additionally, Sonoma, which was sold in the fourth quarter of 2012, previously was reported through our Asia Pacific Coal operating segment, which did not meet the criteria for a reportable segment.
Segment information reflects our strategic business units, which are organized to meet customer requirements and global competition. We have historically evaluated segment performance based on sales margin, defined as revenues less cost of goods sold, and operating expenses identifiable to each segment. Additionally, beginning in the third quarter of 2014, concurrent with the change of a majority of our Board of Directors and appointment of our new Chairman, President and Chief Executive Officer in August 2014, management began to evaluate segment performance based on EBITDA, defined as Net Income (Loss) before interest, income taxes, depreciation, depletion and amortization, and Adjusted EBITDA, defined as EBITDA excluding certain items such as impairment charges, impacts of permanently idled, closed or sold facilities, foreign currency remeasurement, severance and other costs associated with the change in control, litigation judgments and intersegment corporate allocations of SG&A costs. Management uses and believes that investors benefit from referring to these measures in evaluating operating and financial results, as well as in planning, forecasting and analyzing future periods as these financial measures approximate the cash flows associated with the operational earnings. Financial information about our segments, including financial information about geographic areas, is included in Item 7. Management's Discussion and Analysis of Financial Condition and Results of Operations and NOTE 2 - SEGMENT REPORTING included in Item 8. Financial Statements and Supplementary Data of this Annual Report on Form 10-K.
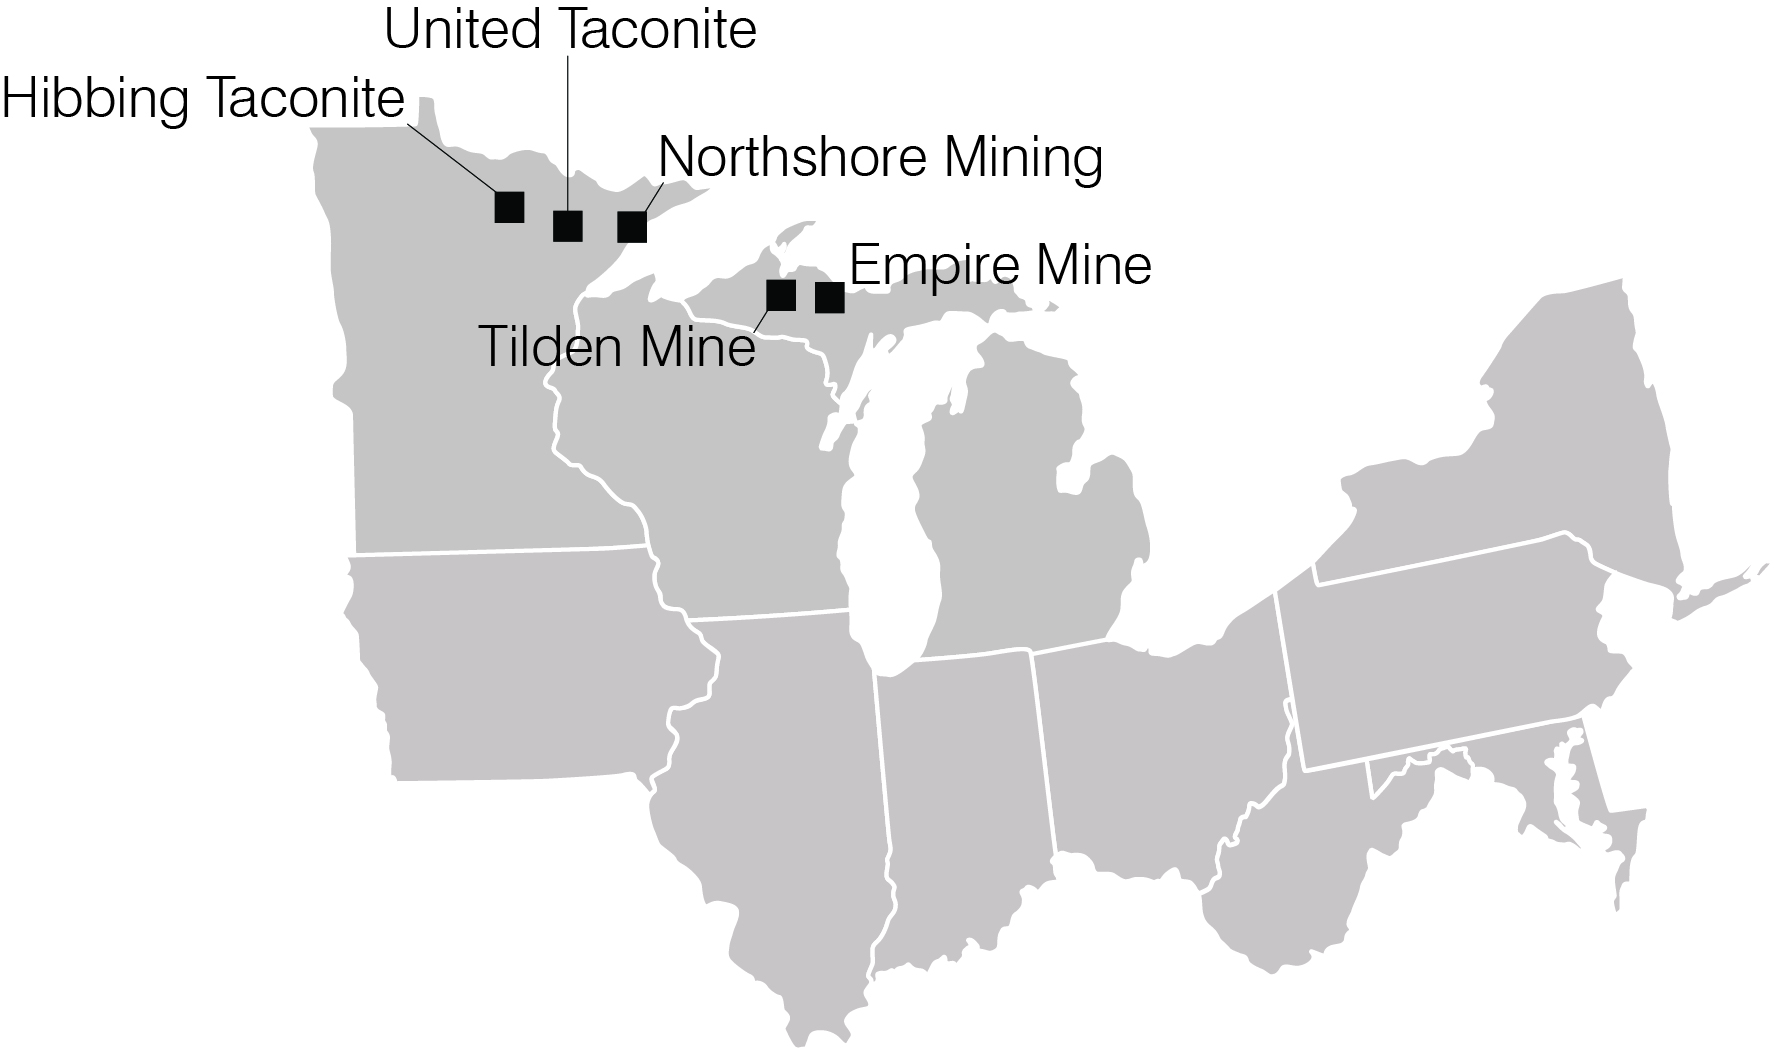
U.S. Iron Ore
We are a major global iron ore producer, primarily selling production from U.S. Iron Ore to integrated steel companies in the U.S. and Canada. We manage and operate five iron ore mines located in Michigan and Minnesota. The U.S.-based mines currently have an annual rated capacity of 32.9 million tons of iron ore pellet production, representing 56 percent of total U.S. pellet production capacity. Based on our equity ownership in these mines, our share of the annual rated production capacity is currently 25.5 million tons, representing 44 percent of total U.S. annual pellet capacity.
The following chart summarizes the estimated annual pellet production capacity and percentage of total U.S. pellet production capacity for each of the respective iron ore producers as of December 31, 2014:
|
| | | | | | |
U.S. Iron Ore Pellet |
Annual Rated Capacity Tonnage |
| | Current Estimated Capacity (Tons in Millions)1 | | Percent of Total U.S. Capacity |
All Cliffs’ managed mines | | 32.9 |
| | 56.3 | % |
Other U.S. mines | | | | |
U.S. Steel’s Minnesota ore operations | | | | |
Minnesota Taconite | | 14.3 |
| | 24.6 |
|
Keewatin Taconite | | 5.4 |
| | 9.2 |
|
Total U.S. Steel | | 19.7 |
| | 33.8 |
|
ArcelorMittal USA Minorca mine | | 2.8 |
| | 4.8 |
|
Magnetation | | 3.0 |
| | 5.1 |
|
Total other U.S. mines | | 25.5 |
| | 43.7 |
|
Total U.S. mines | | 58.4 |
| | 100.0 | % |
| | | | |
1 Tons are long tons (2,240 pounds) | | | | |
Our U.S. iron ore production generally is sold pursuant to long-term supply agreements with various price adjustment provisions. For the year ended December 31, 2014, we produced a total of 29.7 million tons of iron ore pellets, including 22.4 million tons for our account and 7.3 million tons on behalf of steel company partners of the mines.
We produce various grades of iron ore pellets, including standard and fluxed, for use in our customers’ blast furnaces as part of the steelmaking process. The variation in grades results from the specific chemical and metallurgical properties of the ores at each mine and whether or not fluxstone is added in the process. Although the grade or grades of pellets currently delivered to each customer are based on that customer’s preferences, which depend in part on the characteristics of the customer’s blast furnace operation, in many cases our iron ore pellets can be used interchangeably. Industry demand for the various grades of iron ore pellets depends on each customer’s preferences and changes from time to time. In the event that a given mine is operating at full capacity, the terms of most of our pellet supply agreements allow some flexibility in providing our customers iron ore pellets from different mines.
Standard pellets require less processing, are generally the least costly pellets to produce and are called “standard” because no ground fluxstone, such as limestone or dolomite, is added to the iron ore concentrate before turning the concentrate into pellets. In the case of fluxed pellets, fluxstone is added to the concentrate, which produces pellets that can perform at higher productivity levels in the customer’s specific blast furnace and will minimize the amount of fluxstone the customer may be required to add to the blast furnace.
Each of our U.S. Iron Ore mines is located near the Great Lakes. The majority of our iron ore pellets are transported via railroads to loading ports for shipment via vessel to steelmakers in North America.
Our U.S. Iron Ore sales are influenced by seasonal factors in the first quarter of the year as shipments and sales are restricted by the Army Corp of Engineers due to closure of the Soo Locks and the Welland Canal on the Great Lakes. During the first quarter, we continue to produce our products, but we cannot ship those products via lake vessel until the conditions on the Great Lakes are navigable, which causes our first quarter inventory levels to rise. Our limited practice of shipping product to ports on the lower Great Lakes or to customers’ facilities prior to the transfer of title has somewhat mitigated the seasonal effect on first quarter inventories and sales, as shipment from this point to the customers’ operations is not limited by weather-related shipping constraints. At December 31, 2014 and 2013, we had approximately 1.4 million and 1.2 million tons of pellets, respectively, in inventory at lower lakes or customers’ facilities.
U.S. Iron Ore Customers
Our U.S. Iron Ore revenues primarily are derived from sales of iron ore pellets to the North American integrated steel industry, consisting of three major customers. Generally, we have multi-year supply agreements with our customers. Sales volume under these agreements largely is dependent on customer requirements, and in many cases, we are the sole supplier of iron ore to the customer. Historically, each agreement has contained a base price that is adjusted annually using one or more adjustment factors. Factors that could result in a price adjustment include spot pricing, measures of general industrial inflation and steel prices. Additionally, certain of our supply agreements have a provision that limits the amount of price increase or decrease in any given year.
During 2014, 2013 and 2012, we sold 21.8 million, 21.3 million and 21.6 million tons of iron ore pellets, respectively, from our share of the production from our U.S. Iron Ore mines. The segment’s five largest customers together accounted for a total of 95 percent, 87 percent and 91 percent of U.S. Iron Ore product revenues for the years 2014, 2013 and 2012, respectively. Effective September 16, 2014, AK Steel completed the acquisition of Severstal North America's integrated steelmaking assets located in Dearborn, Michigan. For comparative purposes, we have combined historical data of AK Steel for all periods presented. Refer to Concentration of Customers below for additional information regarding our major customers.
Asia Pacific Iron Ore
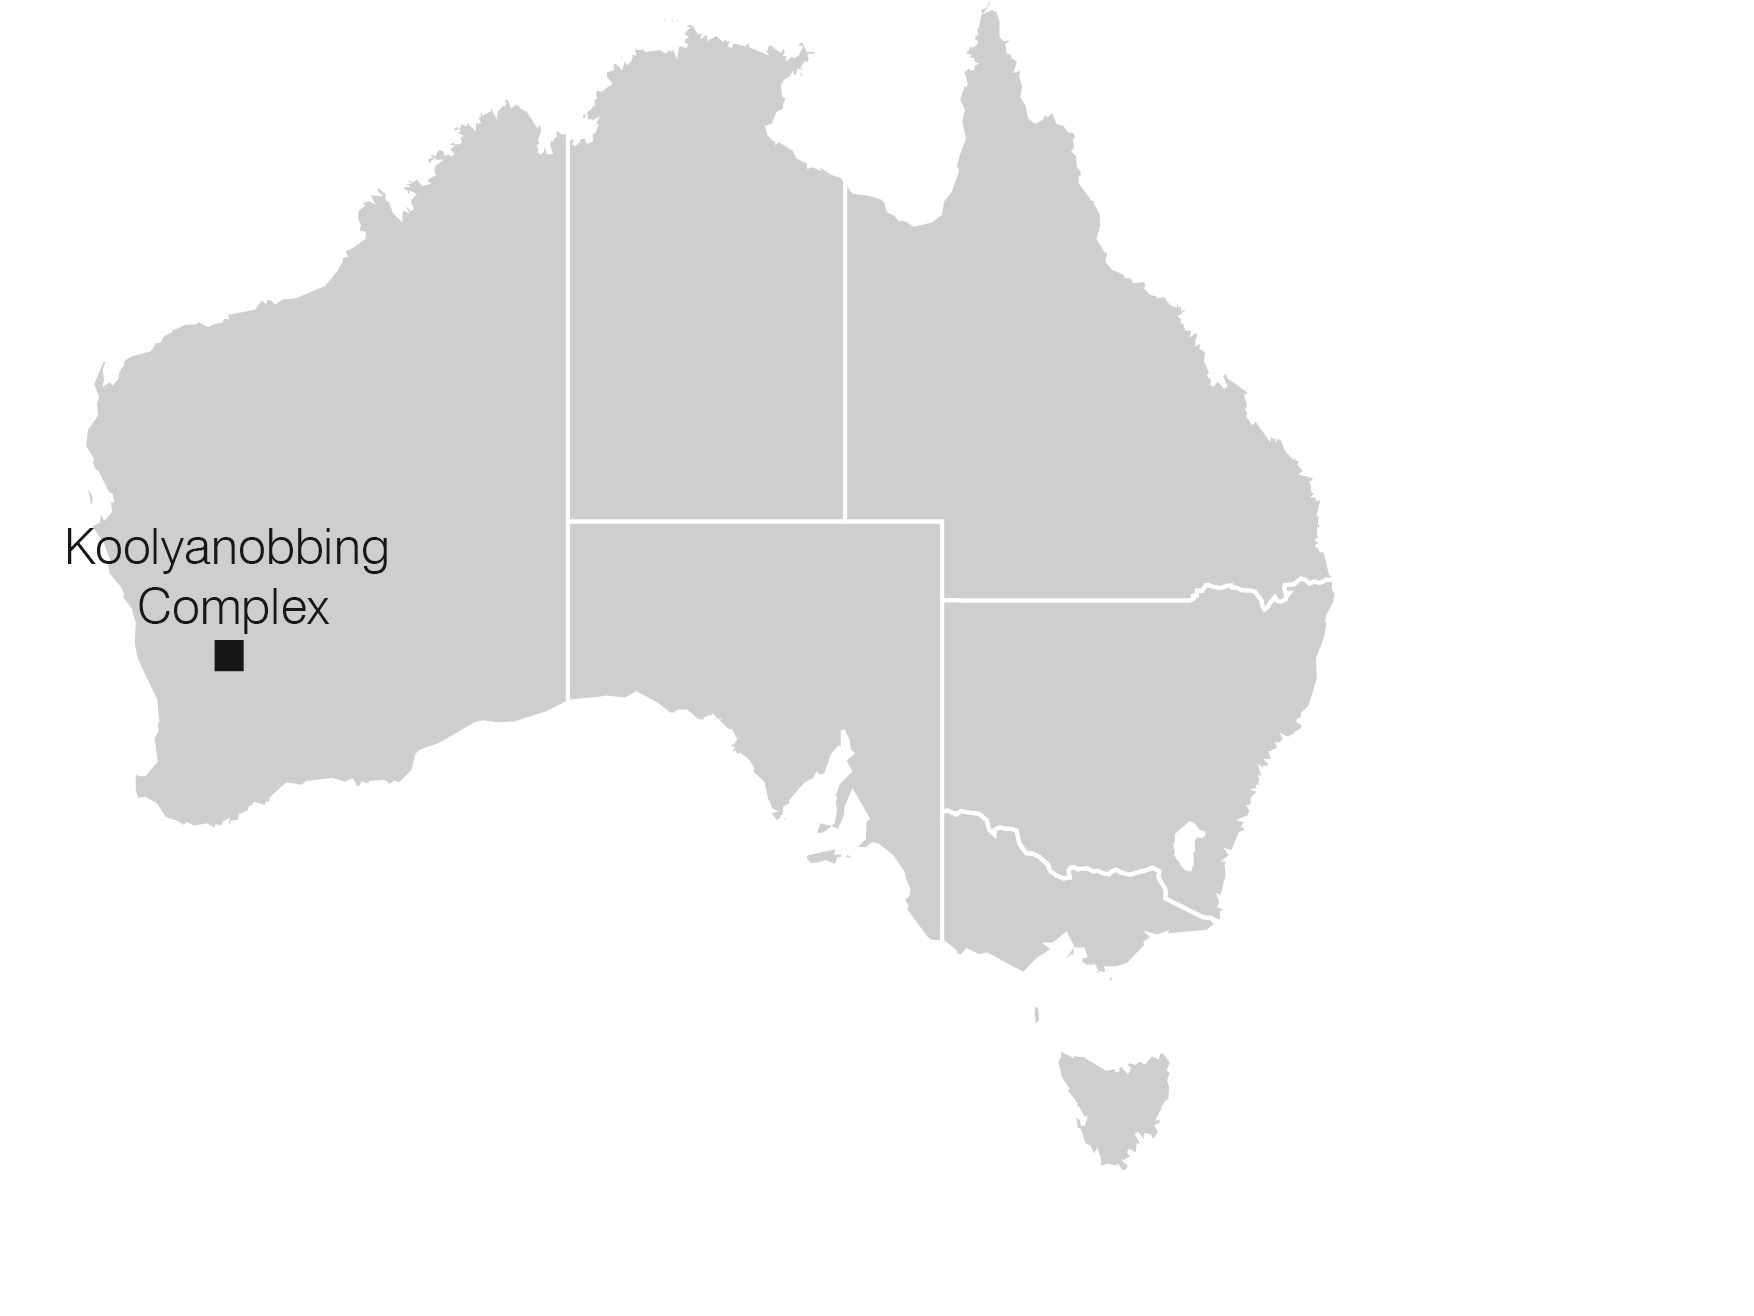
Our Asia Pacific Iron Ore operations are located in Western Australia and, as of December 31, 2014, consist solely of our wholly owned Koolyanobbing complex. Our 50 percent equity interest in Cockatoo Island also was included in these operations through September 2012, at which time we sold our interest.
The Koolyanobbing operations serve the Asian iron ore markets with direct-shipped fines and lump ore. The lump products are fed directly to blast furnaces, while the fines products are used as sinter feed. The variation in the two export product grades reflects the inherent chemical and physical characteristics of the ore bodies mined as well as the supply requirements of our customers. In September 2010, our Board of Directors approved a capital project at our Koolyanobbing operation, which was completed in the second quarter of 2012, and increased production capacity at Koolyanobbing to approximately 11.0 million metric tons annually. Production in 2014 was 11.4 million metric tons, compared with 11.1 million metric tons in 2013 and 10.7 million metric tons in 2012.
Koolyanobbing is a collective term for the operating deposits at Koolyanobbing, Mount Jackson and Windarling. There are approximately 70 miles separating the three mining areas. Banded iron formations host the mineralization, which is predominately hematite and goethite. Each deposit is characterized with different chemical and physical attributes and, in order to achieve customer product quality, ore in varying quantities from each deposit must be blended together.
Crushing and blending are undertaken at Koolyanobbing, where the crushing and screening plant is located. Once the blended ore has been crushed and screened into a direct lump and fines shipping product, it is transported by rail approximately 360 miles south to the Port of Esperance, via Kalgoorlie, for shipment to our customers in Asia.
On July 31, 2012, we entered into a definitive asset sale agreement with our joint venture partner, HWE Cockatoo Pty Ltd., to sell our beneficial interest in the mining tenements and certain infrastructure of Cockatoo Island to Pluton Resources, which agreement was amended on August 31, 2012. On September 7, 2012, the closing date, Pluton Resources paid a nominal sum of AUD $4.00 and assumed ownership of the assets and responsibility for the environmental rehabilitation obligations and other assumed liabilities not inherently attached to the tenements acquired. The rehabilitation obligations and assumed liabilities that inherently are attached to the tenements were transferred to Pluton Resources upon registration by the Department of Mining and Petroleum denoting Pluton Resources as the tenement holder. Upon final settlement of the sale, which was completed during the second quarter of 2013, we extinguished approximately $18.6 million related to the estimated cost of the rehabilitation. As of December 31, 2013, we had no remaining rehabilitation obligations related to Cockatoo Island. Our production at Cockatoo Island continued until the completion of Stage 3 mining in September 2012. Our portion of Cockatoo's annual production of iron ore premium fines totaled 0.6 million metric tons in 2012. We had no production at Cockatoo Island in 2014 and 2013 due to the sale of our interest in Cockatoo Island during the third quarter of 2012.
Asia Pacific Iron Ore Customers
Asia Pacific Iron Ore’s production is under contract with steel companies primarily in China, Japan, Korea and Taiwan. Generally, we have two-year or three-year term supply agreements with steel producers in China and two-year supply agreements in Japan. Pricing for our Asia Pacific Iron Ore customers consists of shorter-term pricing mechanisms of various durations up to one month based on the average of daily spot prices that are generally associated with either unloading each shipment or the time of loading. The existing contracts are due to expire at various dates until March 2015 for our Chinese and Japanese customers which are customarily renewed in conjunction with our customers' fiscal year.
During 2014, 2013 and 2012, we sold 11.5 million, 11.0 million and 11.7 million metric tons of iron ore, respectively, from our Western Australia mines. No Asia Pacific Iron Ore customer comprised more than 10 percent of Cliffs consolidated sales in 2014, 2013 or 2012. Asia Pacific Iron Ore’s five largest customers accounted for approximately 38 percent of the segment’s sales in 2014, 42 percent in 2013 and 44 percent in 2012.
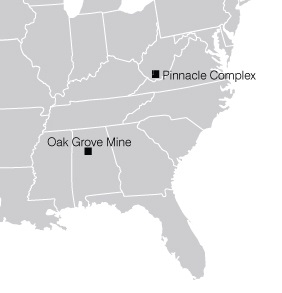
North American Coal
We own and operate two low-volatile metallurgical coal operations located in Alabama and West Virginia that currently have a rated capacity of 6.5 million tons of production annually as of December 31, 2014. In 2014, we sold a total of 7.4 million tons, compared with 7.3 million tons in 2013 and 6.5 million tons in 2012. In the fourth quarter of 2014, we sold our CLCC assets, which consisted of two high-volatile metallurgical coal mines and a thermal coal mine. The sale was completed on December 31, 2014. Sales tons at the CLCC operations were 2.4 million tons, 2.2 million tons and 2.1 million tons for the years ended December 31, 2014, 2013, and 2012, respectively, and are included in the sales tons disclosed above.
Metallurgical coal generally is sold at a premium over the more prevalently mined thermal coal, which generally is utilized to generate electricity. Metallurgical coal receives this premium because of its coking characteristics, which include contraction and expansion when heated, and volatility, which refers to the loss in mass when coal is heated in the absence of air. Coals with lower volatility are valued more highly than coals with a higher volatility.
Each of our North American coal mines are positioned near rail or barge lines providing access to international shipping ports, which allows for export of our coal production.
North American Coal Customers
North American Coal’s metallurgical coal production is sold to global integrated steel and coke producers in Europe, North America, China, India and South America and its thermal coal production was sold to energy companies and distributors in North America and Europe. Approximately 56 percent of our 2014 and 70 percent of our 2013 production was committed under contracts of at least one year. Approximately 45 percent of our projected 2015 sales has been committed and priced. North American contract negotiations are largely completed, and international contract negotiations recently have begun. The remaining tonnage primarily is pending price negotiations with our international customers, which typically is dependent on settlements of Australian pricing for metallurgical coal. International customer contracts typically are negotiated on a fiscal year basis extending from April 1 through March 31, whereas customer contracts in North America typically are negotiated on a calendar year basis extending from January 1 through December 31.
International and North American sales represented 64 percent and 36 percent, respectively, of our North American Coal sales in 2014. This compares with 61 percent and 39 percent, respectively, in 2013 and 66 percent and 34 percent, respectively, in 2012. The segment’s five largest customers together accounted for a total of 48 percent, 57 percent and 50 percent of North American Coal product revenues for the years 2014, 2013 and 2012, respectively. Refer to Concentration of Customers below for additional information regarding our major customers.
Eastern Canadian Iron Ore
We own two iron ore mines in Eastern Canada, the Bloom Lake mine and the Wabush Scully mine.
As disclosed in the first quarter of 2014, at the end of March 2014, we idled our Wabush Scully mine in Newfoundland and Labrador and in November 2014, we began to implement the permanent closure plan for the mine. The idle and ultimate closure was driven by the unsustainable high cost structure. Additionally, we disclosed in November 2014, that we were pursuing exit options for our Bloom Lake mine. As disclosed in January 2015, active production at the Bloom Lake mine has ceased and the mine has transitioned to "care-and-maintenance" mode. Together, the shutdown of the Wabush Scully mine and the cessation of operations at our Bloom Lake mine represent a complete curtailment of our Eastern Canadian Iron Ore operations.
We had been producing a concentrate product at our Bloom Lake operation and, starting in the second half of 2013 through the idle in the first quarter of 2014, we had been producing a concentrate product at our Wabush operation in Eastern Canada. The concentrate products had been marketed toward steel producers, predominately based in Asia, that have sintering capabilities at their steel-making operations. The Bloom Lake concentrate was blended with other sinter fines and materials at high temperatures, creating a direct charge product used in blast furnace operations.
We produced “high manganese” pellets, both in standard and fluxed grades, through June 2013 at our Wabush operation in Eastern Canada, where there is more natural manganese in the crude ore than is found at our other operations. The manganese contained in the iron ore mined at Wabush cannot be removed entirely during the concentrating process.
For the year ended December 31, 2014, we produced a total of 6.2 million metric tons of concentrate.
Both Eastern Canadian Iron Ore mines are located near the St. Lawrence Seaway. Our iron ore products had been transported via railroads to loading ports for shipment via vessel to steelmakers in North America or into the international seaborne market.
Eastern Canadian Iron Ore Customers
Our Eastern Canadian Iron Ore revenues were derived from sales to customers in Asia, Europe and North America. We had various customers for iron ore concentrate and pellets, of which our partner in the Bloom Lake mine is considered a major customer for iron ore concentrate. Pricing for our Eastern Canadian Iron Ore customers consisted primarily of short-term pricing arrangements that were linked to spot market pricing.
During 2014, 2013 and 2012, we sold 7.2 million, 8.6 million and 8.9 million metric tons of iron ore concentrate and pellets, respectively, from our Eastern Canadian Iron Ore mines, with the segment’s five largest customers together accounting for a total of 88 percent, 70 percent and 62 percent of Eastern Canadian Iron Ore product revenues, respectively. Refer to Concentration of Customers below for additional information regarding our major customers.
Investments
Amapá
On December 27, 2012, our Board of Directors authorized the sale of our 30 percent interest in Amapá. Per this original agreement, together with Anglo, we were to sell our respective interest in a 100 percent sale transaction to Zamin.
On March 28, 2013, an unknown event caused the Santana port shiploader to collapse into the Amazon River, preventing further ship loading by the mine operator, Anglo. In light of the Santana port shiploader collapse and subsequent evaluation of the effect that this event had on the carrying value of our investment in Amapá as of June 30, 2013, we recorded an impairment charge of $67.6 million in the second quarter of 2013.
On August 28, 2013, we entered into additional agreements to sell our 30 percent interest in Amapá to Anglo for nominal cash consideration, plus the right to certain contingent deferred consideration upon the two-year anniversary of the closing. The closing was conditional on obtaining certain regulatory approvals and the additional agreement provided Anglo with an option to request that we transfer our interest in Amapá directly to Zamin. Anglo exercised this option and the transfer to Zamin closed in the fourth quarter of 2013. Our interest in Amapá previously was reported as our Latin American iron ore operating segment.
Sonoma
On July 10, 2012, we entered into a definitive share and asset sale agreement to sell our 45 percent economic interest in the Sonoma joint venture coal mine located in Queensland, Australia. Upon completion of the transaction on November 12, 2012, we collected approximately AUD $141.0 million in net cash proceeds. The assets sold included our interests in the Sonoma mine along with our ownership of the affiliated wash plant, which were previously reported as our Asia Pacific Coal operating segment. Production and sales totaled approximately 2.8 million and 2.9 million metric tons of coal, respectively, through the sale completion date.
Applied Technology, Research and Development
We have been a leader in iron ore mining and process technology for more than 160 years. We operated some of the first mines on Michigan’s Marquette Iron Range and pioneered early open-pit and underground mining methods. From the first application of electrical power in Michigan’s underground mines to the use of today’s sophisticated computers and global positioning satellite systems, we have been a leader in the application of new technology to the centuries-old business of mineral extraction. Today, our engineering and technical staffs are engaged in full-time technical support of our operations and improvement of existing products.
With state-of-the-art equipment and experienced technical professionals, we remain on the forefront of mining technology. We have an unsurpassed reputation for our pelletizing technology, delivering a world-class quality product to a broad range of sophisticated end users. We are a pioneer in the development of emerging reduction technologies, a leader in the extraction of value from challenging resources and a frontrunner in the implementation of safe and sustainable technology. Our technical experts are dedicated to excellence and deliver superior technical solutions tailored to our customer base.
Concentration of Customers
Based on re-casted information to account for the acquisition of Severstal assets in Dearborn, Michigan by AK Steel in 2014 and 2012, we had two customers that individually accounted for more than 10 percent of our consolidated product revenue. In 2013, we had one customer that individually accounted for more than 10 percent of our consolidated product revenue. Product revenue from those customers represented in the chart below totaled approximately $1.6 billion, $1.5 billion and $1.6 billion of our total consolidated product revenue in 2014, 2013 and 2012, respectively, and is attributable to our U.S. Iron Ore, North American Coal and Eastern Canadian Iron Ore business segments. The following represents sales revenue from each of these customers as a percentage of our total consolidated product revenue, as well as the portion of product sales for U.S. Iron Ore, Eastern Canadian Iron Ore and North American Coal that is attributable to each of these customers in 2014, 2013 and 2012, respectively:
|
| | | | | | | | | | |
| | | Percentage of Total Product Revenue1 |
Customer2 | | 2014 | | 2013 | | 2012 |
ArcelorMittal | | 22 | % | | 19 | % | | 17 | % |
AK Steel3 | | 15 | % | | 9 | % | | 12 | % |
1 Excluding freight and venture partners’ cost reimbursements. |
2 Includes subsidiaries. |
3 Effective September 16, 2014, AK Steel completed the acquisition of Severstal North America's integrated steelmaking assets located in Dearborn, Michigan. For comparative purposes, we have combined historical data for all periods presented. |
|
| | | | | | | | | | | | | | | | | | | | | | | | | | | | |
| | | Percentage of U.S. Iron Ore Product Revenue1 | | Percentage of North American Coal Product Revenue1 | | Percentage of Eastern Canadian Iron Ore Product Revenue1 |
Customer2 | | 2014 | | 2013 | | 2012 | | 2014 | | 2013 | | 2012 | | 2014 | | 2013 | | 2012 |
ArcelorMittal | | 40 | % | | 36 | % | | 32 | % | | 7 | % | | 7 | % | | 5 | % | | — | % | | 10 | % | | 9 | % |
AK Steel3 | | 28 | % | | 21 | % | | 27 | % | | — | % | | — | % | | — | % | | — | % | | — | % | | — | % |
1 Excluding freight and venture partners’ cost reimbursements. |
2 Includes subsidiaries. |
3 Effective September 16, 2014, AK Steel completed the acquisition of Severstal North America's integrated steelmaking assets located in Dearborn, Michigan. For comparative purposes, we have combined historical data for all periods presented. |
ArcelorMittal USA
Our pellet supply agreements with ArcelorMittal USA are the basis for supplying pellets to ArcelorMittal USA, which is based on customer requirements, except for the Indiana Harbor East facility, which is based on customer excess requirements. The following table outlines the expiration dates for each of the respective agreements:
|
| |
Facility | Agreement Expiration |
Cleveland Works and Indiana Harbor West facilities | December 2016 |
Indiana Harbor East facility | January 2017 |
ArcelorMittal USA is a 62.3 percent equity participant in Hibbing, as well as, a 21.0 percent equity partner in Empire with limited rights and obligations.
In 2014, 2013 and 2012, our U.S. Iron Ore pellet sales to ArcelorMittal were 10.2 million, 9.5 million and 8.6 million tons, respectively, and our Eastern Canadian Iron Ore pellet and concentrate sales to ArcelorMittal were none, 0.9 million and 0.7 million metric tons, respectively.
In 2014, 2013 and 2012, our North American Coal sales to ArcelorMittal were 0.5 million, 0.5 million and 0.3 million tons, respectively. We do not have any contracts with ArcelorMittal associated with the remaining North American Coal operations, due to our major contract with ArcelorMittal being transferred to the buyer of our CLCC operations. The sale of CLCC was completed on December 31, 2014.
AK Steel
On September 16, 2014, AK Steel announced an acquisition of Severstal North America’s integrated steelmaking assets located in Dearborn, Michigan. We have a long-term relationship to supply iron ore pellets to Severstal’s steelmaking assets at that location. Upon consummation of the acquisition, the contract was automatically assigned to AK Steel. The combination of sales pursuant to our preexisting sales agreement with AK Steel and the acquisition of the Dearborn facility with its sales agreement accounts for more than 10 percent of our consolidated product revenue in 2014.
On August 29, 2013 we entered into a new agreement with AK Steel to provide iron ore pellets to AK Steel for use in its Middletown, Ohio and Ashland, Kentucky blast furnace facilities. This contract includes minimum and maximum tonnage requirements for each year between 2014 and 2023.
Under the original agreement entered into with Severstal in 2006, we supply all of the Dearborn, Michigan facility’s blast furnace pellet requirements through 2022, subject to specified minimum and maximum requirements in certain years. AK Steel was the successor by merger of this contract and it remains in force. In September 2014, we entered into an amendment to the Dearborn contract with AK Steel to document the 2013 base pricing provisions, among other things, which resulted from an arbitration ruling in May 2014.
In 2014, 2013 and 2012, our U.S. Iron Ore pellet sales to AK Steel and the acquired Dearborn facility were 5.8 million, 4.1 million and 5.7 million tons, respectively.
Competition
Throughout the world, we compete with major and junior mining companies, as well as metals companies, both of which produce steelmaking raw materials, including iron ore and metallurgical coal.
North America
In our U.S. Iron Ore business segment, we primarily sell our product to steel producers with operations in North America. In our now shuttered Eastern Canadian Iron Ore business segment, we primarily had provided our product to the seaborne market for Asian steel producers. We compete directly with steel companies that own interests in iron ore mines, including ArcelorMittal and U.S. Steel, and with major iron ore exporters from Australia and Brazil. Additionally, in the last year, there has been a 38 percent increase in steel imported into the U.S. to 44.3 million tons during the first 11 months of 2014, despite the imposition of new import tariffs last summer. This reduced demand for U.S. produced steel and directly affect the demand for iron ore within North America.
In the coal industry, our North American Coal business segment competes with many metallurgical coal producers of various sizes, including Alpha Natural Resources, Inc., Patriot Coal Corporation, CONSOL Energy Inc., Arch Coal, Inc., Walter Energy, Inc., Peabody Energy Corp. and other producers located in North America and globally.
A number of factors beyond our control affect the markets in which we sell our iron ore and coal. Continued demand for our iron ore and metallurgical coal and the prices obtained by us primarily depend on the consumption patterns of the steel industry in the U.S., China and elsewhere around the world, as well as the availability, location, cost of transportation and competing prices. Coal consumption patterns primarily are affected by demand, environmental and other governmental regulations and technological developments. The most important factors on which we compete are delivered price, coal quality characteristics such as heat value, sulfur, ash, volatile matter and moisture content and reliability of supply. Metallurgical coal, which primarily is used to make coke, a key component in the steelmaking process, generally sells at a premium over thermal coal due to its higher quality and value in the steelmaking process.
Asia Pacific
In our Asia Pacific Iron Ore business segment, we export iron ore products to the Asia Pacific markets, including China, Japan, Korea and Taiwan. In the Asia Pacific marketplace, we compete with major iron ore exporters from Australia, Brazil, South Africa and India. These include Anglo, BHP Billiton, Fortescue Metals Group Ltd., Rio Tinto plc and Vale, among others.
Competition in steelmaking raw materials is predicated upon the usual competitive factors of price, availability of supply, product quality and performance, service and transportation cost to the consumer of the raw materials.
Environment
Our mining and limited exploration activities are subject to various laws and regulations governing the protection of the environment. We conduct our operations in a manner that is protective of public health and the environment and believe our operations are in compliance with applicable laws and regulations in all material respects.
Environmental issues and their management continued to be an important focus at each of our operations throughout 2014. In the construction of our facilities and in their operation, substantial costs have been incurred and will continue to be incurred to avoid undue effect on the environment. Our capital expenditures relating to environmental matters totaled approximately $33 million, $32 million and $31 million, in 2014, 2013 and 2012, respectively. It is estimated that capital expenditures for environmental improvements will total approximately $42 million in 2015. Estimated expenditures in 2015 are comprised of approximately $35 million for projects in our U.S. Iron Ore operations and $7 million in our North American Coal operations for various water treatment, air quality, dust control, selenium management, tailings management and other miscellaneous environmental projects.
Regulatory Developments
Various governmental bodies continually promulgate new or amended laws and regulations that affect our Company, our customers and our suppliers in many areas, including waste discharge and disposal, the classification of materials and products, air and water discharges and many other environmental, health and safety matters. Although we believe that our environmental policies and practices are sound and do not expect that the application of any current laws or regulations reasonably would be expected to result in a material adverse effect on our business or financial condition, we cannot predict the collective adverse impact of the expanding body of laws and regulations.
Specifically, there are several notable proposed or potential rulemakings or activities that could potentially have a material adverse impact on our facilities in the future depending on their ultimate outcome: Climate Change and GHG Regulation, Regional Haze, NO2 and SO2 National Ambient Air Quality Standards, Cross State Air Pollution Rule, increased administrative and legislative initiatives related to coal mining activities, Mercury TMDL and Minnesota Taconite Mercury Reduction Strategy's evolving scope of the Clean Water Act and definition of “Waters of the United States” and Selenium Discharge Regulation.
Climate Change and GHG Regulation
With the complexities and uncertainties associated with the U.S. and global navigation of the climate change issue as a whole, one of our significant risks for the future is mandatory carbon legislation. Policymakers are in the design process of carbon regulation at the state, regional, national and international levels. The current regulatory patchwork of carbon compliance schemes presents a challenge for multi-facility entities to identify their near-term risks. Amplifying the uncertainty, the dynamic forward outlook for carbon regulation presents a challenge to large industrial companies to assess the long-term net impacts of carbon compliance costs on their operations. Our exposure on this issue includes both the direct and indirect financial risks associated with the regulation of GHG emissions, as well as potential physical risks associated with climate change. We are continuing to review the physical risks related to climate change utilizing a formal risk management process.
Internationally, mechanisms to reduce emissions are being implemented in various countries, with differing designs and stringency, according to resources, economic structure and politics. We expect that momentum to extend carbon regulation will continue. Australia and Canada are signatories to the Kyoto Protocol. As such, our facilities in each of these countries are impacted by the Kyoto Protocol, but in varying degrees according to the mechanisms each country establishes for compliance and each country’s commitment to reducing emissions. Australia and Canada are considered Annex 1 countries, meaning that they are obligated to reduce their emissions under the Protocol. The impact of the Kyoto Protocol on our Canadian operations has diminished with the idling of our Canadian operations.
In Australia, legislation for a carbon tax was passed in July 2012. The direct impact of the carbon tax on our Asia Pacific operations primarily occurs through increased fuel costs. The tax was estimated to result in an increase in direct costs of approximately A$3.5 million per year however following a change of Federal Government in September 2013 the carbon tax was repealed in July 2014.
In the U.S., federal carbon regulation potentially presents a significantly greater impact to our operations. To date, the U.S. has not legislated carbon constraints. In the absence of comprehensive federal carbon legislation, numerous state and regional regulatory initiatives are under development or are becoming effective, thereby creating a disjointed approach to carbon control. On June 25, 2013, President Obama issued a memorandum directing the EPA to develop carbon emission standards for both new and existing power plants under the Clean Air Act's NSPS. On January 8, 2014, the EPA proposed NSPS regulating carbon dioxide emissions from new fossil fuel-fired power plants. On June 2, 2014, EPA proposed the ‘Clean Power Plan’ which consists of NSPS regulating carbon dioxide from existing power plants at a level 30 percent below 2005 levels by 2030. States must submit Clean Power Plan SIPs by June 2016, though extension waivers will be made available. As proposed these rules would not affect our Silver Bay power generating facility.
As an energy-intensive business, our GHG emissions inventory captures a broad range of emissions sources, such as iron ore furnaces and kilns, coal thermal driers, diesel mining equipment and our wholly owned Silver Bay power generation plant, among others. As such, our most significant regulatory risks are: (1) the costs associated with on-site emissions levels, and (2) the costs passed through to us from power generators and distillate fuel suppliers.
We believe our exposure can be reduced substantially by numerous factors, including currently contemplated regulatory flexibility mechanisms, such as allowance allocations, fixed process emissions exemptions, offsets and international provisions; emissions reduction opportunities, including energy efficiency, biofuels, fuel flexibility, emerging shale gas, coal mine methane offset reduction; and business opportunities associated with new products and technology.
We have worked proactively to develop a comprehensive, enterprise-wide GHG management strategy aimed at considering all significant aspects associated with GHG initiatives to plan effectively for and manage climate change issues, including risks and opportunities as they relate to the environment, stakeholders, including shareholders and the public, legislative and regulatory developments, operations, products and markets.
Regional Haze
In June 2005, the EPA finalized amendments to its regional haze rules. The rules require states establish goals and emission reduction strategies for improving visibility in all Class I national parks and wilderness areas. Among the states with Class I areas are Michigan, Minnesota, Alabama and West Virginia in which we currently own and manage mining operations. The first phase of the regional haze rule (2008-2018) requires analysis and installation of BART on eligible emission sources and incorporation of BART and associated emission limits into SIPs.
Minnesota submitted a regional haze SIP to the EPA on December 30, 2009, and a supplement to the SIP on May 8, 2012. Michigan submitted its regional haze SIP to the EPA on November 5, 2010. During the second quarter of 2012, the EPA also sent information requests to all taconite facilities requesting information on SO2 and NOx emissions
and control technology assessments. On June 12, 2012, the EPA approved revisions to the Minnesota SIP addressing regional haze, but also announced it was deferring action on emission limitations that Minnesota intended to represent BART for taconite facilities. On August 15, 2012, the EPA proposed to deny the Michigan and Minnesota taconite SIP BART determinations and simultaneously proposed a separate FIP for taconite facilities. During the comment period for the proposed FIP rule, the taconite industry and other stakeholders developed detailed comments and shared information to address furnace specific case-by-case circumstances. On January 15, 2013, the EPA signed the final FIP for taconite facilities. The final FIP reflects progress toward a more technically and economically feasible regional haze implementation plan and eliminates the need for investing in additional SO2 emission control equipment. However, we remain concerned about the technical and economic feasibility of EPA's BART determination for NOx emissions and we filed a petition for review in the 8th Circuit Court and subsequently received a judicial stay of the FIP which enabled us to conduct a detailed engineering analysis to determine the impact of the regulations on each unique iron ore indurating furnace affected by this rule. The results of this analysis enabled us to reach a settlement with EPA which was public noticed in the Federal Register on January 30, 2015. Cost estimates associated with the settlement are reflected in our 5-year capital plan.
NO2 and SO2 National Ambient Air Quality Standards
During the first half of 2010, the EPA promulgated rules that require states to use a combination of air quality monitoring and computer modeling to determine areas of each state that are in attainment with new NO2 and SO2 standards and those areas that are not in attainment with such standards. During the third quarter of 2011, the EPA issued guidance to the regulated community on conducting refined air quality dispersion modeling and implementing the new NO2 and SO2 standards. The NO2 and SO2 standards have been challenged by various large industry groups. Accordingly, at this time, we are unable to predict the final impact of these standards. During June 2011, our Minnesota iron ore mining operations received a request from the MPCA to develop modeling and compliance plans and timelines by which each facility would demonstrate compliance with present and proposed NAAQS as well as regional haze requirements outlined in the SIP. Compliance must be achieved by June 30, 2017 according to the initial state orders, although the EPA has indicated that the SO2 attainment area designation timelines have been extended out to 2020. We continue to assess options by which to achieve compliance and seek alignment between the state and federal expectations.
Cross State Air Pollution Rule
On July 6, 2011, the EPA promulgated the CSAPR, which was intended to be an emissions trading rule for SO2 and NOx. Northshore's Silver Bay Power Plant would have been subject to this rule, however Minnesota elected to follow EPA guidance allowing CSAPR to stand as BART. CSAPR was vacated by the D.C. Circuit Court during the third quarter of 2012. Late in 2014, the Supreme Court re-instated CSAPR with an effective date of January 1, 2015, re-instating the obligations of this rule for Silver Bay Power. Immediate compliance obligations are being met at this time, with the material obligation being procurement of the first year of emissions allowances by March 2016 for the 2015 operating year. Silver Bay Power is completing the engineering and permitting work to install controls that will limit the cost exposure to the trading market. The allowance pricing market is continuing to fluctuate so price impacts are not yet certain, we anticipate the annual costs will be less than $1 million for 2015 and gradually decreasing to less than $400,000 per year after we complete our emission reduction project in 2017.
Increased Administrative and Legislative Initiatives Related to Coal Mining Activities
Although the focus of significantly increased government activity related to coal mining in the U.S. is generally targeted at eliminating or minimizing the adverse environmental impacts of mountaintop coal mining practices, these initiatives have the potential to impact all types of coal operations, including subsurface longwall mining typically deployed for recovering metallurgical coal. Specifically, the coordinated efforts by various federal agencies to further regulate mountaintop mining have slowed issuance of the permits required by many mining projects in Appalachia. Due to the developing nature of these initiatives and their potential to disrupt even routine mining and water permit practices in the coal industry, we are unable to predict whether these initiatives could have a material effect on our coal operations in the future. We are working closely with our trade associations to monitor the various rulemaking developments in an effort to enable us to develop viable strategies to minimize the financial impact to the business.
Mercury TMDL and Minnesota Taconite Mercury Reduction Strategy
TMDL regulations are contained in the Clean Water Act. As a part of Minnesota's Mercury TMDL Implementation Plan, in cooperation with the MPCA, the taconite industry developed a Taconite Mercury Reduction Strategy and signed a voluntary agreement in 2009 to effectuate its terms. The strategy includes a 75 percent target reduction of mercury air emissions from Minnesota pellet plants collectively by 2025. It recognizes that mercury emission control technology currently does not exist and will be pursued through a research effort. According to the voluntary agreement, any developed technology must meet the “adaptive management criteria” such that the technology must be economically feasible, must not impact pellet quality, and must not cause excessive corrosion in pellet furnaces, associated duct work and existing wet scrubbers on the furnaces.
According to the voluntary agreement, the mines proceeded with medium- and long-term testing of possible technologies. For Cliffs, the requirements in the voluntary agreement applies to the United Taconite and Hibbing facilities. At this time, we are unable to predict the potential impacts of the voluntary Taconite Mercury Reduction Strategy. However, a number of research projects were conducted between 2011 and 2014 as the industry continues to assess options for reduction. While injection of powdered activated carbon into furnace off-gasses for mercury capture in the wet scrubbers showed positive initial results, further testing during 2013 yielded lower overall potential. Alternate technologies are presently being assessed in our ongoing efforts to develop cost effective mercury reduction technologies for our indurating furnaces.
On September 22, 2014, Minnesota promulgated the Mercury Air Emissions Reporting and Reduction Rule mandating mercury air emissions reporting and reduction. The adopted rule expanded applicability to all of our Minnesota operations and requires submitting a mercury reduction plan in 2018 to reduce mercury emissions from all of our Minnesota taconite furnaces by 72 percent by January 2025 and 70 percent reduction from Northshore’s industrial boilers by January 1, 2018. The adopted rule does not include all four Adaptive Management Criteria for evaluating mercury reduction, which were agreed upon in the October 2009 Minnesota’s Mercury TMDL Implementation Plan.
To date, there is currently no proven technology to cost effectively reduce mercury emissions from taconite furnaces to the target level of 72 percent that would meet all four Adaptive Management Criteria. We remain concerned about the technical and economic feasibility to reduce taconite mercury emissions by 72 percent and are conducting detailed engineering analysis to determine the impact of the regulations on each unique iron ore indurating furnace affected by this rule. The results of this analysis will guide further dialog with the MPCA regarding our implementation of the requirements.
Selenium Discharge Regulation
Our North American Coal operations have numerous NPDES permits with either selenium discharge limits or draft permits with selenium limits. We have achieved, or have projects underway that will achieve compliance at all discharges. As such, we do not believe this issue will likely have a material impact to our North American Coal operations.
In Michigan, the MDEQ issued renewed NPDES permits for our Empire mine in December 2011 and for our Tilden mine in 2012. Our Michigan operations at Empire and Tilden are developing compliance strategies to meet new selenium process water limits according to the permit conditions. Empire and Tilden submitted the Selenium Storm Water Management Plan to the MDEQ in December 2011. The Selenium Storm Water Management Plan outlines the activities that will be undertaken to address selenium in storm water discharges from our Michigan operations. The activities include the evaluation of structural controls, non-structural controls, site specific standards, and evaluation of potential impacts to groundwater. Pilot treatment systems have had good initial results and evaluation work continues. An initial estimate for full scale implementation of storm water treatment systems and structural selenium controls at both facilities is approximately $63 million. The results from the evaluation of existing pilot and demonstration-scale work will determine if these structural controls are utilized, or if alternatives must be applied.
Tilden's NPDES permit renewal became effective on November 1, 2012. The permit contains a compliance schedule for selenium with a limit of five µg/l that will be effective as of November 1, 2017, at Tilden's Gribben Tailings Basin outfall. Tilden has initiated a prudent and feasible alternatives analysis to further define solutions and cost estimates. Preliminary testing and engineering for end-of-pipe solutions indicates capital costs are likely to be less than the previously estimated range of $96 million to $146 million. The next phase of engineering and updated cost estimates are scheduled to be concluded in the first half of 2015. In May 2014, the EPA proposed new selenium fish tissue limits and a lower lentic water column concentration criterion which may increase the cost for treatment. We are incorporating this contingency into our planning and treatment technology development.
Definition of “Waters of the United States” Under the Clean Water Act
The EPA and Army Corps of Engineers’ proposed rule, “Definition of ‘Waters of the United States’ Under the Clean Water Act,” 79 Fed. Reg. 22188 (Apr. 21, 2014), attempts to add clarity to which waters are jurisdictional under the federal Clean Water Act, and will apply to all Clean Water Act programs, including the Sec. 402 and Sec. 404 permitting programs, Sec. 311 spill prevention program and Sec. 401 state certification process. It is unclear how the federal and state agencies will implement and enforce the final rule, and how the courts will interpret going forward, however, there is substantial cause to be concerned in several areas of the draft. The draft regulation may expand EPA’s authority under the Clean Water Act to many traditionally unregulated mine features such as mine pits, pit lakes, on site ditches, water retention structures, and tailings basins creating a new burden on our U.S. facilities. This could further be interpreted to add questionable regulatory authority over the groundwater connections between these features and nearby traditionally navigable waters. We are actively participating in the rulemaking development and assessing the potential impacts to our operations.
For additional information on our environmental matters, refer to Item 3. Legal Proceedings and NOTE 11 - ENVIRONMENTAL AND MINE CLOSURE OBLIGATIONS in Item 8. Financial Statements and Supplementary Data of this Annual Report on Form 10-K.
Energy
Electricity
The state of Michigan is a deregulated electricity state, which affords our mines the ability to purchase electrical energy supply from various suppliers while continuing to purchase distribution service from the incumbent utility. As of September 1, 2013, our Tilden and Empire mines in Michigan exercised the right to purchase electrical supply from Integrys Energy Services while continuing to purchase distribution service from Wisconsin Electric Power Company. The pricing of electricity in the deregulated market is based on the Midwestern Independent System Operator Day-Ahead price. Beginning on February 1, 2015, we began purchasing our electricity supply from the Wisconsin Electric Power Company in a regulated fashion as we terminated our contract with Integrys Energy Services. As of February 1, 2015, Wisconsin Electric Power Company is the sole supplier of electric power to our Empire and Tilden mines. Wisconsin Electric Power Company provides 300 megawatts of electricity to Empire and Tilden at rates that are regulated by the MPSC. The Empire and Tilden mines are subject to changes in Wisconsin Electric Power Company's rates, such as base interim rate changes that Wisconsin Electric Power Company may self-implement and final rate changes that are approved by the MPSC in response to applications filed by Wisconsin Electric Power Company. Additionally, Empire and Tilden are subject to frequent changes in Wisconsin Electric Power Company's power supply adjustment factor.
Electric power for the Hibbing and United Taconite mines is supplied by Minnesota Power. On September 16, 2008, the mines finalized agreements with terms from November 1, 2008 through December 31, 2015. The agreements were approved by the MPUC in 2009.
Silver Bay Power Company, a wholly owned subsidiary of ours, with a 115 megawatt power plant, provides the majority of Northshore’s electrical energy requirements. Silver Bay Power has an interconnection agreement with Minnesota Power for backup power when excess generation is necessary.
Wabush had a 20-year agreement with Newfoundland Power, which ended December 31, 2014. This agreement allowed for an exchange of water rights in return for the power needs for Wabush’s mining operations. Beginning on January 1, 2015, Wabush has a short-term electricity agreement with Newfoundland Hydro Power. The pricing of this agreement is set by the Labrador industrial rate policy. The Wabush pelletizing operation and the Bloom Lake operation in Québec are served by Québec Hydro, which provides power under regulated rates that are set on an annual basis.
The Oak Grove mine and Concord Preparation Plant are supplied electrical power by Alabama Power under a five-year contract that continues in effect until terminated by either party providing written notice to the other in accordance with applicable rules, regulations and rate schedules. Rates of the contract are subject to change during the term of the contract as regulated by the Alabama Public Services Commission.
Electrical power to the Pinnacle Complex is supplied by the Appalachian Power Company under a regulated electrical supply contract. The contract specifies the applicable rate schedule, minimum monthly charge and power capacity furnished. Rates, terms and conditions of the contract are subject to the approval of the Public Service Commission of West Virginia.
Koolyanobbing and its associated satellite mines draw power from independent diesel-fueled power stations and generators. Diesel power generation capacity has been installed at the Koolyanobbing operations.
Process Fuel
We have a long-term contract providing for the transport of natural gas on the Northern Natural Gas Pipeline for our U.S. Iron Ore operations. Our Pinnacle and Oak Grove coal operations also use natural gas, but purchase it through their local regulated utility, Mountaineer Gas and Alabama Gas Co., respectively. At U.S. Iron Ore, the Empire and Tilden mines have the capability of burning natural gas, coal or, to a lesser extent, oil. The Hibbing and Northshore mines have the capability to burn natural gas and oil. The United Taconite mine has the ability to burn coal, natural gas and petroleum coke. Consistent with 2014, we expect during 2015 our U.S. Iron Ore operations will utilize both natural gas and coal to heat furnaces and produce power at our Silver Bay Power facility. At Eastern Canadian Iron Ore, the Wabush mine has the capability to burn bunker fuel, stove and furnace oils and coke breeze and the Bloom Lake mine has the ability to burn stove and furnace oils. Our Eastern Canadian Iron Ore process fuel is primarily supplied by Imperial Oil, a subsidiary of Exxon Mobil, through contracts.
Employees
As of December 31, 2014, we had a total of 5,386 employees.
|
| | | | | | | | | |
| | 2014 | | 2013 | | 2012 |
U.S. Iron Ore1 | | | | | | |
Salaried | | 658 |
| | 700 |
| | 715 |
|
Hourly | | 2,705 |
| | 2,825 |
| | 2,976 |
|
Total | | 3,363 |
| | 3,525 |
| | 3,691 |
|
Asia Pacific Iron Ore 2 | | | | | | |
Salaried | | 139 |
| | 177 |
| | 216 |
|
Hourly | | — |
| | — |
| | — |
|
Total | | 139 |
| | 177 |
| | 216 |
|
North American Coal | | | | | | |
Salaried | | 237 |
| | 379 |
| | 406 |
|
Hourly | | 821 |
| | 1,207 |
| | 1,210 |
|
Total | | 1,058 |
| | 1,586 |
| | 1,616 |
|
Eastern Canadian Iron Ore2 | | | | | | |
Salaried | | 231 |
| | 407 |
| | 459 |
|
Hourly | | 320 |
| | 973 |
| | 956 |
|
Total | | 551 |
| | 1,380 |
| | 1,415 |
|
Corporate & Support Services | | | | | | |
Salaried | | 275 |
| | 470 |
| | 625 |
|
Hourly | | — |
| | — |
| | 26 |
|
Total | | 275 |
| | 470 |
| | 651 |
|
Total | | 5,386 |
| | 7,138 |
| | 7,589 |
|
| | | | | | |
1 Includes our employees and the employees of the U.S. Iron Ore joint ventures. |
2 Excludes contracted mining employees |
As of December 31, 2014, approximately 85.0 percent of our U.S. Iron Ore hourly employees, approximately 100.0 percent of our Eastern Canadian Iron Ore hourly employees and approximately 100.0 percent of our North American Coal hourly employees were covered by collective bargaining agreements.
Hourly employees at our Michigan and Minnesota iron ore mining operations, excluding Northshore, are represented by the USW. The labor agreements that cover approximately 2,200 USW-represented employees at our Empire and Tilden mines in Michigan, and our United Taconite and Hibbing mines in Minnesota are effective September 1, 2012 through September 30, 2015. Employees at our Northshore operations are not represented by a union and are not, therefore, covered by a collective bargaining agreement.
Hourly employees at our Eastern Canadian Iron Ore operations also are represented by the USW. The labor agreement with the USW that covers our represented employees at Bloom Lake is effective from September 1, 2013
through August 31, 2016. The labor agreement with the USW that covers our represented employees at our Pointe Noire facility, is effective from March 1, 2014 through February 28, 2020.
Hourly employees at our Lake Superior and Ishpeming railroads are represented by seven unions covering approximately 105 employees. The labor agreements that cover these employees reopened for bargaining on December 31, 2014 and we are actively bargaining with the seven unions that represent them for successor agreements. These employees negotiate under the Railway Labor Act, which provides that labor agreements remain in force until replaced by a successor agreement. Under the Railway Labor Act work stoppages cannot occur until the parties have engaged in substantial negotiations, have mediated any disputes and have received a release from the National Mediation Board.
Hourly production and maintenance employees at our Pinnacle Complex and Oak Grove mines are represented by the UMWA. Our labor agreements with the UMWA at those locations are effective July 1, 2011 through December 31, 2016. Those agreements are identical in all material respects to the NBCWA of 2011 between the UMWA and the National Bituminous Coal Operators’ Association.
Employees at our Asia Pacific Iron Ore, Corporate and Support Services are not represented by a union and are not, therefore, covered by collective bargaining agreements.
Safety
Safety is our primary core value as we continue towards a zero incident culture at our operating facilities. We continuously monitor, track and measure our safety performance and make changes where necessary. Best practices are shared globally to ensure each mine site can embed our policies, procedures and learnings for enhanced workplace safety. We measure progress toward achieving our objective against regularly established benchmarks, including measuring company-wide TRIR. During 2014, our TRIR (including contractors) was 2.02 per 200,000 man-hours worked.
Refer to Exhibit 95 Mine Safety Disclosures (filed herewith) for mine safety information required in accordance with Section 1503(a) of the Dodd-Frank Act.
Available Information
Our headquarters are located at 200 Public Square, Cleveland, Ohio 44114-2315, and our telephone number is (216) 694-5700. We are subject to the reporting requirements of the Exchange Act and its rules and regulations. The Exchange Act requires us to file reports, proxy statements and other information with the SEC. Copies of these reports and other information can be read and copied at:
SEC Public Reference Room
100 F Street N.E.
Washington, D.C. 20549
Information on the operation of the Public Reference Room may be obtained by calling the SEC at 1-800-SEC-0330.
The SEC maintains a website that contains reports, proxy statements and other information regarding issuers that file electronically with the SEC. These materials may be obtained electronically by accessing the SEC’s home page at www.sec.gov.
We use our website, www.cliffsnaturalresources.com, as a channel for routine distribution of important information, including news releases, investor presentations and financial information. We also make available, free of charge on our website, our Annual Report on Form 10-K, Quarterly Reports on Form 10-Q, Current Reports on Form 8-K and amendments to these reports filed or furnished pursuant to Section 13(a) or 15(d) of the Exchange Act, as soon as reasonably practicable after we electronically file these documents with, or furnish them to, the SEC. In addition, our website allows investors and other interested persons to sign up to receive automatic email alerts when we post news releases and financial information on our website.
We also make available, free of charge on our website, the charters of the Audit Committee, Governance and Nominating Committee and Compensation and Organization Committee as well as the Corporate Governance Guidelines and the Code of Business Conduct & Ethics adopted by our Board of Directors. These documents are available through our investor relations page on our website at ir.cliffsnaturalresources.com. The SEC filings are available by selecting “Financial Information” and then “SEC Filings,” and material and corporate governance is available by selecting “Corporate Governance” for the Board Committee Charters, operational governance guidelines and the Code of Business Conduct and Ethics.
References to our website or the SEC’s website do not constitute incorporation by reference of the information contained on such websites, and such information is not part of this Annual Report on Form 10-K.
Copies of the above-referenced information are also available, free of charge, by calling (216) 694-5700 or upon written request to:
Cliffs Natural Resources Inc.
Investor Relations
200 Public Square
Cleveland, OH 44114-2315
EXECUTIVE OFFICERS OF THE REGISTRANT
Following are the names, ages and positions of the executive officers of the Company as of February 25, 2015. Unless otherwise noted, all positions indicated are or were held with Cliffs Natural Resources Inc.
|
| | |
Name | Age | Position(s) Held |
Lourenco Goncalves | 57 | Chairman of the Board, President and Chief Executive Officer (August 2014 - present); Chairman, President and Chief Executive Officer of Metals USA Holdings Corp., an American manufacturer and processor of steel and other metals (May 2006 - April 2013); President, Chief Executive Officer and a director of Metals USA Inc. (February 2003 - April 2006). |
Terry G. Fedor | 50 | Executive Vice President, United States Iron Ore (January 2014 - present); Vice President (February 2011 - January 2014); Vice President and General Manager (March 2005 - February 2011) of ArcelorMittal Cleveland, a fully integrated steelmaking facility. |
James D. Graham | 49 | Executive Vice President (November 2014 - present); Chief Legal Officer (March 2013 - present); Secretary (March 2014 - present); Vice President (January 2011 - October 2014); General Counsel - Global Operations (January 2011 - March 2013); Assistant General Counsel (April 2007 - December 2010). |
Maurice D. Harapiak | 53 | Executive Vice President, Human Resources (June 2014 - present); Regional Director, Human Resources - Barrick Gold of North America, a gold mining company (November 2011 - June 2014); Senior Director, Human Resources, Capital Projects - Barrick Gold Corporation, a gold mining company (November 2007 - November 2011). |
Terrence R. Mee | 45 | Executive Vice President, Global Commercial (October 2014 - present); Vice President, Global Iron Ore Sales (February 2014 - October 2014); Senior Vice President, Global Iron Ore Sales (March 2012 - February 2014); Senior Vice President, Global Iron Ore & Metallic Sales (January 2011 - March 2012); Vice President, Sales and Transportation (September 2007 - January 2011). |
Terrance M. Paradie | 46 | Executive Vice President (March 2013 - present); Chief Financial Officer (October 2012 - present); Treasurer (September 2014 - February 2015); Senior Vice President (January 2011 - March 2013); Assistant General Manager - Michigan Operations (March 2012 - September 2012); Corporate Controller (October 2007 - March 2012); Chief Accounting Officer (July 2009 - March 2012); Vice President (October 2007 - January 2011). |
Clifford T. Smith | 55 | Executive Vice President, Seaborne Iron Ore (January 2014 − present); Executive Vice President, Global Operations (July 2013 - January 2014); Executive Vice President, Global Business Development (March 2013 - July 2013); Senior Vice President, Global Business Development (January 2011 - March 2013); Vice President, Latin American Operations(September 2009 - January 2011). |
P. Kelly Tompkins | 58 | Executive Vice President, Business Development (October 2014 - present); Executive Vice President, External Affairs and President, Global Commercial (November 2013 - October 2014); Chief Administrative Officer (July 2013 - November 2013); Executive Vice President, Legal, Government Affairs and Sustainability (May 2010 - July 2013). Chief Legal Officer (January 2011 - January 2013); President, Cliffs China (October 2012 - November 2013); Executive vice president and chief financial officer of RPM International Inc., a specialty coatings and sealants manufacturer (June 2008 - May 2010). |
David L. Webb | 57 | Executive Vice President (January 2014 - present); Senior Vice President, Global Coal (July 2011 - January 2014); Vice president and general manager of Mid-West Operations for Patriot Coal Corp., a producer of thermal and metallurgical coal (2007 - June 2011).
|
Timothy K. Flanagan | 37 | Vice President, Corporate Controller & Chief Accounting Officer (March 2012 - present); Assistant Controller (February 2010 - March 2012); and Director, Internal Audit (April 2008 - February 2010). |
All executive officers serve at the pleasure of the Board. There are no arrangements or understandings between any executive officer and any other person pursuant to which an executive officer was selected to be an officer of the Company. There is no family relationship between any of our executive officers, or between any of our executive officers and any of our directors.
An investment in our common shares or other securities is subject to risk inherent to our business and our industry. Described below are certain risks and uncertainties, the occurrences of which could have a material adverse effect on us. Before making an investment decision, you should consider carefully all of the risks described below together with the other information included in this report. The risks and uncertainties described below are not the only ones we face. Although we have significant risk management policies, practices and procedures aimed to mitigate these risks, uncertainties may nevertheless impair our business operation. This report is qualified in its entirety by these factors.
Our ERM function provides a framework for management's consideration of risk when making strategic, financial, operational and/or project decisions. The framework is based on ISO 31000, an internationally recognized risk management standard. Management uses a consistent methodology to identify and assess risks, determine and implement risk mitigation actions, and monitor and communicate information about the Company's key risks. Through these processes, we have identified six categories of risk that we are subject to: (I) economic and market, (II) regulatory, (III) financial, (IV) operational, (V) development and sustainability and (VI) human capital. The following risk factors are presented according to these key risk categories.
| |
I. | ECONOMIC AND MARKET RISKS |
The volatility of commodity prices, namely iron ore and coal, affects our ability to generate revenue, maintain stable cash flow and to fund our operations, including growth and expansion projects.
As a mining company, our profitability is dependent upon the price of the commodities that we sell to our customers, namely iron ore and coal. The prices of iron ore and coal have fluctuated historically and are affected by factors beyond our control, including: steel inventories; international demand for raw materials used in steel production; rates of global economic growth, especially construction and infrastructure activity that requires significant amounts of steel; recession or reduced economic activity in the U.S., China, India, Europe and other industrialized or developing countries; uncertainties or weaknesses in global economic conditions such as the sovereign debt crisis in Europe and the U.S. debt ceiling; changes in production capacity of other iron ore and metallurgical coal suppliers, especially as additional supplies come online or where there is a significant increase in imports of steel into the U.S. or Europe; weather-related disruptions or natural disasters that may impact the global supply of iron ore and metallurgical coal; and the proximity, capacity and cost of infrastructure and transportation.
Our earnings, therefore, may fluctuate with the prices of the commodities we sell. To the extent that the prices of these commodities significantly decline for an extended period of time, we may have to revise our operating plans, including curtailing production, reducing operating costs and capital expenditures and discontinuing certain exploration and development programs. We also may have to take impairments on our assets, inventory and/or goodwill. Sustained lower prices also could cause us to reduce existing reserves if certain reserves no longer can be economically mined or processed at prevailing prices. We may be unable to decrease our costs in an amount sufficient to offset reductions in revenues and may incur losses. These events could have a material adverse effect on us.
Uncertainty or weaknesses in global economic conditions and reduced economic growth in China could affect adversely our business.
The world prices of iron ore and coal are influenced strongly by international demand and global economic conditions. Uncertainties or weaknesses in global economic conditions, including the ongoing sovereign debt crisis in Europe, could affect adversely our business and negatively impact our financial results. In addition, the current level of international demand for raw materials used in steel production is driven largely by industrial growth in China. If the economic growth rate in China slows for an extended period of time, or if another global economic downturn were to occur, we would likely see decreased demand for our products and decreased prices, resulting in lower revenue levels and decreasing margins. We are not able to predict whether the global economic conditions will continue or worsen and the impact it may have on our operations and the industry in general going forward.
Capacity expansions within the mining industry could lead to lower global iron ore and coal prices, impacting our profitability.
Continued global growth of iron ore and coal demand, particularly from China, resulted in iron ore and metallurgical coal suppliers expanding their production capacity. The supply of both iron ore and metallurgical coal has increased due to these expansions. In the current iron ore and coal markets, an increase in our competitors’ capacity could result in excess supply of these commodities, resulting in downward pressure on prices. This decrease in pricing would adversely impact our sales, margins and profitability.
If steelmakers use methods other than blast furnace production to produce steel or use other inputs, or if their blast furnaces shut down or otherwise reduce production, the demand for our iron ore and coal products may decrease.
Demand for our iron ore and coal products is determined by the operating rates for the blast furnaces of steel companies. However, not all finished steel is produced by blast furnaces; finished steel also may be produced by other methods that use scrap steel, pig iron, hot briquetted iron and direct reduced iron. North American steel producers also can produce steel using imported iron ore or semi-finished steel products, which eliminates the need for domestic iron ore. Future environmental restrictions on the use of blast furnaces also may reduce our customers’ use of their blast furnaces. Maintenance of blast furnaces may require substantial capital expenditures. Our customers may choose not to maintain, or may not have the resources necessary to maintain, their blast furnaces. If our customers use methods to produce steel that do not use iron ore and coal products, demand for our iron ore and coal products will decrease, which would affect adversely our sales, margins and profitability.
Due to economic conditions and volatility in commodity prices, our customers could approach us about modification of their supply agreements. Modifications to our sales agreements potentially could be made due to such volatility, which could impact adversely our sales, margins, profitability and cash flows.
Although we have contractual commitments for sales in our U.S. Iron Ore and Eastern Canadian Iron Ore business for 2015 and beyond, the uncertainty in global economic conditions may adversely impact the ability of our customers to meet their obligations. As a result of such market volatility, our customers could approach us about modifying their supply agreements. Any modifications to our sales agreements could adversely impact our sales, margins, profitability and cash flows. These discussions or potential actions by our customers could also result in contractual disputes, which could ultimately require arbitration or litigation, either of which could be time consuming and costly. Any such disputes could impact adversely our sales, margins, profitability and cash flows.
II. REGULATORY RISKS
We are subject to extensive governmental regulation, which imposes, and will continue to impose, potential significant costs and liabilities on us. Future laws and regulation or the manner in which they are interpreted and enforced could increase these costs and liabilities or limit our ability to produce iron ore and coal products.
New laws or regulations, or changes in existing laws or regulations, or the manner of their interpretation or enforcement, could increase our cost of doing business and restrict our ability to operate our business or execute our strategies. This includes, among other things, the possible taxation under U.S. law of certain income from foreign operations, compliance costs and enforcement under the Dodd-Frank Wall Street Reform and Consumer Protection Act, and costs associated with complying with the Patient Protection and Affordable Care Act and the Healthcare and Education Reconciliation Act of 2010 and the regulations promulgated thereunder. In addition, we are subject to various federal, provincial, state and local laws and regulations in each jurisdiction in which we have operations for employee health and safety, air quality, water pollution, plant, wetlands and wildlife protection, reclamation and restoration of mining properties, the discharge of materials into the environment, the effects that mining has on groundwater quality and availability, and related matters. Numerous governmental permits and approvals are required for our operations. We cannot be certain that we have been or will be at all times in complete compliance with such laws, regulations, permits and approvals. If we violate or fail to comply with these laws, regulations, permits or approvals, we could be fined or otherwise sanctioned by regulators. Compliance with the complex and extensive laws and regulations that we are subject to imposes substantial costs, which we expect will continue to increase over time because of increased regulatory oversight, adoption of increasingly stringent environmental standards, and increased demand for remediation services leading to shortages of equipment, supplies and labor, as well as other factors.
Specifically, there are several notable proposed or recently enacted rulemakings or activities to which we would be subject or that would further regulate and/or tax our customers, namely the North American integrated steel producer customers that may also require us or our customers to reduce or otherwise change operations significantly or incur significant additional costs, depending on their ultimate outcome. These emerging or recently enacted rules and regulations include: numerous air regulations, such as climate change and greenhouse gas regulation, regional haze regulation, NAAQS including but not limited to those for NO2 and SO2, the CSAPR; increased administrative and legislative initiatives related to coal mining activities; Minnesota’s Mercury Air Emissions Reporting and Reduction Rule, Mercury Total Maximum Daily Load requirements and Taconite Mercury Reduction Strategy; selenium discharge regulation; expansion of federal jurisdictional authority to regulate groundwater, and various other water quality regulations. Such new or more stringent legislation, regulations, interpretations or orders, when enacted, could have a material adverse effect on our business, results of operations, financial condition or profitability.
Although the numerous regulations, operating permits and our management systems mitigate potential impacts to the environment, our operations may inadvertently impact the environment or cause exposure to hazardous substances, which could result in material liabilities to us.
Our operations currently use and have used in the past, hazardous materials, and, from time to time, we have generated solid and hazardous waste. We may be subject to claims under federal, provincial, state and local laws and regulations for toxic torts, natural resource damages and other damages as well as for the investigation and clean-up of soil, surface water, sediments, groundwater and other natural resources. Such claims for damages and reclamation may arise out of current or former conditions at sites that we own, lease or operate currently, as well as sites that we or our acquired companies have owned, leased or operated, and at contaminated sites that have always been owned, leased or operated by our joint-venture partners. Our liability for such claims may be joint and several, so that we may be held responsible for more than our share of the contamination or other damages, or even for the entire share. We are subject to a variety of potential liability exposures arising, or otherwise involved in remediation activities, at certain sites. In addition to currently owned, leased or operated sites, these include sites where we formerly conducted iron ore and/or coal mining or processing or other operations, inactive sites that we currently own, predecessor sites, acquired sites, leased land sites and third-party waste disposal sites. We may be named as a responsible party at other sites in the future and we cannot be certain that the costs associated with these additional sites will not be material.
We also could be held liable for any and all consequences arising out of human exposure to hazardous substances used, released, or disposed of by us. In particular, we and certain of our subsidiaries are involved in various claims relating to the exposure of asbestos and silica to seamen who sailed until the mid-1980s on the Great Lakes vessels formerly owned and operated by certain of our subsidiaries. The full impact of these claims continues to be unknown. Uncertainty also remains as to whether insurance coverage will be sufficient and whether other defendants named in these claims will be able to fund any costs arising out of these claims.
Environmental impacts as a result of our operations, including exposures to hazardous substances or wastes associated with our operations, could result in costs and liabilities that could materially and adversely affect our margins, cash flow or profitability.
We may be unable to obtain and renew permits necessary for our operations, which could reduce our production, cash flows and profitability. We also could face significant permit and approval requirements that could delay our commencement or continuation of exploration and production operations, which, in turn, could affect materially our cash flows and profitability.
Prior to commencement of mining, we must submit to and obtain approval from the appropriate regulatory authority of plans showing where and how mining and reclamation operations are to occur. These plans must include information such as the location of mining areas, stockpiles, surface waters, haul roads, tailings basins and drainage from mining operations. All requirements imposed by any such authority may be costly and time-consuming and may delay commencement or continuation of exploration or production operations.
Mining companies must obtain numerous permits that impose strict conditions on various environmental and safety matters in connection with coal and iron ore mining. These include permits issued by various federal, state and provincial agencies and regulatory bodies. The permitting rules are complex and may change over time, making our ability to comply with the applicable requirements more difficult or impractical and costly, possibly precluding the continuance of ongoing operations or the development of future mining operations. The public, including special interest groups and individuals, have certain rights under various statutes to comment upon, submit objections to, and otherwise engage in the permitting process, including bringing citizens’ lawsuits to challenge such permits or mining activities. Accordingly, required permits may not be issued or renewed in a timely fashion (or at all), or permits issued or renewed may be conditioned in a manner that may restrict our ability to efficiently conduct our mining activities. Such inefficiencies could reduce our production, cash flows and profitability.
Our North American coal operations are subject to increasing levels of regulatory oversight making it more difficult to obtain and maintain necessary operating permits.
The current political and regulatory environment in the U.S. is disposed negatively toward coal mining, with particular focus on certain categories of mining such as mountaintop removal techniques. Therefore, our coal mining operations in North America are subject to increasing levels of scrutiny. Although we do not engage in mountaintop mining, emerging U.S. regulatory efforts targeted at eliminating or minimizing the adverse environmental impacts of mountaintop and underground coal mining practices have impacted all types of coal operations. These regulatory initiatives could cause material impacts, delays, or disruptions to our coal operations due to our inability to obtain new or renewed permits or modifications to existing permits.
Underground mining is subject to increased safety regulation and may require us to incur additional compliance costs.
Recent mine disasters have led to the enactment and consideration of significant new federal and state laws and regulations relating to safety in underground coal mines. These laws and regulations include requirements for constructing and maintaining caches for the storage of additional self-contained self-rescuers throughout underground mines; installing rescue chambers in underground mines; continuous tracking of and communication with personnel in the mines; installing cable lifelines from the mine portal to all sections of the mine to assist in emergency escape; submission and approval of emergency response plans; and new and additional safety training. Additionally, new requirements for the prompt reporting of accidents and increased fines and penalties for violations of these and existing regulations have been implemented. These new laws and regulations may cause us to incur substantial additional costs, which may impact adversely our results of operations, financial condition or profitability.
A substantial majority of our sales are made under term supply agreements to a limited number of customers that contain price-adjustment clauses that could affect adversely the stability and profitability of our operations.
In 2014, a majority of our U.S. Iron Ore, North American Coal and Eastern Canadian Iron Ore sales, and almost all of our Asia Pacific Iron Ore sales were made under term supply agreements to a limited number of customers. In 2014, five customers together accounted for approximately 72 percent of our U.S. Iron Ore, Eastern Canadian Iron Ore, and North American Coal product sales revenues (representing more than 57 percent of our consolidated revenues). For North American Coal, prices typically are agreed upon for a 12-month period and typically are adjusted each year. Our Asia Pacific Iron Ore contracts are due to expire at various dates until March 2015 for our Chinese and Japanese customers. As of December 31, 2014, our U.S. Iron Ore contracts had an average remaining duration of four years. We cannot be certain that we will be able to renew or replace existing term supply agreements at approximately the same volume levels, prices or with similar profit margins when they expire. A loss of sales to our existing customers could have a substantial negative impact on our sales, margins and profitability.
Our U.S. Iron Ore term supply agreements contain a number of price adjustment provisions, including price escalators and adjustments based on general industrial inflation rates, the price of steel and the international price of iron ore pellets, among other factors, that are out of our control and that may adjust the prices under those agreements generally on an annual basis.
Changes in credit ratings issued by nationally recognized statistical rating organizations could adversely affect our cost of financing and the market price of our securities.
Credit rating agencies could downgrade our ratings either due to factors specific to our business, a prolonged cyclical downturn in the mining industry, or macroeconomic trends (such as global or regional recessions) and trends in credit and capital markets more generally. Any decline in our credit ratings would likely result in an increase to our cost of financing, including resulting in an increase of the interest rate applicable on these senior notes, limit our access to the capital markets, significantly harm our financial condition and results of operations, hinder our ability to refinance existing indebtedness on acceptable terms and have an adverse effect on the market price of our securities.
We rely on our joint venture partners in our mines to meet their payment obligations and we are subject to risks involving the acts or omissions of our joint venture partners when we are not the manager of the joint venture.
We co-own and manage three of our five U.S. Iron Ore mines and one of our two Eastern Canadian Iron Ore mines with various joint venture partners that are integrated steel producers or their subsidiaries, including ArcelorMittal, U.S. Steel Canada Inc., and WISCO. We rely on our joint venture partners to make their required capital contributions and to pay for their share of the iron ore that each joint venture produces. Our U.S. Iron Ore and Eastern Canadian Iron Ore joint venture partners are also our customers. If one or more of our joint venture partners fail to perform their obligations, the remaining joint venture partners, including ourselves, may be required to assume additional material obligations, including significant capital contribution, pension and postretirement health and life insurance benefit obligations. The premature closure of a mine due to the failure of a joint venture partner to perform its obligations could result in significant fixed mine-closure costs, including severance, employment legacy costs and other employment costs; reclamation and other environmental costs; and the costs of terminating long-term obligations, including energy and transportation contracts and equipment leases. For example, with respect to the Bloom Lake mine, CQIM's joint venture partner did not fully participate in calls for capital contributions, resulting in additional financial burden for CQIM. This additional burden was one of multiple factors in CQIM's decision to file for a stay under CCAA.
We cannot control the actions of our joint venture partners, especially when we have a minority interest in a joint venture. Further, in spite of performing customary due diligence prior to entering into a joint venture, we cannot guarantee full disclosure of prior acts or omissions of the sellers or those with whom we enter into joint ventures. Such risks could have a material adverse effect on the business, results of operations or financial condition of our joint venture interests.
We may not be able to recover the carrying value when divesting assets or businesses.
When we divest assets or businesses, we may not be able to recover the carrying value of these assets, which potentially could have a material adverse impact on our results of operations, shareholders' equity and capital structure. Also, if we were to sell a percentage of a business, there are inherent risks of a joint venture relationship as noted in the risk factor above.
Our ability to collect payments from our customers depends on their creditworthiness.
Our ability to receive payment for products sold and delivered to our customers depends on the creditworthiness of our customers. With respect to our Asia Pacific business unit, payment typically is received as the products are shipped and much of the product is secured by bank letters of credit. By contrast, in our U.S. Iron Ore business unit, generally, we deliver iron ore products to our customers’ facilities in advance of payment for those products. Under this practice for our U.S. customers, title and risk of loss with respect to U.S. Iron Ore products does not pass to the customer until payment for the pellets is received; however, there is typically a period of time in which pellets, for which we have reserved title, are within our customers’ control. Where we have identified credit risk with certain customers, we have put in place alternate payment terms from time to time.
Consolidations in some of the industries in which our customers operate have created larger customers. These factors have caused some customers to be less profitable and increased our exposure to credit risk. Customers in other countries may be subject to other pressures and uncertainties that may affect their ability to pay, including trade barriers, exchange controls, and local, economic and political conditions. Downturns in the economy and disruptions in the global financial markets in recent years have affected the creditworthiness of our customers from time to time. Some of our customers are highly leveraged. If economic conditions worsen or prolonged global, national or regional economic recession conditions return, it is likely to impact significantly the creditworthiness of our customers and could, in turn, increase the risk we bear on payment default for the credit we provide to our customers and could limit our ability to collect receivables. Failure to receive payment from our customers for products that we have delivered could affect adversely our results of operations, financial condition and liquidity.
Our operating expenses could increase significantly if the price of electrical power, fuel or other energy sources increases.
Our mining operations require significant use of energy. Operating expenses at all of our mining locations are sensitive to changes in electricity prices and fuel prices, including diesel fuel and natural gas prices. These items make up approximately 25 to 30 percent in the aggregate of our operating costs in our U.S. Iron Ore locations, for example. Prices for electricity, natural gas and fuel oils can fluctuate widely with availability and demand levels from other users. During periods of peak usage, supplies of energy may be curtailed and we may not be able to purchase them at historical rates. A disruption in the transmission of energy, inadequate energy transmission infrastructure, or the termination of any of our energy supply contracts could interrupt our energy supply and affect adversely our operations. While we have some long-term contracts with electrical suppliers, we are exposed to fluctuations in energy costs that can affect our production costs. As an example, our mines in Minnesota are subject to changes in Minnesota Power’s rates, such as rate changes that are reviewed and approved by the state public utilities commission in response to an application filed by Minnesota Power. We also enter into market-based pricing supply contracts for natural gas and diesel fuel for use in our operations. Those contracts expose us to price increases in energy costs, which could cause our profitability to decrease significantly.
In addition, U.S. public utilities are expected to pass through additional capital and operating cost increases related to new or pending U.S. environmental regulations that are expected to require significant capital investment and use of cleaner fuels in the future and which may impact U.S. coal-fired generation capacity. We are estimating that power rates for our electricity-intensive operations could increase above 2014 levels by up to 13 percent by 2019, representing an increase of approximately $8 per MWh by 2019 for our U.S. operations. These environmental regulations are also forcing the future closure of the Presque Isle Power Plant in the Upper Peninsula of Michigan which supplies electricity to our mines in Michigan.
The availability of capital may be limited.
We may need to access the capital markets to finance ongoing operations, any development of existing mining properties and our other cash requirements. Our substantial indebtedness could make it more difficult for us to borrow money in the future and may reduce the amount of money available to finance our operations and other business activities and may have other detrimental consequences, including the following: requiring us to dedicate a substantial portion of our cash flow from operations to the payment of principal, premium, if any, and interest on our debt, which will reduce funds available for other purposes; exposing us to the risk of increased interest costs if the underlying interest rates rise on our existing credit facility or other variable rate debt; making it more difficult to obtain surety bonds, letters of credit or other financing, particularly during periods in which credit markets are weak; causing a decline in our credit ratings; limiting our ability to compete with companies that are not as leveraged and that may be better positioned to withstand economic downturns; and limiting our flexibility in planning for, or reacting to, and increasing our vulnerability to, changes in our business, the industry in which we compete and general economic and market conditions. If we further increase our indebtedness, the related risks that we now face, including those described above, could intensify. We cannot predict the general availability or accessibility of capital to finance such projects in the future.
We are subject to a variety of financial market risks.
Financial market risks include those caused by changes in the value of investments, changes in commodity prices, interest rates and foreign currency exchange rates. We have established policies and procedures to manage such risks; however, certain risks are beyond our control and our efforts to mitigate such risks may not be effective. These factors could have a material adverse effect on our results of operations.
Our existing and future indebtedness may limit cash flow available to invest in the ongoing needs of our business, which could prevent us from fulfilling our obligations under our senior notes.
As of December 31, 2014, we had an aggregate principal amount of $2,995.8 million of total debt, $308 million of which was secured (excluding outstanding letters of credit), and $290.9 million of cash on our balance sheet. Our level of indebtedness could have important consequences to you. For example, it could:
| |
• | require us to dedicate a substantial portion of our cash flow from operations to the payment of debt service, reducing the availability of our cash flow to fund working capital, capital expenditures, acquisitions and other general corporate purposes; |
| |
• | increase our vulnerability to adverse economic or industry conditions; |
| |
• | limit our ability to obtain additional financing in the future to enable us to react to changes in our business; |
| |
• | place us at a competitive disadvantage compared to businesses in our industry that have less indebtedness; or |
| |
• | limit our ability to pay dividends on or purchase or redeem our capital stock. |
Our substantial level of indebtedness could limit our ability to obtain additional financing on acceptable terms or at all for working capital, capital expenditures and general corporate purposes. Our liquidity needs could vary significantly and may be affected by general economic conditions, industry trends, performance and many other factors not within our control. If we are unable to generate sufficient cash flow from operations in the future to service our debt, we may be required to refinance all or a portion of our existing debt. However, we may not be able to obtain any such new or additional debt on favorable terms or at all.
Additionally, any failure to comply with covenants in the instruments governing our debt could result in an event of default which, if not cured or waived, would have a material adverse effect on us.
We may not be able to generate sufficient cash to service all of our debt, and may be forced to take other actions to satisfy our obligations under our debt, which may not be successful.
Our ability to make scheduled payments on or to refinance our debt obligations, including our senior notes, and to fund planned capital expenditures and expansion efforts and any strategic alliances or acquisitions we may make in the future depends on our ability to generate cash in the future and our financial condition and operating performance, which are subject to prevailing economic and competitive conditions and to certain financial, business and other factors beyond our control. We cannot assure you that we will maintain a level of cash flows from operating activities sufficient to permit us to pay the principal, premium, if any, and interest on our debt, including our senior notes.
If our cash flows and capital resources are insufficient to fund our debt service obligations, we may be forced to reduce or delay investments and capital expenditures, or to sell assets, seek additional capital or restructure or refinance our debt, including our senior notes. Any refinancing of our debt could be at higher interest rates and may require us to
comply with more onerous covenants, which could further restrict our business operations. These measures may not be successful and may not permit us to meet our scheduled debt service obligations. If our operating results and available cash are insufficient to meet our debt service obligations, we could face substantial liquidity problems and might be required to dispose of material assets or operations to meet our debt service and other obligations. We may not be able to consummate those dispositions or to obtain the proceeds that we could realize from them, and these proceeds may not be adequate to meet any debt service obligations then due. Further, we may need to refinance all or a portion of our debt on or before maturity, and we cannot assure you that we will be able to refinance any of our debt on commercially reasonable terms or at all.
We are subject to risks relating to the CCAA filing by the Bloom Lake Group.
The Bloom Lake Group commenced the CCAA process in January 2015 to address the Bloom Lake Group’s immediate liquidity issues and to preserve and protect its assets for the benefit of all stakeholders while restructuring and/or sale options are explored. Certain obligations of the Bloom Lake Group, including equipment loans, were guaranteed by Cliffs. It is possible that (a) as part of the CCAA process (i) claims may be asserted by or on behalf of the Bloom Lake Group against non-debtor affiliates of the Bloom Lake Group and/or (ii) claims of non-debtor affiliates against the Bloom Lake Group may be challenged and (b) creditors of the Bloom Lake Group may assert claims against non-debtor affiliates of the Bloom Lake Group under the guarantees discussed above. While we anticipate the restructuring and/or sale of the Bloom Lake Group assets may mitigate these risks, to the extent that any claims are successful or the Bloom Lake Group’s obligations guaranteed by Cliffs are not satisfied in full by any such restructuring or sale, Cliffs could be held liable for certain obligations.
IV. OPERATIONAL RISKS
Mine closures entail substantial costs. If we close one or more of our mines, our results of operations and financial condition would likely be affected adversely.
If we close any of our mines, our revenues would be reduced unless we were able to increase production at our other mines, which may not be possible. The closure of a mining operation involves significant fixed closure costs, including accelerated employment legacy costs, severance-related obligations, reclamation and other environmental costs, and the costs of terminating long-term obligations, including customer, energy and transportation contracts and equipment leases. We base our assumptions regarding the life of our mines on detailed studies we perform from time to time, but those studies and assumptions are subject to uncertainties and estimates that may not be accurate. We recognize the costs of reclaiming open pits and shafts, stockpiles, tailings ponds, roads and other mining support areas based on the estimated mining life of our property. If we were to significantly reduce the estimated life of any of our mines, the mine-closure costs would be applied to a shorter period of production, which would increase costs per ton produced and could significantly and adversely affect our results of operations and financial condition.
A North American mine permanent closure could accelerate and significantly increase employment legacy costs, including our expense and funding costs for pension and other postretirement benefit obligations. A number of employees would be eligible for immediate retirement under special eligibility rules that apply upon a mine closure. All employees eligible for immediate retirement under the pension plans at the time of the permanent mine closure also could be eligible for postretirement health and life insurance benefits, thereby accelerating our obligation to provide these benefits. Certain mine closures would precipitate a pension closure liability significantly greater than an ongoing operation liability. Finally, a permanent mine closure could trigger severance-related obligations, which can equal up to sixteen weeks of pay per employee in some jurisdictions, depending on length of service. As a result, the closure of one or more of our mines could adversely affect our financial condition and results of operations.
At the end of March 2014, we idled our Wabush Scully mine in Newfoundland and Labrador, and in the fourth quarter of 2014, we began to implement the permanent closure plan for the mine. Additionally, we disclosed in November 2014 that we were pursuing exit options for our Bloom Lake mine and as disclosed in January 2015, active production at Bloom Lake mine has completely ceased and the mine has transitioned to "care-and-maintenance" mode. To mitigate closure costs in connection with the potential shutdown of the Bloom Lake mine, our Canadian affiliates that operate the mine commenced restructuring proceedings under the CCAA. However, there can be no assurance that we will not have any material obligations in connection with the potential shutdown of the Bloom Lake mine despite the CCAA filing.
Our sales and competitive position depend on the ability to transport our products to our customers at competitive rates and in a timely manner.
In our U.S. Iron Ore operations, disruption of the lake and ocean-going vessels and rail transportation services because of weather-related problems, including ice and winter weather conditions on the Great Lakes or St. Lawrence Seaway, climate change, strikes, lock-outs, or other events and lack of alternative transportation sources, could impair our ability to supply iron ore to our customers at competitive rates or in a timely manner and, thus, could adversely affect our sales, margins and profitability. Similarly, our North American Coal operations depend on international vessels and rail transportation services, as well as the availability of dock capacity, and any disruptions to those services or the lack of dock capacity could impair our ability to supply coal to our customers at competitive rates or in a timely manner and, thus, could adversely affect our sales and profitability. Further, reduced dredging and environmental changes, particularly at Great Lakes ports, could impact negatively our ability to move our iron ore and coal products because lower water levels restrict the tonnage that vessels can haul, resulting in higher freight rates.
Our Asia Pacific Iron Ore operations also are dependent upon rail and port capacity. Disruptions in rail service or availability of dock capacity could similarly impair our ability to supply iron ore to our customers, thereby adversely affecting our sales and profitability. In addition, our Asia Pacific Iron Ore operations are also in direct competition with the major world seaborne exporters of iron ore and our customers face higher transportation costs than most other Australian producers to ship our products to the Asian markets because of the location of our major shipping port on the south coast of Australia. Further, increases in transportation costs, including volatile fuel rates, decreased availability of ocean vessels or changes in such costs relative to transportation costs incurred by our competitors could make our products less competitive, restrict our access to certain markets and have an adverse effect on our sales, margins and profitability.
Natural disasters, weather conditions, disruption of energy, unanticipated geological conditions, equipment failures, and other unexpected events may lead our customers, our suppliers or our facilities to curtail production or shut down operations.
Operating levels within the mining industry are subject to unexpected conditions and events that are beyond the industry’s control. Those events could cause industry members or their suppliers to curtail production or shut down a portion or all of their operations, which could reduce the demand for our iron ore and coal products, and could affect adversely our sales, margins and profitability.
Interruptions in production capabilities inevitably will increase our production costs and reduce our profitability. We do not have meaningful excess capacity for current production needs, and we are not able to quickly increase production at one mine to offset an interruption in production at another mine.
A portion of our production costs are fixed regardless of current operating levels. As noted, our operating levels are subject to conditions beyond our control that can delay deliveries or increase the cost of mining at particular mines for varying lengths of time. These include weather conditions (for example, extreme winter weather, tornadoes, floods, and the lack of availability of process water due to drought) and natural and man-made disasters, pit wall failures, unanticipated geological conditions, including variations in the amount of rock and soil overlying the deposits of iron ore and coal, variations in rock and other natural materials and variations in geologic conditions and ore processing changes.
The manufacturing processes that take place in our mining operations, as well as in our processing facilities, depend on critical pieces of equipment. This equipment may, on occasion, be out of service because of unanticipated failures. In addition, many of our mines and processing facilities have been in operation for several decades, and the equipment is aged. In the future, we may experience additional material plant shutdowns or periods of reduced production because of equipment failures. Further, remediation of any interruption in production capability may require us to make large capital expenditures that could have a negative effect on our profitability and cash flows. Our business interruption insurance would not cover all of the lost revenues associated with equipment failures. Longer-term business disruptions could result in a loss of customers, which adversely could affect our future sales levels and, therefore, our profitability.
Regarding the impact of unexpected events happening to our suppliers, many of our mines are dependent on one source for electric power and for natural gas. A significant interruption in service from our energy suppliers due to terrorism, weather conditions, natural disasters, or any other cause can result in substantial losses that may not be fully recoverable, either from our business interruption insurance or responsible third parties.
We are subject to risks involving operations and sales in multiple countries.
We supply raw materials to the global integrated steel industry with substantial assets located outside of the U.S. We conduct operations in the U.S., Canada and Australia. As such, we are subject to additional risks beyond those relating to our U.S. operations, such as fluctuations in currency exchange rates; potentially adverse tax consequences due to overlapping or differing tax structures; burdens to comply with multiple and potentially conflicting foreign laws and regulations, including export requirements, tariffs, economic sanctions and other barriers, environmental health and safety requirements, and unexpected changes in any of these laws and regulations; the imposition of duties, tariffs, import and export controls and other trade barriers impacting the seaborne iron ore and coal markets; difficulties in staffing and managing multi-national operations; political and economic instability and disruptions, including terrorist attacks; disadvantages of competing against companies from countries that are not subject to U.S. laws and regulations, including the Foreign Corrupt Practices Act; and uncertainties in the enforcement of legal rights and remedies in multiple jurisdictions. If we are unable to manage successfully the risks associated with operating our global business, these risks could have a material adverse effect on our business, results of operations or financial condition.
Our profitability could be affected adversely by the failure of outside contractors to perform.
Asia Pacific Iron Ore uses contractors to handle many of the operational phases of their mining and processing operations and, therefore, we are subject to the performance of outside companies on key production areas. A failure of any of these contractors to perform in a significant way would result in additional costs for us, which also could affect adversely our production rates and results of operations.
Coal mining is complex due to geological characteristics of the region.
The geological characteristics of coal reserves, such as depth of overburden and coal seam thickness, make them complex and costly to mine. As mines become depleted, replacement reserves may not be available when required or, if available, may not be capable of being mined at costs comparable to those characteristic of the depleting mines, and, therefore, decisions to defer mine development activities may adversely impact our ability to substantially increase future coal production. These factors could materially adversely affect our mining operations and cost structures, which could affect adversely our sales, profitability and cash flows.
We may not be able to complete divestitures of our non-core assets at acceptable prices or at all.
As an extension of our re-focused U.S. Iron Ore strategy, we are currently in the process of streamlining our portfolio of non-core assets. Asia Pacific Iron Ore, North American Coal and Eastern Canadian Iron Ore have been identified as non-core assets and will be considered for monetization. However, we may not be able to sell any non-core assets at sales prices acceptable to us or at all. Gains or losses on the sales of, or lost operating income from, non-core assets may affect our profitability. Moreover, we may incur asset impairment charges related to divestitures that reduce our profitability. Our divestiture activities may also present financial, managerial and operational risks. Those risks include diversion of management attention from existing businesses, difficulties separating personnel and financial and other systems, adverse effects on existing business relationships with suppliers and customers and indemnities and potential disputes with the buyers. Any of these factors could affect our financial condition and results of operations.
V. DEVELOPMENT AND SUSTAINABILITY RISKS
The cost and time to implement a strategic capital project may prove to be greater than originally anticipated.
We undertake strategic capital projects in order to enhance, expand or upgrade our mines and production capabilities. Our ability to achieve the anticipated increased volumes, revenues or otherwise realize acceptable returns on strategic capital projects that we may undertake is subject to a number of risks, many of which are beyond our control, including a variety of market (such as a volatile pricing environment for iron ore), operational, permitting and labor-related factors. Further, the cost to implement any given strategic capital project ultimately may prove to be greater and may take more time than originally anticipated. Inability to achieve the anticipated results from the implementation of our strategic capital projects, or the incurring of unanticipated implementation costs, penalties or inability to meet contractual obligations could affect adversely our results of operations and future earnings and cash flow generation.
We continually must replace reserves depleted by production. Our exploration activities may not result in additional discoveries.
Our ability to replenish our ore reserves is important to our long-term viability. Depleted ore reserves must be replaced by further delineation of existing ore bodies or by locating new deposits in order to maintain production levels over the long term. Resource exploration and development are highly speculative in nature. Our exploration projects involve many risks, require substantial expenditures and may not result in the discovery of sufficient additional mineral deposits that can be mined profitably. Once a site with mineralization is discovered, it may take several years from the initial phases of drilling until production is possible, during which time the economic feasibility of production may change. Substantial expenditures are required to establish recoverable proven and probable reserves and to construct mining and processing facilities. As a result, there is no assurance that current or future exploration programs will be successful and there is a risk that depletion of reserves will not be offset by discoveries or acquisitions.
We rely on estimates of our recoverable reserves, which is complex due to geological characteristics of the properties and the number of assumptions made.
We regularly evaluate our iron ore and coal reserves based on revenues and costs and update them as required in accordance with SEC Industry Guide 7 and historically, the Canadian Institute of Mining, Metallurgy & Petroleum's Definition Standards on Mineral Resources and Mineral Reserves. In addition, our Asia Pacific Iron Ore business segment has published reserves that follow the Joint Ore Reserve Code in Australia, with certain changes to our Western Australian reserve values to make them comply with SEC requirements. There are numerous uncertainties inherent in estimating quantities of reserves of our mines, including many factors beyond our control.
Estimates of reserves and future net cash flows necessarily depend upon a number of variable factors and assumptions, such as production capacity, effects of regulations by governmental agencies, future prices for iron ore and coal, future industry conditions and operating costs, severance and excise taxes, development costs and costs of extraction and reclamation, all of which may vary considerably from actual results. Estimating the quantity and grade of reserves requires us to determine the size, shape and depth of our mineral bodies by analyzing geological data, such as samplings of drill holes, tunnels and other underground workings. In addition to the geology assumptions of our mines, assumptions are also required to determine the economic feasibility of mining these reserves, including estimates of future commodity prices and demand, the mining methods we use, and the related costs incurred to develop and mine our reserves. For these reasons, estimates of the economically recoverable quantities of mineralized deposits attributable to any particular group of properties, classifications of such reserves based on risk of recovery and estimates of future net cash flows prepared by different engineers or by the same engineers at different times may vary substantially as the criteria change. Estimated ore reserves could be affected by future industry conditions, geological conditions and ongoing mine planning. Actual volume and grade of reserves recovered, production rates, revenues and expenditures with respect to our reserves will likely vary from estimates, and if such variances are material, our sales and profitability could be affected adversely.
Defects in title or loss of any leasehold interests in our properties could limit our ability to mine these properties or result in significant unanticipated costs.
A portion of our mining operations are conducted on properties we lease, license or as to which we have easements or other possessory interests ("leased properties"). Consistent with industry practice, title to most of these leased properties and mineral rights are not usually verified until we make a commitment to develop a property, which may not occur until after we have obtained necessary permits and completed exploration of the leased property. In some cases, title with respect to leased properties is not verified at all because we instead rely on title information or representations and warranties provided by lessors or grantors. We do not maintain title insurance on our owned or leased properties. A title defect or the loss of any lease, license or easement for any leased property could adversely affect our ability to mine the associated reserves. In addition, from time to time the rights of third parties for competing uses of adjacent, overlying, or underlying lands such as for, roads, easements and public facilities may affect our ability to operate as planned if our title is not superior or arrangements cannot be negotiated.
Any challenge to our title could delay the exploration and development of some reserves, deposits or surface rights, cause us to incur unanticipated costs and could ultimately result in the loss of some or all of our interest in those reserves or surface rights. In the event we lose reserves, deposits or surface rights, we may have to shut down or significantly alter the sequence of our mining operations, which may adversely affect our future production, revenues and cash flows. Additionally, if we lose any leasehold interests relating to any of our preparation plants or loadout facilities, we may need to find an alternative location to process our iron ore or coal and load it for delivery to customers, which could result in significant unanticipated costs. Finally, we could incur significant liability if we inadvertently mine on property we do not own or lease.
In order to continue to foster growth in our business and maintain stability of our earnings, we must maintain our social license to operate with our stakeholders.
As a mining company, maintaining a strong reputation and consistent operational and safety history is vital in order to continue to foster growth and maintain stability in our earnings. As sustainability expectations increase and regulatory requirements continue to evolve, maintaining our social license to operate becomes increasingly important. We strive to incorporate social license expectations in our ERM program. Our ability to maintain our reputation and strong operating history could be threatened, including by circumstances outside of our control. If we are not able to respond effectively to these and other challenges to our social license to operate, our reputation could be damaged significantly. Damage to our reputation could affect adversely our operations and ability to foster growth in our Company.
Estimates and timelines relating to new development and expansion projects are uncertain and we may incur higher costs and lower economic returns than estimated.
Mine development and expansion projects projects typically require a number of years and significant expenditures during the development or expansion phase before production is possible. Such projects could experience unexpected problems and delays during development, construction and mine start-up or expansion.
Our decision to develop a project typically is based on the results of feasibility studies, which estimate the anticipated economic returns of a project. The actual project profitability or economic feasibility may differ from such estimates as a result of any of the following factors, among others: changes in tonnage, grades and metallurgical characteristics of ore to be mined and processed; estimated future prices of the relevant ore; changes in customer demand; higher construction and infrastructure costs; the quality of the data on which engineering assumptions were made; higher production costs; adverse geotechnical conditions; availability of adequate labor force; availability and cost of water and power; availability and cost of transportation; fluctuations in inflation and currency exchange rates; availability and terms of financing; delays in obtaining environmental or other government permits or changes in laws and regulations including environmental laws and regulations; weather or severe climate impacts; and potential delays relating to social and community issues.
Our future development activities may not result in the expansion or replacement of current production with new production, or one or more of these new production sites or facilities may be less profitable than currently anticipated, or may not be profitable at all, any of which could have a material adverse effect on our sales, margins and cash flows.
VI. HUMAN CAPITAL RISKS
Our profitability could be affected adversely if we fail to maintain satisfactory labor relations.
Production in our mines is dependent upon the efforts of our employees. We are party to labor agreements with various labor unions that represent employees at our operations. Such labor agreements are negotiated periodically, and, therefore, we are subject to the risk that these agreements may not be able to be renewed on reasonably satisfactory terms. It is difficult to predict what issues may arise as part of the collective bargaining process, and whether negotiations concerning these issues will be successful. Due to union activities or other employee actions, we could experience labor disputes, work stoppages, or other disruptions in our production of coal and iron ore that could affect us adversely. The USW represents all hourly employees at our U.S. Iron Ore and Eastern Canadian Iron Ore operations owned and/or managed by Cliffs or its subsidiary companies except for Northshore. Our labor agreements with the USW at four of our U.S. Iron Ore operations expire in September 2015. Since this is an expiration year for our labor agreements, there is an increased probability of a disruption at our U.S. Iron Ore operations in 2015.
If we enter into a new labor agreement with any union that significantly increases our labor costs relative to our competitors or fail to come to an agreement upon expiry, our ability to compete may be materially and adversely affected.
We may encounter labor shortages for critical operational positions, which could affect adversely our ability to produce our products.
We are predicting a long-term shortage of skilled workers for the mining industry and competition for the available workers limits our ability to attract and retain employees. Additionally, at our U.S. mining locations, many of our mining operational employees are approaching retirement age. As these experienced employees retire, we may have difficulty replacing them at competitive wages.
Our expenditures for post-retirement benefit and pension obligations could be materially higher than we have predicted if our underlying assumptions differ from actual outcomes, there are mine closures, or our joint venture partners fail to perform their obligations that relate to employee pension plans.
We provide defined benefit pension plans and OPEB to certain eligible union and non-union employees in North America, including our share of expense and funding obligations with respect to unconsolidated ventures. Our pension expense and our required contributions to our pension plans are affected directly by the value of plan assets, the projected and actual rate of return on plan assets, and the actuarial assumptions we use to measure our defined benefit pension plan obligations, including the rate at which future obligations are discounted.
We cannot predict whether changing market or economic conditions, regulatory changes or other factors will increase our pension expenses or our funding obligations, diverting funds we would otherwise apply to other uses.
Signatories to labor agreements with the UMWA have participated for decades in the 1974 PP. The 1974 PP has been underfunded for a number of years and has a current total underfunded liability in excess of $4.3 billion. Our Pinnacle and Oak Grove mines are signatories to labor agreements with the UMWA, making them participants in the 1974 PP. If Pinnacle or Oak Grove were to withdraw from the 1974 PP or if a mass withdrawal were to occur, we would become obligated to satisfy the withdrawal liability owed to the 1974 PP.
We have calculated our unfunded pension and OPEB obligations based on a number of assumptions. If our assumptions do not materialize as expected, cash expenditures and costs that we incur could be materially higher. Moreover, we cannot be certain that regulatory changes will not increase our obligations to provide these or additional benefits. These obligations also may increase substantially in the event of adverse medical cost trends or unexpected rates of early retirement, particularly for bargaining unit retirees.
We depend on our senior management team and other key employees, and the loss of these employees could adversely affect our business.
Our success depends in part on our ability to attract and motivate our senior management and key employees. Achieving this objective may be difficult due to a variety of factors, including fluctuations in the global economic and industry conditions, competitors’ hiring practices, cost reduction activities, and the effectiveness of our compensation programs. Competition for qualified personnel can be intense. We must continue to recruit, retain, and motivate our senior management and key personnel in order to maintain our business and support our projects. A loss of senior management and key personnel could prevent us from capitalizing on business opportunities, and our operating results could be adversely affected.
|
| |
Item 1B. | Unresolved Staff Comments |
We have no unresolved comments from the SEC.
The following map shows the locations of our operations and offices as of December 31, 2014:
General Information about the Mines
All of our iron ore mining operations are open-pit mines. Additional pit development is underway as required by long-range mine plans. At our U.S. Iron Ore and Asia Pacific Iron Ore mines, drilling programs are conducted periodically for the purpose of refining guidance related to ongoing operations.
Our North American Coal operations consist of underground mines. Drilling programs are conducted periodically for the purpose of refining guidance related to ongoing operations.
Geologic models are developed for all mines to define the major ore and waste rock types. Computerized block models for iron ore and stratigraphic models for coal are constructed that include all relevant geologic and metallurgical data. These are used to generate grade and tonnage estimates, followed by detailed mine design and life of mine operating schedules.
U.S. Iron Ore
The following map shows the locations of our U.S. Iron Ore operations as of December 31, 2014:
We directly or indirectly own and operate interests in five U.S. Iron Ore mines located in Michigan and Minnesota from which we produced 22.4 million, 20.3 million and 22.0 million tons of iron ore pellets in 2014, 2013 and 2012, respectively, for our account. We produced 7.3 million, 6.9 million and 7.5 million tons, respectively, on behalf of the steel company partners of the mines.
Our U.S. Iron Ore mines produce from deposits located within the Biwabik and Negaunee Iron Formation, which are classified as Lake Superior type iron formations that formed under similar sedimentary conditions in shallow marine basins approximately two billion years ago. Magnetite and hematite are the predominant iron oxide ore minerals present, with lesser amounts of goethite and limonite. Quartz is the predominant waste mineral present, with lesser amounts of other chiefly iron bearing silicate and carbonate minerals. The ore minerals liberate from the waste minerals upon fine grinding.
|
| | | | | | | | | | | | | | | | |
Mine | | Cliffs Ownership | | Infrastructure | | Mineralization | | Operating Since | | Current Annual Capacity1,2 | | 2014 Production2,3 | | Mineral Owned | | Rights Leased |
Empire | | 79% | | Mine, Concentrator, Pelletizer | | Magnetite | | 1963 | | 5.5 | | 4.3 | | 53% | | 47% |
Tilden | | 85% | | Mine, Concentrator, Pelletizer, Railroad | | Hematite & Magnetite | | 1974 | | 8.0 | | 7.6 | | 100% | | —% |
Hibbing | | 23% | | Mine, Concentrator, Pelletizer | | Magnetite | | 1976 | | 8.0 | | 7.7 | | 3% | | 97% |
Northshore | | 100% | | Mine, Concentrator, Pelletizer, Railroad | | Magnetite | | 1990 | | 6.0 | | 5.2 | | —% | | 100% |
United Taconite | | 100% | | Mine, Concentrator, Pelletizer | | Magnetite | | 1965 | | 5.4 | | 4.9 | | —% | | 100% |
1 Annual capacity is reported on a wet basis in millions of long tons, equivalent to 2,240 pounds. |
2 Figures reported on 100% basis. |
3 2014 Production from Empire includes 2.4 million long tons tolled to Tilden. |
Empire Mine
The Empire mine is located on the Marquette Iron Range in Michigan’s Upper Peninsula approximately 15 miles southwest of Marquette, Michigan. The Empire mine has produced between 3.0 million and 4.9 million tons of iron ore pellets annually over the past five years, of which between 1.3 million and 2.4 million tons annually over the past five years were tolled to Tilden mine.
We own 79 percent of Empire and a subsidiary of ArcelorMittal USA has retained the remaining 21 percent ownership in Empire with limited rights and obligations, which it has a unilateral right to put to us at any time. This right has not been exercised. Each partner takes its share of production pro rata; however, provisions in the partnership agreement allow additional or reduced production to be delivered under certain circumstances. We own directly
approximately one-half of the remaining ore reserves at the Empire mine and lease them to Empire. A subsidiary of ours leases the balance of the Empire reserves from other owners of such reserves and subleases them to Empire. Operations consist of an open pit truck and shovel mine, a concentrator that utilizes single stage crushing, AG mills, magnetic separation and floatation to produce a magnetite concentrate that is then supplied to the on-site pellet plant.
Tilden Mine
The Tilden mine is located on the Marquette Iron Range in Michigan’s Upper Peninsula approximately five miles south of Ishpeming, Michigan. Over the past five years, the Tilden mine has produced between 7.5 million and 7.8 million tons of iron ore pellets annually. We own 85 percent of Tilden, with the remaining minority interest owned by a subsidiary of U.S. Steel Canada Inc. Each partner takes its share of production pro rata; however, provisions in the partnership agreement allow additional or reduced production to be delivered under certain circumstances. We own all of the ore reserves at the Tilden mine and lease them to Tilden. Operations consist of an open pit truck and shovel mine, a concentrator that utilizes single stage crushing, AG mills, magnetite separation and floatation to produce hematite and magnetic concentrates that are then supplied to the on-site pellet plant.
The Empire and Tilden mines are located adjacent to each other. The logistical benefits include a consolidated transportation system, more efficient employee and equipment operating schedules, reduction in redundant facilities and workforce and best practices sharing. Two railroads, one of which is wholly owned by us, link the Empire and Tilden mines with Lake Michigan at the loading port of Escanaba, Michigan and with the Lake Superior loading port of Marquette, Michigan.
Hibbing Mine
The Hibbing mine is located in the center of Minnesota’s Mesabi Iron Range and is approximately ten miles north of Hibbing, Minnesota and five miles west of Chisholm, Minnesota. Over the past five years, the Hibbing mine has produced between 5.9 million and 8.1 million tons of iron ore pellets annually. We own 23 percent of Hibbing, a subsidiary of ArcelorMittal has a 62.3 percent interest and a subsidiary of U.S. Steel has a 14.7 percent interest. Each partner takes its share of production pro rata; however, provisions in the joint venture agreement allow additional or reduced production to be delivered under certain circumstances. Mining is conducted on multiple mineral leases having varying expiration dates. Mining leases routinely are renegotiated and renewed as they approach their respective expiration dates. Hibbing operations consist of an open pit truck and shovel mine, a concentrator that utilizes single stage crushing, AG mills and magnetic separation to produce a magnetite concentrate, which is then delivered to an on-site pellet plant. From the site, pellets are transported by BNSF rail to a ship loading port at Superior, Wisconsin operated by BNSF.
Northshore Mine
The Northshore mine is located in northeastern Minnesota, approximately two miles south of Babbitt, Minnesota on the northeastern end of the Mesabi Iron Range. Northshore’s processing facilities are located in Silver Bay, Minnesota, near Lake Superior. Crude ore is shipped by a wholly owned railroad from the mine to the processing and dock facilities at Silver Bay. Over the past five years, the Northshore mine has produced between 3.9 million and 5.8 million tons of iron ore pellets annually. Two of the four production lines at Northshore were idled beginning January 5, 2013 but the idled lines reopened during the first quarter of 2014. One of the four furnaces in the Northshore pellet plant became idled in January 2015 and is expected to remain idled throughout the year. The Northshore mine began production under our management and ownership on October 1, 1994. We own 100 percent of the mine. Mining is conducted on multiple mineral leases having varying expiration dates. Mining leases routinely are renegotiated and renewed as they approach their respective expiration dates. Northshore operations consist of an open pit truck and shovel mine where two stages of crushing occur before the ore is transported along a wholly owned 47-mile rail line to the plant site in Silver Bay. At the plant site, two additional stages of crushing occur before the ore is sent to the concentrator. The concentrator utilizes rod mills and magnetic separation to produce a magnetite concentrate, which is delivered to the pellet plant located on-site. The plant site has its own ship loading port located on Lake Superior.
United Taconite Mine
The United Taconite mine is located on Minnesota’s Mesabi Iron Range in and around the city of Eveleth, Minnesota. The United Taconite concentrator and pelletizing facilities are located ten miles south of the mine, near the town of Forbes, Minnesota. Over the past five years, the United Taconite mine has produced between 4.9 million and 5.4 million tons of iron ore pellets annually. We own 100 percent of the mine. Mining is conducted on multiple mineral leases having varying expiration dates. Mining leases routinely are renegotiated and renewed as they approach their respective expiration dates. United Taconite operations consist of an open pit truck and shovel mine where two stages of crushing occur before the ore is transported by rail to the plant site located ten miles to the south. At the plant site an additional stage of crushing occurs before the ore is sent to the concentrator. The concentrator utilizes rod mills and magnetic separation to produce a magnetite concentrate, which is delivered to the pellet plant. From the site, pellets are transported by CN rail to a ship loading port at Duluth, Minnesota operated by CN.
Asia Pacific Iron Ore
The following map shows the location of our Asia Pacific Iron Ore operation as of December 31, 2014:
In Australia, we own and operate the Koolyanobbing operations and owned and operated a 50 percent interest in the Cockatoo Island iron ore mine until we sold it in September 2012. We produced 11.4 million metric tons, 11.1 million metric tons and 11.3 million metric tons in 2014, 2013 and 2012, respectively. The 2012 production tons include tons produced at the Koolyanobbing operations and the Cockatoo Island iron ore mine.
The mineralization at the Koolyanobbing operations is predominantly hematite and goethite replacements in greenstone-hosted banded iron formations. Individual deposits tend to be small with complex ore-waste contact relationships. The reserves at the Koolyanobbing operations are derived from 10 separate mineral deposits distributed over a 70 mile operating radius.
|
| | | | | | | | | | | | | | | | |
Mine | | Cliffs Ownership | | Infrastructure | | Mineralization | | Operating Since | | Current Annual Capacity1 | | 2014 Production | | Mineral Owned | | Rights Leased |
Koolyanobbing | | 100% | | Mine, Road Haulage, Crushing- Screening Plant | | Hematite & Goethite | | 1994 | | 11.0 | | 11.4 | | —% | | 100% |
1 Annual capacity is reported on a wet basis in millions of metric tons, equivalent to 2,205 pounds. |
Koolyanobbing
The Koolyanobbing operations are located 250 miles east of Perth and approximately 30 miles northeast of the town of Southern Cross. Koolyanobbing produces lump and fines iron ore. Mining is conducted on multiple mineral leases having varying expiration dates. Mining leases routinely are renewed as they approach their respective expiration dates. In 2011, a significant permitting milestone was achieved with the granting of regulatory approvals necessary to develop above the water table at Windarling's W1 deposit. In 2013, environmental approvals were obtained for deepening of the Windarling W1 pit and deepening of the Koolyanobbing A/B/C pits.
Over the past five years, the Koolyanobbing operation has produced between 8.2 million and 11.4 million metric tons annually. The expansion project at Koolyanobbing increasing annual capacity to 11 million metric tons was completed in 2012. Ore material is sourced from nine separate open pit mines and delivered by typical production trucks or road trains to a crushing and screening facility located at Koolyanobbing. All of the ore from the Koolyanobbing operations is transported by rail to the Port of Esperance, 360 miles to the south, for shipment to Asian customers.
North American Coal
The following map shows the locations of our North American Coal operations as of December 31, 2014:
Throughout 2014, we directly owned and operated three North American coal mining complexes from which we produced a total of 7.5 million, 7.2 million and 6.4 million tons of coal in 2014, 2013 and 2012, respectively. We no longer own CLCC as the sale of the CLCC assets was completed on December 31, 2014, and therefore CLCC is not denoted on the map above. The production tons include 2.5 million tons, 2.1 million tons and 2.2 million tons of coal produced by CLCC in 2014, 2013 and 2012, respectively. Our coal production at each mine is shipped within the U.S. by rail or barge. Coal for international customers is shipped through the ports of Mobile, Alabama; Norfolk, Virginia; and New Orleans, Louisiana.
Coal seams mined at all of our North American Coal operations are Pennsylvanian Age and derived from the Pocahontas 3 and 4 seams at the Pinnacle Complex and the Blue Creek Seam at Oak Grove, which produce high quality, low ash metallurgical products.
|
| | | | | | | | | | | | | | | | |
Mine | | Cliffs Ownership | | Infrastructure | | Primary Coal Type | | Operating Since | | Current Annual Capacity1 | | 2014 Production | | Mineral Owned | | Rights Leased |
Pinnacle Complex | | 100% | | U/G Mine, Preparation Plant, Load-out | | Low-Volatile Metallurgical | | 1969 | | 4.0 | | 2.7 | | —% | | 100% |
Oak Grove | | 100% | | U/G Mine, Preparation Plant, Load-out | | Low-Volatile Metallurgical | | 1972 | | 2.5 | | 2.3 | | —% | | 100% |
1 Annual capacity is on a wet basis in millions of short tons, equivalent to 2,000 pounds. |
Pinnacle Complex
The Pinnacle Complex includes the Pinnacle and Green Ridge mines and is located approximately 30 miles southwest of Beckley, West Virginia. The Pinnacle mine has been in operation since 1969. Over the past five years, the Pinnacle mine has produced between 1.1 million and 2.8 million tons of coal annually. The Green Ridge mines became operational in 2004 and have ranged from no production to 0.1 million tons of coal annually in the last five years. In February 2010, the Green Ridge No. 1 mine was closed permanently due to exhaustion of the economic reserves at the mine. In addition, the Green Ridge No. 2 mine was idled in January 2012. Pinnacle utilizes continuous miners and a longwall plow system; Green Ridge utilizes only continuous miners. Both facilities share preparation, processing and load-out facilities.
Oak Grove
The Oak Grove mine is located approximately 25 miles southwest of Birmingham, Alabama. The mine has been in operation since 1972. Over the past five years, the Oak Grove mine has produced between 1.0 million and 2.3 million tons of coal annually. In 2011, a new shaft and support facilities were commissioned in order to reduce the transport time for supplies and personnel to the working face. The previous shaft still is utilized in a support role. Oak Grove utilizes a long wall shearer with continuous miners. Preparation, processing and rail load-out facilities are located on-site. The preparation plant at Oak Grove incurred significant tornado damage during 2011. The plant rebuild included new equipment and improvements to the process design that enhanced the performance of the plant, which returned to normal operating capacity in January 2012.
Eastern Canadian Iron Ore
The following map shows the locations of our Eastern Canadian Iron Ore operations as of December 31, 2014:
We own interests in two non-operating iron ore mines in the Canadian Provinces of Québec and Newfoundland and Labrador from which we had been producing iron ore concentrate through December 2014 and produced iron ore pellets through June 2013. We produced 6.2 million, 8.7 million and 8.5 million metric tons of iron ore product in 2014, 2013 and 2012, respectively, from these two mines. In May 2011, we acquired Consolidated Thompson along with its 75 percent interest in the Bloom Lake property. In the fourth quarter of 2013, our interest in Bloom Lake increased by an aggregate of 7.8 percent, bringing our interest to 82.8 percent in the Bloom Lake property.
Our Eastern Canadian mines had been producing from deposits located within the area known as the Labrador Trough and are composed of iron formations, which are classified as Lake Superior type. Lake Superior type iron formations consist of banded sedimentary rocks that formed under similar conditions in shallow marine basins approximately two billion years ago. The Labrador Trough region experienced considerable metamorphism and folding of the original iron deposits. Magnetite and hematite are the predominant iron oxide ore minerals present, with lesser amounts of goethite and limonite. Quartz is the predominant waste mineral present, with lesser amounts of other chiefly iron bearing silicate minerals. The ore minerals liberate from the waste minerals upon fine grinding.
|
| | | | | | | | | | | | | | | | |
Mine | | Cliffs Ownership | | Infrastructure | | Mineralization | | Operating Since | | Current Annual Capacity1, 2 | | 2014 Production2 | | Mineral Owned | | Rights Leased |
Wabush3 | | 100% | | Mine, Concentrator, Pelletizer, Railroad | | Hematite | | 1965 | | 5.6 | | 0.3 | | —% | | 100% |
Bloom Lake4 | | 82.8% | | Mine, Concentrator, Railroad | | Hematite | | 2010 | | 7.2 | | 5.9 | | —% | | 100% |
1 Annual capacity is reported on a wet basis in millions of metric tons, equivalent to 2,205 pounds. |
2 Figures reported on 100% basis. |
3 At the end of March 2014, we idled our Wabush Scully mine in Newfoundland and Labrador and began to implement the permanent closure plan for the mine. |
4 In December 2014, iron ore production at the Bloom Lake mine was suspended and the Bloom Lake mine was placed in ‘‘care-and-maintenance’’ mode. |
Wabush Mine
The Wabush mine has been in operation since 1965. Over the past five years, the Wabush mine has produced between 0.3 million and 3.9 million metric tons of iron ore pellets and concentrate annually. Mining was conducted on several mineral leases having varying expiration dates. Mining leases are routinely renegotiated and renewed as they approach their respective expiration dates. The Wabush mine and concentrator are located in Wabush, Newfoundland and Labrador, and the pelletizing operations and dock facility are located in Pointe Noire, Québec. At the mine, operations consisted of an open pit truck and shovel mine, a concentrator that utilizes single stage crushing, AG mills and gravity separation to produce an iron concentrate. Concentrates had been shipped by rail 300 miles to Pointe Noire where they were pelletized through June 2013 for shipment via vessel within Canada, to the U.S. and other international destinations. Concentrates had been shipped directly from Pointe Noire for sinter feed.
As disclosed in the first quarter of 2014, at the end of March 2014, we idled our Wabush Scully mine in Newfoundland and Labrador and began to implement the permanent closure plan for the mine in October 2014. The idle and move to ultimate closure was driven by the unsustainable high cost structure. The pellet plant operations at Pointe Noire had been idled since the second quarter of 2013.
Bloom Lake Mine
The Bloom Lake mine and concentrator are located approximately nine miles southwest of Fermont, Québec. As previously mentioned, our acquisition of Consolidated Thompson in May 2011 included a 75 percent majority ownership in the Bloom Lake operation. During the fourth quarter of 2013, CQIM's interest in the property increased by an aggregate of 7.8 percent to 82.8 percent after CQIM paid both its own and WISCO’s proportionate shares of the cash call for the first half of 2013. As a result, WISCO's interest was diluted to 17.2 percent. Since the acquisition in May 2011, the Bloom Lake mine has produced between 3.5 million and 5.9 million metric tons of iron ore concentrate annually. Phase I of the Bloom Lake mine was commissioned in March 2010, and consisted of an open pit truck and shovel mine, a concentrator that utilizes single stage crushing, an AG mill and gravity separation to produce an iron concentrate. From the site, concentrate is transported 320 miles by rail to a ship loading port in Pointe Noire, Québec.
The Bloom Lake mine assets were included in the CCAA filing made in January 2015. For more information see "Eastern Canadian Iron Ore" in Item 1 - Business.
Advanced Exploration and Development Properties
The following map shows the locations of our advanced exploration and development properties as of December 31, 2014:
We have several advanced exploration projects located in the Canadian provinces of British Columbia, Ontario and Québec in different stages of evaluation at this time. Work historically completed on these properties includes geological mapping, drilling and sampling programs, and initial and advance stage engineering studies. In alignment with our capital allocation strategy, we anticipate minimal levels of exploration spending to continue in 2015 and beyond.
Chromite Project
Cliffs Chromite Ontario's primary assets are situated in the Ring of Fire area, James Bay lowlands, of northern Ontario. These chromite properties are located approximately 155 miles north of the town of Nakina (on the CN railroad mainline) and about 50 miles east of the First Nations community of Webequie. We have a controlling position in three chromite deposits that occur in close proximity to each other: a 100 percent interest in each of the Black Label and Black Thor chromite deposits and a 70 percent interest in the Big Daddy chromite deposit. KWG Resources Inc. owns the remaining 30 percent. We have completed a prefeasibility study on the Black Thor deposit, the largest of the three deposits. On November 20, 2013, we suspended indefinitely our Chromite Project in Northern Ontario. Earlier in 2013, prior to the indefinite suspension of our Chromite Project, we suspended the environmental assessment activities because of pending issues impeding the progress of the project. The Chromite Project remained suspended throughout 2014. Given the uncertain timeline and risks associated with the development of necessary infrastructure to bring this project online, we do not expect to allocate any significant additional capital to the project, and are currently seeking to exit the Chromite Project through a possible sale of all or part of the assets or holding subsidiaries.
These chromite deposits are orthomagmatic stratiform deposits of unusual thickness and size. Mineralization consists of chromite crystals [(Fe,Mg) (Cr,Al,Fe)2O4] ranging from massive chromite bands to interbedded and disseminated chromite.
Decar Property
The Decar Property is located 56 miles northwest of Fort St. James, British Columbia, Canada and consists of 60 mineral claims covering 95 square miles. We own a 60 percent interest in the Decar Property and First Point Minerals Corp. owns the remaining 40 percent. In 2012, 2011 and 2010, we performed exploration activities on the property and in 2013 completed a scoping study to further evaluate the potential economics and viability of an operation producing a high-grade nickel concentrate that could be marketable to various end users. In 2013, our interest in the property increased from 51 percent to 60 percent as a result of completing the scoping study in accordance with the 2009 option agreement between Cliffs and First Point Minerals. Our Decar project program for 2014 has consisted of basic ongoing activity related to First Nations engagement and baseline environmental studies completed early in 2014. During 2014, we limited spending on the Decar Property. Given the uncertain timeline and risks associated with the development of necessary infrastructure to bring this project online, we do not expect to allocate any significant additional capital to the project.
The mineralization consists of the nickel-iron alloy awaruite (Ni2-3Fe). Awaruite is disseminated in serpentinized peridotite; it occurs as relatively coarse grains between 50 to 400 µm in size. Awaruite has been observed throughout the entire extent of the peridotite but four zones of stronger mineralization have been identified. The four zones are the Baptiste, Sidney, Target B and Van targets. Prior to suspending spending on the Decar Property, exploration programs,
resource definition drilling and engineering studies associated with the scoping study had focused on the Baptiste prospect.
Labrador Trough South
The Labrador Trough South property is located approximately 150 miles north of Sept-Iles, Québec and 30 miles southwest of the town of Fermont, Québec. Provincial highway 389 crosses the south and east sides of the property and provides year-round access. The property consists of a total of 636 non-contiguous claims covering roughly 130 square miles. Several areas containing iron mineralization have been further defined utilizing aerial geophysics, outcrop mapping and diamond drilling. These areas are known as: Lamêlée, Peppler Lake, Hobdad, Lac Jean and Faber. To date most of the exploration efforts focused on the first three areas. Cliffs acquired 100 percent ownership of the claims as part of the Consolidated Thompson acquisition in 2011. During 2014, we limited spending on the Labrador Trough South property. Given the uncertain timeline and risks associated with the development of necessary infrastructure to bring this project online, we do not expect to allocate any significant additional capital to the project. The Labrador Trough South property was included in the CCAA filing made in January 2015.
The Labrador Trough South property is situated in the Knob Lake Group of sedimentary rocks including Lake Superior-type banded iron formations. Here, the Labrador Trough is crossed by the Grenville Front. Trough rocks in the Grenville Province are highly metamorphosed, complexly folded and structurally dislocated. The high-grade metamorphism of the Grenville Province is responsible for recrystallization of both iron oxides and silica producing coarse-grained sugary quartz, magnetite, specular hematite schists and gneisses that are of improved quality for concentrating and processing. Potentially recoverable minerals in the project are predominantly magnetite and subordinate hematite.
Mineral Policy
We have a corporate policy prescribing internal control and procedures with respect to auditing and estimating of minerals. The procedures contained in the policy include the calculation of mineral estimates at each property by our engineers, geologists and accountants, as well as third-party consultants. Management compiles and reviews the calculations, and once finalized, such information is used to prepare the disclosures for our annual and quarterly reports. The disclosures are reviewed and approved by management, including our president and chief financial officer. Additionally, the long-range mine planning and mineral estimates are reviewed annually by our Audit Committee. Furthermore, all changes to mineral estimates, other than those due to production, are adequately documented and submitted to senior operations officers for review and approval. Finally, periodic reviews of long-range mine plans and mineral reserve estimates are conducted at mine staff meetings, senior management meetings and by independent experts.
Mineral Reserves
Reserves are defined by SEC Industry Standard Guide 7 as that part of a mineral deposit that could be economically and legally extracted and produced at the time of the reserve determination. All reserves are classified as proven or probable and are supported by life-of-mine plans.
Reserve estimates are based on pricing that does not exceed the three-year trailing average of benchmark prices for iron ore and coal adjusted to our realized price. For the three-year period 2011 to 2013, the average international benchmark price of 62 percent Fe CFR China was $145 per dry metric ton. For the same period, the benchmark coal prices FOB U.S. East Coast were $219 per metric ton for low-volatile coal.
We evaluate and analyze mineral reserve estimates in accordance with our mineral policy and SEC requirements. The table below identifies the year in which the latest reserve estimate was completed.
|
| | |
Property | | Date of Latest Economic Reserve Analysis |
U.S. Iron Ore | | |
Empire | | 2009 |
Tilden | | 2011 |
Hibbing | | 2012 |
Northshore | | 2012 |
United Taconite | | 2013 |
Asia Pacific Iron Ore | | |
Koolyanobbing | | 2013 |
North American Coal | | |
Pinnacle Complex | | 2013 |
Oak Grove | | 2012 |
Iron Ore Reserves
Ore reserve estimates for our iron ore mines as of December 31, 2014 were estimated from fully designed open pits developed using three-dimensional modeling techniques. These fully designed pits incorporate design slopes, practical mining shapes and access ramps to assure the accuracy of our reserve estimates. In the first quarter of 2014, we made the decision to idle all production at our Wabush mine. Production at our Wabush mine was idled by the end of March 2014, and in November 2014, we determined to implement the permanent closure plan for the mine, which became effective in the fourth quarter of 2014. On November 19, 2014, we announced that we are pursuing exit options for our Eastern Canadian Iron Ore operations, which may result in the closure of the Bloom Lake mine. Additionally, as disclosed on January 2, 2015, active production at Bloom Lake mine has completely ceased and the mine has transitioned to "care-and-maintenance" mode. As a result, the reserves previously reported for Wabush and Bloom Lake mines have been removed from our reserve estimates. All of our remaining operations reserves have been adjusted net of 2014 production.
U.S. Iron Ore
All tonnages reported for our U.S. Iron Ore operating segment are in long tons of 2,240 pounds, have been rounded to the nearest 100,000 and are reported on a 100 percent basis.
|
| | | | | | | | | | | | | | | | | | | | | | | | | | |
U.S. Iron Ore Mineral Reserves |
as of December 31, 2014 |
(In Millions of Long Tons) |
| | | Proven | | Probable | | Proven & Probable | | Saleable Product 2,3 | | Previous Year |
Property | Cliffs Share | | Tonnage | % Grade | | Tonnage | % Grade | | Tonnage | % Grade5 | | Process Recovery4 | Tonnage | | P&P Crude Ore | Saleable Product |
Empire | 79 | % | | 14.6 |
| 20.9 |
| | — |
| — |
| | 14.6 |
| 20.9 |
| | 32% | 4.7 |
| | 4.7 |
| 1.4 |
|
Tilden Hematite1 | 85 | % | | 454.3 |
| 35.7 |
| | 130.0 |
| 36.1 |
| | 584.3 |
| 35.8 |
| | 34% | 199.6 |
| | 604.6 |
| 207.2 |
|
Tilden Magnetite | 85 | % | | 66.0 |
| 29.1 |
| | 11.7 |
| 29.2 |
| | 77.7 |
| 29.1 |
| | 38% | 29.5 |
| | 84.6 |
| 31.9 |
|
Total Tilden | 85 | % | | 520.3 |
| | | 141.7 |
| | | 662.0 |
| | | 35% | 229.1 |
| | 689.2 |
| 239.1 |
|
Hibbing | 23 | % | | 239.5 |
| 18.9 |
| | 20.7 |
| 18.9 |
| | 260.2 |
| 18.9 |
| | 26% | 68.0 |
| | 287.5 |
| 75.4 |
|
Northshore | 100 | % | | 323.7 |
| 25.5 |
| | 712.6 |
| 24.8 |
| | 1,036.3 |
| 25.0 |
| | 34% | 351.8 |
| | 1,051.4 |
| 356.9 |
|
United Taconite | 100 | % | | 409.2 |
| 23.1 |
| | 65.9 |
| 22.9 |
| | 475.1 |
| 23.1 |
| | 34% | 159.2 |
| | 489.4 |
| 164.1 |
|
Totals | | | 1,507.3 |
| | | 940.9 |
| | | 2,448.2 |
| | | | 812.8 |
| | 2,522.2 |
| 836.9 |
|
| | | | | | | | | | | | | | | | |
1 Tilden hematite reported grade is percent FeT; all other properties are percent magnetic iron |
2 Saleable product is a standard pellet containing 60 to 66 percent Fe calculated from both proven and probable mineral reserves |
3 Saleable product is reported on a dry basis; shipped products typically contain 1 to 4 percent moisture |
4 Process recovery includes all factors for converting crude ore tonnage to saleable product |
5 Cutoff grades are 15 percent magnetic iron for Hibbing and Empire, 17 percent for United Taconite, 19 percent for Northshore and 20 percent for Tilden. Cutoff for Tilden hematite is 25 percent FeT. |
As previously announced, we entered into an agreement with our partner at the Empire mine on February 24, 2014 in regard to an extension of the mine life until 2016. Reserve figures for the Empire mine have been updated to reflect the increased crude ore tonnage and pellet production we expect to realize based on the extended mine life.
Asia Pacific Iron Ore
All tonnages reported for our Asia Pacific Iron Ore operating segment are in metric tons of 2,205 pounds, have been rounded to the nearest 100,000 and are reported on a 100 percent basis.
|
| | | | | | | | | | | | | | | |
Asia Pacific Iron Ore Mineral Reserves |
as of December 31, 2014 |
(In Millions of Metric Tons)1 |
| | | Proven | | Probable | | Proven & Probable | | Previous Year Total |
Property | Cliffs Share | | Tonnage | % Fe | | Tonnage | % Fe | | Tonnage | % Fe2 | | Tonnage |
Koolyanobbing | 100% | | 6.5 | 57.9 |
| | 54.3 |
| 60.1 | | 60.8 |
| 59.8 | | 64.5 |
| | | | | | | | | | | | |
1 Tonnages reported are saleable product reported on a dry basis; shipped products contain approximately 3 percent moisture |
2 Cutoff grade is 54 percent FeT |
Coal Reserves
Coal reserves estimates for our North American underground mines as of December 31, 2014 were estimated using three-dimensional modeling techniques, coupled with scheduled mine plans. The Pinnacle operations and Oak Grove operations reserves have not changed net of 2014 mine production. Effective December 31, 2014, the sale of the CLCC assets was completed and, as a result, the reserves previously reported have been removed from our reserve estimates.
North American Coal
All tonnages reported for our North American Coal operating segment are in short tons of 2,000 pounds, have been rounded to the nearest 100,000 and are reported on a 100 percent basis.
|
| | | | | | | | | | | | | | | | | | | |
Recoverable Coal Reserves |
as of December 31, 2014 |
(In Millions of Short Tons)1 |
| | | Category2 | | Coal Type | | | | Reserve Classification | | Quality | | Previous Year |
Property/Seam | Cliffs Share | | Mine Type | | Proven | | Probable | | Total P&P | | % Sulfur | | As Received Btu/lb | Total P&P |
Pinnacle Complex | | | | | | | | | | | | | | | | | | | |
Pocahontas No 3 | 100% | | Assigned | | Metallurgical | | U/G | | 29.0 | | 9.9 | | 38.9 | | 0.92 | | 14,000 | | 41.6 |
Pocahontas No 4 | 100% | | Unassigned | | Metallurgical | | U/G | | 2.8 | | 0.5 | | 3.3 | | 0.51 | | 14,000 | | 3.3 |
Oak Grove | | | | | | | | | | | | | | | | | | | |
Blue Creek Seam | 100% | | Assigned | | Metallurgical | | U/G | | 28.7 | | 4.0 | | 32.7 | | 0.57 | | 14,000 | | 35.0 |
Totals | | | | | | | | | 60.5 | | 14.4 | | 74.9 | | | | | | 79.9 |
| | | | | | | | | | | | | | | | | | | |
1 Recoverable coal is reported on a wet basis containing approximately 6 percent moisture |
2 Assigned reserves represent coal that can be mined without a significant capital expenditure, whereas unassigned reserves will require significant capital expenditures before production could be realized |
Alabama Dust Litigation. There are currently three cases in the Alabama state court system that comprise the Alabama Dust Litigation. Generally, these claims are brought by nearby homeowners who allege that dust emanating from the Concord Preparation Plant causes damage to their properties. All three of these cases are active and settlement discussions are proceeding. It is possible that these types of complaints may continue to be filed in the future, but the overall impact of these cases is not anticipated currently to have a material financial impact on our business.
Bloom Lake Investigation. CQIM, Bloom Lake General Partner Limited and Bloom Lake were investigated by Environment Canada in relation to alleged violations of Section 36(3) of the Fisheries Act that prohibits the deposit of a deleterious substance in water frequented by fish or in any place where the deleterious substance may enter any such water and Section 40(3) of the Fisheries Act in relation to an alleged failure to comply with a direction of an inspector. The investigation covered several alleged incidents that occurred between April 2011 and October 2012. The Bloom Lake investigation was settled on December 19, 2014 resolving all allegations and included a fine of C$1.5 million and a contribution to the Environmental Damages Fund of C$6.0 million. CQIM, Bloom Lake General Partner Limited and Bloom Lake entered into a Management Directive with Environment Canada which outlines compliance obligations to address these concerns going forward.
Essar Litigation. The Cleveland-Cliffs Iron Company, Northshore Mining Company and Cliffs Mining Company (collectively, the "Cliffs Plaintiffs") filed a complaint against Essar in the U.S. District Court for the Northern District of Ohio, Eastern Division, on January 12, 2015, asserting that Essar breached the Essar Sale Agreement by, among other things, failing to take delivery of and pay for its nominated ore in 2014, failing to make certain payments under a true up provision, and disclosing confidential information. The complaint also seeks a declaration that Essar is not entitled to receive certain credit payments under the terms of the Essar Sale Agreement. The Cliffs Plaintiffs seek damages in excess of $90 million. Essar filed an Answer and Counterclaim on February 11, 2015, seeking damages in excess of $160 million for various alleged breaches of the Essar Sale Agreement, including failure to deliver ore, overcharging for certain deliveries, failure to pay certain credit payments and disclosing confidential information.
Maritime Asbestos Litigation. The Cleveland-Cliffs Iron Company and/or The Cleveland-Cliffs Steamship Company have been named defendants in 489 actions brought from 1986 to date by former seamen claiming damages for various illnesses allegedly suffered as the result of exposure to airborne asbestos fibers while serving as crew members aboard the vessels previously owned or managed by our entities until the mid-1980s. All of these actions have been consolidated into multidistrict proceedings in the Eastern District of Pennsylvania, along with approximately 30,000 other cases from various jurisdictions that were filed against other defendants. Through a series of court orders, the docket has been reduced to approximately 3,500 active cases. We are a named defendant in approximately 50 cases. These cases are in the discovery phase. The court has dismissed the remainder of the cases without prejudice. Those dismissed cases could be reinstated upon application by plaintiffs’ counsel. The claims against our entities are insured in amounts that vary by policy year; however, the manner in which coverage will be applied remains uncertain. Our entities continue to vigorously contest these claims and have made no settlements on them.
Pinnacle Mine Environmental Litigation. On June 22, 2010, the West Virginia DEP filed a lawsuit in the Wyoming County Circuit Court against the Pinnacle mine alleging past non-compliance with its NPDES discharge permit. The complaint seeks injunctive relief and penalties. An initial penalty proposal of $1.0 million was offered by the West Virginia DEP in March 2012; however, Pinnacle disagrees with the alleged violations and has met with the DEP to present facts supporting a review and reduction of the proposed penalty.
Pointe Noire Investigation. Wabush Mines was investigated by Environment Canada in relation to alleged violations of (i) Section 36(3) of the Fisheries Act, which prohibits the deposit of a deleterious substance in water frequented by fish or in any place where the deleterious substance may enter any such water, and (ii) Section 5.1 of the Migratory Bird Convention Act, 1994. The Québec Ministry of Sustainable Development, Environment, Wildlife and Parks also conducted an investigation into alleged violations of Section 8 of the Hazardous Material Regulation, which prohibits the discharge of a hazardous material to the environment. The investigations covered events surrounding and leading up to the alleged release of approximately 1,320 gallons of fuel oil into the Bay of Sept-Iles on September 1, 2013. We cooperated with the investigators and agency response officials. In April 2014, the Québec Ministry of Justice filed a penalty charge related to the incident. The Pointe Noire investigation was settled in December 2014. A fine of C$750,000 and C$61,000 in costs were agreed to be paid. We are anticipating a report by the Québec Ministry related to their assessment of the cleanup activities and further direction related to requirements for additional environmental monitoring, if any.
Putative Class Action Lawsuits. In May 2014, alleged purchasers of our common shares filed suit in the U.S. District Court for the Northern District of Ohio against us and certain current and former officers and directors of the Company. The action is captioned Department of the Treasury of the State of New Jersey and Its Division of Investment v. Cliffs Natural Resources Inc., et al., No. 1:14-CV-1031. The action asserts violations of the federal securities laws based on alleged false or misleading statements or omissions during the period of March 14, 2012 to March 26, 2013, regarding operations at our Bloom Lake mine in Québec, Canada, and the impact of those operations on our finances and outlook, including sustainability of the dividend, and that the alleged misstatements caused our common shares to trade at artificially inflated prices. The lawsuit seeks class certification and an award of monetary damages to the putative class in an unspecified amount, along with costs of suit and attorneys’ fees. On October 21, 2014, defendants filed a motion to dismiss this action. The lawsuit has been referred to our insurance carriers.
In June 2014, an alleged purchaser of the depositary shares issued by Cliffs in a public offering in February 2013 filed a putative class action, which is currently pending in the U.S. District Court for the Northern District of Ohio and is captioned Rosenberg v. Cliffs Natural Resources Inc., et al., No. 1:14-cv-01531, The suit asserts claims against us, certain current and former officers and directors of the Company, and several underwriters of the offering, alleging disclosure violations in the registration statement regarding operations at our Bloom Lake mine and the impact of those operations on our finances and outlook. This action seeks class certification and monetary relief in an unspecified amount, along with costs of suit and attorneys’ fees. This lawsuit has been referred to our insurance carriers.
The Rio Tinto Mine Site. The Rio Tinto Mine Site is an historic underground copper mine located near Mountain City, Nevada, where tailings were placed in Mill Creek, a tributary to the Owyhee River. Site investigation and remediation work is being conducted in accordance with a Consent Order dated September 14, 2001 between the NDEP and the RTWG composed of the Company, Atlantic Richfield Company, Teck Cominco American Incorporated and E. I. duPont de Nemours and Company. The Consent Order provides for technical review by the U.S. Department of the Interior Bureau of Indian Affairs, the U.S. Fish and Wildlife Service, U.S. Department of Agriculture Forest Service, the NDEP and the Shoshone-Paiute Tribe of the Duck Valley Reservation (collectively, "Rio Tinto Trustees"). In recognition of the potential for an NRD claim, the parties actively pursued a global settlement that would include the EPA and encompass both the remedial action and the NRD issues.
The NDEP published a Record of Decision for the Rio Tinto Mine, which was signed on February 14, 2012 by the NDEP and the EPA. On September 27, 2012, the agencies subsequently issued a proposed Consent Decree, which was lodged with the U.S. District Court for the District of Nevada and opened for 30-day public comment on October 4, 2012. The Consent Decree subsequently was finalized on May 20, 2013. Under the terms of the Consent Decree, the RTWG has agreed to pay over $29 million in cleanup costs and natural resource damages to the site and surrounding area. The Company's share of the total settlement cost, which includes remedial action, insurance and other oversight costs, is approximately $12 million.
Under the terms of the Consent Decree, the RTWG will be responsible for removing mine tailings from Mill Creek, improving the creek to support redband trout and improving water quality in Mill Creek and the East Fork Owyhee River. Previous cleanup projects included filling in old mine shafts, grading and covering leach pads and tailings, and building diversion ditches. NDEP will oversee the cleanup, with input from EPA and monitoring from the nearby Shoshone-Paiute Tribes of Duck Valley.
Shareholder Derivative Lawsuits. In June and July 2014, alleged shareholders of Cliffs filed three derivative actions in the Cuyahoga County, Ohio, Court of Common Pleas asserting claims against certain current and former officers and directors of the Company. These actions, captioned Black v. Carrabba, et al., No. CV-14-827803, Asmussen v. Carrabba, et al., No. CV-14-829259, and Williams, et al. v. Carrabba, et al., No. CV-14-829499, allege that the individually named defendants violated their fiduciary duties to the Company by, among other things, disseminating false and misleading information regarding operations at our Bloom Lake mine in Québec, Canada, and the impact of those operations on our finances and outlook, including sustainability of the dividend, failing to maintain internal controls, and failing to appropriately oversee and manage the Company. The complaints assert additional claims for unjust enrichment, abuse of control, gross mismanagement, and waste of corporate assets. The complaints seek damages, restitution, and equitable relief against the individually named defendants and in favor of the Company, along with costs of suit and attorneys’ fees. These lawsuits have been referred to our insurance carriers. As these are derivative actions, we have been named only as a nominal defendant.
Southern Natural Gas Lawsuit: On July 23, 2014, Southern Natural Gas Company, L.L.C. filed a lawsuit in the Circuit Court of Jefferson County, Alabama (Case No. 68-CV-2014-900533.00) against the Company and others. The suit seeks to prevent coal mining activity underneath a gas pipeline at our Oak Grove property and to require defendants to pay the costs associated with relocating that pipeline. The suit seeks declaratory judgment, permanent injunctive relief and nuisance damages. The Circuit Court denied our motion to dismiss the complaint and we subsequently filed a petition for a writ of mandamus in the Alabama Supreme Court requesting that it direct the Circuit Court to dismiss the case for lack of subject matter jurisdiction. We filed a motion to stay discovery pending the Alabama Supreme Court's decision on the mandamus petition. Unless and until that motion is granted, discovery is ongoing in the Circuit Court. We also filed a Joinder of Additional Parties, including Kinder Morgan, Inc., and a Counterclaim, asserting breach or repudiation of easement agreements, interference with business relations, and slander of title.
Taconite MACT Compliance Review. EPA Region 5 issued Notices of Violation during the first quarter of 2014 to Empire, Tilden and United Taconite related to alleged historical violations of the Taconite MACT rule and certain elements of the respective state-issued Title V operating permits. Initial meetings were held with the EPA in the second quarter of 2014. While the matter has been referred to the DOJ for enforcement, the overall impact is not anticipated currently to have a material impact on our business.
Worldlink Arbitration. In October 2011, our wholly owned subsidiary, CQIM, along with Bloom Lake General Partner Limited and The Bloom Lake Iron Ore Mine Limited Partnership, instituted an arbitration claim against the Bloom Lake mine’s former customer, Worldlink Resources Limited, for material and/or fundamental breaches of the parties’ 2007 offtake agreement for the purchase and sale of iron concentrate produced at the Bloom Lake mine. Our subsidiaries filed the arbitration claim with the International Court of Arbitration of the International Chamber of Commerce pursuant to the dispute resolution provisions of the offtake agreement. Our subsidiaries terminated the offtake agreement with Worldlink in August 2011 due to Worldlink’s failure to fulfill its obligations under the agreement and Worldlink’s demand to renegotiate the price of the iron ore concentrate in spite of being party to a long-term offtake agreement. Our subsidiaries claimed damages for the breach of the offtake agreement in excess of $85 million and Worldlink counterclaimed for damages in excess of $100 million. In November 2014, the arbitrators decided in favor of Worldlink and awarded it damages in an amount of approximately $71 million as well as approximately $25 million in accrued interest from the date of termination of the offtake agreement in August 2011 and arbitration costs. This judgment has been included in the CCAA filing of the Bloom Lake Group and will be treated as an unsecured claim.
|
| |
Item 4. | Mine Safety Disclosures |
We are committed to protecting the occupational health and well-being of each of our employees. Safety is one of our core values, and we strive to ensure that safe production is the first priority for all employees. Our internal objective is to achieve zero injuries and incidents across the Company by focusing on proactively identifying needed prevention activities, establishing standards and evaluating performance to mitigate any potential loss to people, equipment, production and the environment. We have implemented intensive employee training that is geared toward maintaining a high level of awareness and knowledge of safety and health issues in the work environment through the development and coordination of requisite information, skills and attitudes. We believe that through these policies, we have developed an effective safety management system.
Under the Dodd-Frank Act, each operator of a coal or other mine is required to include certain mine safety results within its periodic reports filed with the SEC. As required by the reporting requirements included in §1503(a) of the Dodd-Frank Act and Item 104 of Regulation S-K, the required mine safety results regarding certain mining safety and health matters for each of our mine locations that are covered under the scope of the Dodd-Frank Act are included in Exhibit 95 of Item 15. Exhibits and Financial Statement Schedules of this Annual Report on Form 10-K.
PART II
|
| |
Item 5. | Market for Registrant's Common Equity, Related Stockholder Matters and Issuer Purchases of Equity Securities |
Stock Exchange Information
Our common shares (ticker symbol CLF) are listed on the NYSE.
Common Share Price Performance and Dividends
The following table sets forth, for the periods indicated, the high and low sales prices per common share as reported on the NYSE and the dividends declared per common share:
|
| | | | | | | | | | | | | | | | | | | | | | | | |
| | 2014 | | 2013 |
| | High | | Low | | Dividends | | High | | Low | | Dividends |
First Quarter | | $ | 26.63 |
| | $ | 17.40 |
| | $ | 0.15 |
| | $ | 40.40 |
| | $ | 17.95 |
| | $ | 0.15 |
|
Second Quarter | | 21.25 |
| | 13.60 |
| | 0.15 |
| | 23.75 |
| | 15.50 |
| | 0.15 |
|
Third Quarter | | 18.41 |
| | 10.19 |
| | 0.15 |
| | 25.95 |
| | 15.41 |
| | 0.15 |
|
Fourth Quarter | | 11.70 |
| | 5.63 |
| | 0.15 |
| | 28.98 |
| | 19.88 |
| | 0.15 |
|
Year | | 26.63 |
| | 5.63 |
| | $ | 0.60 |
| | 40.40 |
| | 15.41 |
| | $ | 0.60 |
|
At February 23, 2015, we had 1,312 shareholders of record.
On January 22, 2015, we amended the Amended and Restated Multicurrency Credit Agreement (Amendment No. 6) among Cliffs Natural Resources Inc. and various lenders dated August 11, 2011 (as further amended by Amendment No. 1 as of October 16, 2012, Amendment No. 2 as of February 8, 2013, Amendment No. 3 as of June 30, 2014, Amendment No. 4 as of September 9, 2014 and Amendment No. 5 as of October 24, 2014), or revolving credit agreement, to effect the following, among other items:
| |
• | a reduction of the permitted amount of quarterly dividends on our common shares to not more than $0.01 per share in any fiscal quarter. |
On January 26, 2015, we announced that our Board of Directors had decided to eliminate the quarterly dividend of $0.15 per share on our common shares. The decision is applicable to the first quarter of 2015 and all subsequent quarters. The elimination of the common share dividend provides us with additional free cash flow of approximately $92 million annually, which we intend to use for further debt reduction. We see accelerated debt reduction as a more effective means of protecting our shareholders than continuing to pay a common share dividend.
Shareholder Return Performance
The following graph shows changes over the past five-year period in the value of $100 invested in: (1) Cliffs' common shares; (2) S&P 500 Stock Index; (3) S&P 500 Steel Group Index; and (4) S&P Midcap 400 Index. The values of each investment are based on price change plus reinvestment of all dividends reported to shareholders.
|
| | | | | | | | | | | | | |
| | | 2009 | | 2010 | | 2011 | | 2012 | | 2013 | | 2014 |
Cliffs Natural Resources Inc. | Return % | | | | 70.69 | | -19.24 | | -34.74 | | -30.37 | | -71.69 |
| Cum $ | | 100.00 | | 170.69 | | 137.85 | | 89.97 | | 62.65 | | 17.74 |
S&P 500 Index - Total Returns | Return % | | | | 15.07 | | 2.11 | | 16.00 | | 32.39 | | 13.69 |
| Cum $ | | 100.00 | | 115.07 | | 117.50 | | 136.30 | | 180.44 | | 205.14 |
S&P 500 Steel Index | Return % | | | | 33.86 | | -23.01 | | -11.84 | | 13.86 | | -9.06 |
| Cum $ | | 100.00 | | 133.86 | | 103.06 | | 90.86 | | 103.45 | | 94.08 |
S&P Midcap 400 Index | Return % | | | | 26.64 | | -1.74 | | 17.86 | | 33.50 | | 9.77 |
| Cum $ | | 100.00 | | 126.64 | | 124.43 | | 146.66 | | 195.79 | | 214.92 |
Issuer Purchases of Equity Securities
The following table presents information with respect to repurchases by the Company of our common shares during the periods indicated.
ISSUER PURCHASES OF EQUITY SECURITIES
|
| | | | | | | | | | | |
Period | | Total Number of Shares (or Units) Purchased (1) | | Average Price Paid per Share (or Unit) | | Total Number of Shares (or Units) Purchased as Part of Publicly Announced Plans or Programs | | Maximum Number (or Approximate Dollar Value) of Shares (or Units) that May Yet be Purchased Under the Plans or Programs (2) |
October 1 - 31, 2014 | | — |
| | $ | — |
| | — | | $200,000,000 |
November 1 - 30, 2014 | | 5,792 |
| | $ | 10.73 |
| | — | | $200,000,000 |
December 1 - 31, 2014 | | 3,119 |
| | $ | 6.71 |
| | — | | $200,000,000 |
Total | | 8,911 |
| | $ | 9.32 |
| | — | | $200,000,000 |
| |
(1) | These shares were delivered to us by employees to satisfy tax withholding obligations due upon the vesting or payment of stock awards or scheduled distributions from our VNQDC Plan. |
| |
(2) | On August 25, 2014, the Board of Directors authorized a new share repurchase plan pursuant to which we may buy back our outstanding common shares in the open market or in private negotiated transactions up to a maximum of $200 million. No shares have been purchased through December 31, 2014. The authorization is active until December 31, 2015. |
|
| |
Item 6. | Selected Financial Data |
|
| | | | | | | | | | | | | | | | | | | | | | | |
Summary of Financial and Other Statistical Data - Cliffs Natural Resources Inc. and Subsidiaries |
| | | | | 2014 (g) | | 2013 (f) | | 2012 (d) | | 2011 (c) | | 2010 (b) |
Financial data (in millions, except per share amounts) * | | | | | | | | |
Revenue from product sales and services | $ | 4,623.7 |
| | $ | 5,691.4 |
| | $ | 5,872.7 |
| | $ | 6,563.9 |
| | $ | 4,483.8 |
|
Cost of goods sold and operating expenses | (4,172.3 | ) | | (4,542.1 | ) | | (4,700.6 | ) | | (3,953.0 | ) | | (3,025.1 | ) |
Other operating expense | (9,896.7 | ) | | (478.3 | ) | | (1,480.9 | ) | | (314.1 | ) | | (225.9 | ) |
Operating income (loss) | (9,445.3 | ) | | 671.0 |
| | (308.8 | ) | | 2,296.8 |
| | 1,232.8 |
|
Income (loss) from continuing operations | (8,311.6 | ) | | 359.8 |
| | (1,162.5 | ) | | 1,792.5 |
| | 997.4 |
|
Income and gain on sale from discontinued operations, net of tax | — |
| | 2.0 |
| | 35.9 |
| | 20.1 |
| | 22.5 |
|
Net income (loss) | (8,311.6 | ) | | 361.8 |
| | (1,126.6 | ) | | 1,812.6 |
| | 1,019.9 |
|
Loss (income) attributable to noncontrolling interest | 1,087.4 |
| | 51.7 |
| | 227.2 |
| | (193.5 | ) | | — |
|
Net income (loss) attributable to Cliffs shareholders | (7,224.2 | ) | | 413.5 |
| | (899.4 | ) | | 1,619.1 |
| | 1,019.9 |
|
Preferred stock dividends | (51.2 | ) | | (48.7 | ) | | — |
| | — |
| | — |
|
Income (loss) attributable to Cliffs common shareholders | $ | (7,275.4 | ) | | $ | 364.8 |
| | $ | (899.4 | ) | | $ | 1,619.1 |
| | $ | 1,019.9 |
|
Earnings (loss) per common share attributable to | | | | | | | | | |
Cliffs shareholders - basic | | | | | | | | | |
Continuing operations | $ | (47.52 | ) | | $ | 2.39 |
| | $ | (6.57 | ) | | $ | 11.41 |
| | $ | 7.37 |
|
Discontinued operations | — |
| | 0.01 |
| | 0.25 |
| | 0.14 |
| | 0.17 |
|
Earnings (loss) per common share attributable to Cliffs shareholders - basic | $ | (47.52 | ) | | $ | 2.40 |
| | $ | (6.32 | ) | | $ | 11.55 |
| | $ | 7.54 |
|
Earnings (loss) per common share attributable to | | | | | | | | | |
Cliffs shareholders - diluted | | | | | | | | | |
Continuing operations | $ | (47.52 | ) | | $ | 2.36 |
| | $ | (6.57 | ) | | $ | 11.34 |
| | $ | 7.32 |
|
Discontinued operations | — |
| | 0.01 |
| | 0.25 |
| | 0.14 |
| | 0.17 |
|
Earnings (loss) per common share attributable to Cliffs shareholders - diluted | $ | (47.52 | ) | | $ | 2.37 |
| | $ | (6.32 | ) | | $ | 11.48 |
| | $ | 7.49 |
|
Total assets | $ | 3,164.0 |
| | $ | 13,121.9 |
| | $ | 13,574.9 |
| | $ | 14,541.7 |
| | $ | 7,778.2 |
|
Long-term debt obligations (including capital leases) | $ | 3,055.1 |
| | $ | 3,189.5 |
| | $ | 4,196.3 |
| | $ | 3,821.5 |
| | $ | 1,881.3 |
|
Net cash from operating activities | $ | 358.9 |
| | $ | 1,145.9 |
| | $ | 514.5 |
| | $ | 2,288.0 |
| | $ | 1,320.0 |
|
Distributions to preferred shareholders cash dividends (e) | | | | | | | | | |
- Per depositary share | $ | 1.75 |
| | $ | 1.66 |
| | — |
| | — |
| | — |
|
- Total | $ | 51.2 |
| | $ | 48.7 |
| | — |
| | — |
| | — |
|
Distributions to common shareholders cash dividends (a) | | | | | | | | | |
- Per share | $ | 0.60 |
| | $ | 0.60 |
| | $ | 2.16 |
| | $ | 0.84 |
| | $ | 0.51 |
|
- Total | $ | 92.5 |
| | $ | 91.9 |
| | $ | 307.2 |
| | $ | 118.9 |
| | $ | 68.9 |
|
Repurchases of common shares | — |
| | — |
| | — |
| | $ | 289.8 |
| | — |
|
Common shares outstanding - basic (millions) | | | | | | | | | |
- Average for year | 153.1 |
| | 151.7 |
| | 142.4 |
| | 140.2 |
| | 135.3 |
|
- At year-end | 153.2 |
| | 153.1 |
| | 142.5 |
| | 142.0 |
| | 135.5 |
|
| | | | | | | | |
Iron ore and coal production and sales statistics | | | |
(tons in millions - U.S. Iron Ore and North American Coal; metric tons in millions - Asia Pacific Iron Ore and Eastern Canadian Iron Ore) |
Production tonnage - U.S. Iron Ore | 29.7 |
| | 27.2 |
| | 29.5 |
| | 31.0 |
| | 28.1 |
|
- Asia Pacific Iron Ore | 11.4 |
| | 11.1 |
| | 11.3 |
| | 8.9 |
| | 9.3 |
|
- North American Coal | 7.5 |
| | 7.2 |
| | 6.4 |
| | 5.0 |
| | 3.2 |
|
- Eastern Canadian Iron Ore | 6.2 |
| | 8.7 |
| | 8.5 |
| | 6.9 |
| | 3.9 |
|
Production tonnage - (Cliffs' share) | | | | | | | | | |
- U.S. Iron Ore | 22.4 |
| | 20.3 |
| | 22.0 |
| | 23.7 |
| | 21.5 |
|
- Eastern Canadian Iron Ore | 6.2 |
| | 8.7 |
| | 8.5 |
| | 6.9 |
| | 3.9 |
|
Sales tonnage - U.S. Iron Ore | 21.8 |
| | 21.3 |
| | 21.6 |
| | 24.2 |
| | 23.0 |
|
- Asia Pacific Iron Ore | 11.5 |
| | 11.0 |
| | 11.7 |
| | 8.6 |
| | 9.3 |
|
- North American Coal | 7.4 |
| | 7.3 |
| | 6.5 |
| | 4.2 |
| | 3.3 |
|
- Eastern Canadian Iron Ore | 7.2 |
| | 8.6 |
| | 8.9 |
| | 7.4 |
| | 3.3 |
|
|
| | | | | | | | | | | | | | | | | | | | | | | |
* On July 10, 2012, we entered into a definitive share and asset sale agreement to sell our 45 percent economic interest in the Sonoma joint venture coal mine located in Queensland, Australia. Additionally, on September 27, 2011, we announced our plans to cease and dispose of the operations at the renewaFUEL biomass production facility in Michigan. On January 4, 2012, we entered into an agreement to sell the renewaFUEL assets to RNFL Acquisition LLC. The results of operations of the Sonoma joint venture and renewaFUEL operations are reflected as discontinued operations in the accompanying consolidated financial statements for all periods presented. |
(a) On May 11, 2010, our Board of Directors increased our quarterly common share dividend from $0.0875 to $0.14 per share. The increased cash dividend was paid on June 1, 2010, September 1, 2010 and December 1, 2010 to shareholders on record as of May 14, 2010, August 13, 2010 and November 19, 2010, respectively. In addition, the increased cash dividend was paid on March 1, 2011 and June 1, 2011 to shareholders on record as of February 15, 2011 and April 29, 2011, respectively. On July 12, 2011, our Board of Directors increased the quarterly common share dividend by 100 percent to $0.28 per share. The increased cash dividend was paid on September 1, 2011, December 1, 2011 and March 1, 2012 to our shareholders on record as of the close of business on August 15, 2011, November 18, 2011 and February 15, 2012, respectively. On March 13, 2012, our Board of Directors increased the quarterly common share dividend by 123 percent to $0.625 per share. The increased cash dividend was paid on June 1, 2012, August 31, 2012 and December 3, 2012 to our shareholders on record as of April 27, 2012, August 15, 2012 and November 23, 2012, respectively. On February 11, 2013, our Board of Directors approved a reduction to our quarterly cash dividend rate by 76 percent to $0.15 per share. The decreased dividend of $0.15 per share was paid on March 1, 2013, June 3, 2013, September 3, 2013 and December 2, 2013 to our common shareholders of record as of the close of business on February 22, 2013, May 17, 2013, August 15, 2013 and November 22, 2013, respectively. Additionally, in 2014, the dividend of $0.15 per share was paid on March 3, 2014, June 3, 2014, September 2, 2014 and December 1, 2014 to our common shareholders of record as of the close of business on February 21, 2014, May 23, 2014, August 15, 2014 and November 15, 2014, respectively. |
(b) On January 27, 2010, we acquired all of the remaining outstanding shares of Freewest, including its interest in the Ring of Fire properties in Northern Ontario Canada. On February 1, 2010, we acquired entities from our former partners that held their respective interests in Wabush, thereby increasing our ownership interest from 26.8 percent to 100 percent. On July 30, 2010, we acquired all of the coal operations of privately owned INR, and since that date, the operations acquired from INR have been conducted through our wholly owned subsidiary known as CLCC. Results for 2010 include Freewest's, Wabush's and CLCC's results since the respective acquisition dates. As a result of acquiring the remaining ownership interest in Freewest and Wabush, our 2010 results were impacted by realized gains of $38.6 million primarily related to the increase in fair value of our previous ownership interest in each investment held prior to the business acquisition. In December 2010, we completed a legal entity restructuring that resulted in a change to deferred tax liabilities of $78.0 million on certain foreign investments to a deferred tax asset of $9.4 million for tax basis in excess of book basis on foreign investments as of December 31, 2010. A valuation allowance of $9.4 million was recorded against this asset due to the uncertainty of realization. The deferred tax changes were recognized as a reduction to our income tax provision in 2010. |
(c) On May 12, 2011, we completed our acquisition of Consolidated Thompson by acquiring all of the outstanding common shares of Consolidated Thompson for C$17.25 per share in an all-cash transaction including total debt less cash. Results for 2011 include the results for Consolidated Thompson since the acquisition date. In 2011, during our annual goodwill impairment test in the fourth quarter, a goodwill impairment charge of $27.8 million was recorded for our CLCC reporting unit, within the North American Coal operating segment, impacting Other operating expense. |
(d) Upon performing our annual goodwill impairment test in the fourth quarter of 2012, goodwill impairment charges of $997.3 million and $2.7 million were recorded for our CQIM and Wabush reporting units, respectively, both within the Eastern Canadian Iron Ore operating segment. We also recorded an impairment charge of $49.9 million related to our Eastern Canadian Iron Ore operations to reduce those assets to their estimated fair value as of December 31, 2012 due to the idling of the pelletizing facility at Pointe Noire. All of these charges impacted Other operating expense. As a result of the approval for the sale of our 30 percent interest in Amapá, an impairment charge of $365.4 million was recorded through Equity income (loss) from ventures for the year ended December 31, 2012. |
(e) On March 20, 2013, our Board of Directors declared a cash dividend of $13.6111 per preferred share, which is equivalent to approximately $0.34 per depositary share. The cash dividend was paid on May 1, 2013 to our preferred shareholders of record as of the close of business on April 15, 2013. On May 7, 2013, September 9, 2013, and November 11, 2013, our Board of Directors declared a quarterly cash dividend of $17.50 per preferred share, which is equivalent to approximately $0.44 per depositary share. The cash dividends were paid on August 1, 2013, November 1, 2013, and February 3, 2014 to our preferred shareholders of record as of the close of business on July 15, 2013, October 15, 2013, and January 15, 2014, respectively. The cash dividend was paid on May 1, 2013 to our preferred shareholders of record as of the close of business on April 15, 2013. On February 11, 2014, May 13, 2014, and September 8, 2014, our Board of Directors declared a quarterly cash dividend of $17.50 per preferred share, which is equivalent to approximately $0.44 per depositary share. The cash dividends were paid on May 1, 2014, August 1, 2014 and November 3, 2014, to our preferred shareholders of record as of the close of business on April 15, 2014, July 15, 2014, and October 15, 2014, respectively. On November 19, 2014, our Board of Directors declared a quarterly cash dividend of $17.50 per preferred share, which is equivalent to approximately $0.44 per depositary share. The cash dividend of $12.8 million will be paid on February 2, 2015 to our preferred shareholders of record as of the close of business on January 15, 2015. |
(f) Upon performing our annual goodwill impairment test in the fourth quarter of 2013, a goodwill impairment charge of $80.9 million was recorded for our Cliffs Chromite Ontario and Cliffs Chromite Far North reporting units within our Ferroalloys operating segment. We also recorded other long-lived asset impairment charges of $169.9 million, of which $154.6 million relates to our Wabush reporting unit within our Eastern Canadian Iron Ore operating segment to reduce those assets to their estimated fair value as of December 31, 2013. All of these charges impacted Other operating expense. |
(g) During 2014, we recorded an impairment of goodwill and other long-lived assets of $73.5 million and $8,956.4 million, respectively. The goodwill impairment charge of $73.5 million related to our Asia Pacific Iron Ore reporting unit. The other long-lived asset impairment charges of $8,956.4 million related to our Wabush operation and Bloom Lake operation within our Eastern Canadian Iron Ore operating segment, our Asia Pacific Iron Ore operating segment and our CLCC thermal operation, Oak Grove operation and Pinnacle operation within our North American Coal operating segment, along with impairments charged to reporting units within our Other reportable segments. The impairment charges were primarily a result of changes in life-of-mine cash flows due to declining pricing for both global iron ore and low-volatile metallurgical coal, which impacts our estimate of long-term pricing, along with changes in strategic focus including exploratory phases of possible divestiture of the operations as the new Chief Operating Decision Maker views Eastern Canadian Iron Ore, Asia Pacific Iron Ore, North American Coal and Ferroalloys as non-core assets. The CLCC assets were sold in the fourth quarter of 2014 on December 31, 2014, resulting in a loss on sale of $419.6 million. |
|
| |
Item 7. | Management's Discussion and Analysis of Financial Condition and Results of Operations |
Management's Discussion and Analysis of Financial Condition and Results of Operations ("MD&A") is designed to provide a reader of our financial statements with a narrative from the perspective of management on our financial condition, results of operations, liquidity and other factors that may affect our future results. The following discussion should be read in conjunction with the Consolidated Financial Statements and related notes that appear elsewhere in this document.
Industry Overview
The key driver of our business is demand for steelmaking raw materials from U.S. steelmakers. In 2014, the U.S. produced approximately 88 million metric tons of crude steel, making the U.S. the third largest producer in the world after China and Japan. This represents an approximate 2 percent increase in U.S. crude steel production when compared to 2013. U.S. total steel capacity utilization was approximately 77 percent in 2014 and 2013. Additionally, in 2014, China produced approximately 823 million metric tons of crude steel, or approximately 50 percent of total global crude steel production. These figures represent an approximate 1 percent increase in Chinese crude steel production when compared to 2013. Average global total steel capacity utilization was about 77 percent in 2014, an approximate 2 percent decrease from 2013. Throughout 2014, global crude steel production grew about 1 percent compared to 2013.
We expect economic growth in the U.S. to continue in 2015, and correspondingly expect steel demand to remain at healthy levels. While the industry demand will be supported by an improving housing market and a strengthened automotive sector, demand from energy companies is expected to decrease as oil prices remain at depressed levels. Additionally, the steel industry should face continued pressure from surging imports, which reached record levels in 2014, as the strength of the U.S. dollar continues to increase and continued oversupply of the global steel industry. In China, demand for steel should increase slightly compared to 2014, although at a rate far below growth percentages recorded earlier in the decade. In 2014, the increase in seaborne supply of iron ore was expected by many, but the slowdown in demand from Chinese end markets was unexpected and negatively impacted spot prices for iron ore. We expect seaborne iron ore prices to remain pressured unless there are vast structural changes to the supply/demand picture, including increased Chinese demand or iron ore capacity cuts.
The global price of iron ore is influenced significantly by the worldwide supply of iron ore and by Chinese demand. The global supply of iron ore continues to increase, which has put downward pressure on current spot pricing. However, the impact of this volatility on our U.S. Iron Ore revenues is dampened because the pricing in our long-term contracts are mostly structured to minimize the short-term impact of the fluctuations in the seaborne iron ore price.
As a result of the long-term contracts, as discussed above, our U.S. Iron Ore revenues only experienced realized revenue rate decreases of 12 percent and 9 percent for the three months and year ended December 31, 2014, respectively, when compared to the comparable prior year periods versus the much higher decrease in Platts 62 percent Fe fines spot price. The Platts 62 percent Fe fines spot price decreased 45 percent to an average price of $74 per ton for the three months ended December 31, 2014 compared to the respective quarter of 2013. In comparison, the year to date Platts 62 percent Fe fines spot pricing also has decreased 29 percent to an average price of $97 per ton during the year ended December 31, 2014. These large decreases in Platts 62 percent Fe fines spot price were driven by insufficient growth in Chinese demand to absorb the additional seaborne supply. The spot price volatility impacts our realized revenue rates, particularly in our Asia Pacific Iron Ore and Eastern Canadian Iron Ore business segments because their contracts correlate heavily to world market spot pricing.
The metallurgical coal market continues to be in an oversupplied position due to increased supply from Australian producers. Those producers, benefiting from a devaluated local currency, are very competitive in European and South American markets. Recent reductions in global coal supply have yet to make an impact on pricing.
Consistent with the above, the quarterly benchmark price for premium low-volatile hard coking coal between Australian metallurgical coal suppliers and Japanese and Korean consumers decreased 21 percent to a full-year average of $126 per metric ton in 2014 versus the 2013 full-year average of $159 per metric ton. The benchmark pricing has remained relatively flat from the second quarter of 2014 to the fourth quarter of 2014 at approximately $120 per metric ton.
Our consolidated revenues for the years ended December 31, 2014 and 2013 were $4.6 billion and $5.7 billion, respectively, with net loss from continuing operations per diluted share of $47.52 and net income from continuing operations per diluted share of $2.36, respectively. Net income in 2014 was impacted primarily by $9.0 billion of long-lived asset impairment recorded in the second half of 2014 along with $73.5 million of goodwill impairment recorded in the third quarter of 2014. Also, net income in 2014 was impacted by lower market pricing for our products, which decreased
product revenues by $1.0 billion for the year ended December 31, 2014 when compared to 2013. Results for the year were also impacted by the $419.6 million loss on the sale of our CLCC assets in 2014. The CLCC assets were sold on December 31, 2014. Additionally, results for the year ended December 31, 2014 were impacted negatively by $96.3 million related to a litigation judgment against the Bloom Lake Group, $92.6 million of minimum shipment penalties and $90.7 million of Wabush idle costs. Net income in 2013 was impacted negatively by $154.6 million of other long-lived asset impairment charges related to our Wabush operations within our Eastern Canadian Iron Ore operating segment, an $80.9 million goodwill impairment charge related to our Cliffs Chromite Ontario and Cliffs Chromite Far North reporting units within our Ferroalloys operating segment and reported in our Other reportable segments and a $67.6 million asset impairment charge related to our investment in Amapá. This was offset by lower exploration spending in 2013, primarily related to the Chromite project.
Strategy
Re-focusing the Company on our Core U.S. Iron Ore Business
We have shifted from a diversification based strategy to one that focuses on strengthening our U.S. Iron Ore operations. We are the market-leading iron ore producer in the U.S., supplying differentiated iron ore pellets under long-term contracts, some of which begin to expire in the end of 2016, to the largest U.S. steel producers. Pricing protections and long-term supply, certainty provided by our existing contracts and our low-cost operating profile positions U.S. Iron Ore as our most stable and profitable business. We expect to continue to strengthen U.S. Iron Ore cost operating profile through our operational expertise and disciplined capital allocation policies.
Reviewing All Other Businesses for Either Optimization, Divestiture or Shutdown
As an extension of our re-focused U.S. Iron Ore strategy, we continue to consider further divestitures of Eastern Canadian Iron Ore, Asia Pacific Iron Ore and North American Coal businesses. We believe the assets from these non-core segments have value and will only consummate a transaction where we believe the price fairly and adequately represents such value. For more information regarding the status of our divestiture of our Eastern Canadian Iron Ore business, see "Recent Developments" below.
Asia Pacific Iron Ore is a well-recognized and reliable supplier to steelmakers in Asia. To date, Asia Pacific Iron Ore has been a steady cash flow contributor, benefiting from a premium price for its high lump iron ore mix and minimal required capital expenditures to maintain production. We look to operate our North American Coal business at breakeven levels of EBITDA generation in 2015 given the current environment for high quality metallurgical coal. We are focused on limiting capital expenditures while continuing to meet environmental, safety and permission to operate requirements.
Maintaining Discipline on Costs and Capital Spending and Improving our Financial Flexibility
We believe our ability to execute our strategy is dependent on our financial position, balance sheet strength and financial flexibility to manage through volatility in commodity prices. We have developed a highly disciplined financial and capital expenditure plan with a focus on improving our cost profile and increasing long-term profitability. We are focused on sizing our organization to better fit our new strategic direction and streamlining our businesses’ support functions by eliminating duplication. Our capital allocation plan is focused on strengthening our core U.S. Iron Ore operations to promote greater free cash flow generation.
Competitive Strengths
Highly Stable and Resilient U.S. Iron Ore Operations
Our U.S. Iron Ore segment is the core focus of our business strategy. The U.S. Iron Ore segment is the primary contributor to our consolidated results, generating 54 percent and 89 percent of consolidated revenue and Adjusted EBITDA, respectively, for the year ended December 31, 2014. U.S. Iron Ore produces differentiated iron ore pellets that are customized for use in customers’ blast furnaces as part of the steelmaking process. The grades of pellets currently delivered to each customer are based on that customer’s preferences, which depend in part on the characteristics of the customer’s blast furnace operation. We believe our long history of supplying customized pellets to the U.S. steel producers has resulted in a co-dependency between us and our customers. This co-dependency has positioned Cliffs to claim a substantial portion of the total U.S. iron ore market. Based on Cliffs’ equity ownership in its U.S. mines, Cliffs’ share of the annual rated production capacity is 25.5 million tons, representing 44 percent of total U.S. annual pellet capacity. Long-lived assets with an average mine life of approximately 30 years provide the opportunity to maintain our significant market position well into the future.
We believe U.S. Iron Ore is uniquely positioned in the global iron ore market due to its reduced exposure to seaborne iron ore pricing. More than half of U.S. Iron Ore production is sold through stable long-term contracts that are
structured with formula-based pricing that mitigates the impact of seaborne price volatility on our business. Additionally, certain of our supply agreements have a provision that limits the amount of price increases or decreases in any given year. The impact of the pricing protections from our contracts is clearly evidenced in our U.S. Iron Ore financial performance. U.S. Iron Ore’s realized revenue rate decreased 12 percent and 9 percent for the three months and year ended December 31, 2014, respectively, compared to a 45 percent and 29 percent decline in the Platts 62 percent Fe fines spot price over the same periods.
In addition, we maintain materially lower costs compared to our competition as a result of our proximity to U.S. steelmaking operations. Our costs are lower as a result of inherent transportation advantages associated with our mine locations near the Great Lakes which allows for transportation via railroads and loading ports. U.S. Iron Ore mines also benefit from on-site pellet production and ore production facilities located a short distance from the mines. These advantages translated to a cash production costs in the three months and year ended December 31, 2014 of $59 per ton and $64 per ton, respectively, which included the cost to mine, concentrate and pelletize, certain transportation costs and site administration costs.
Competitive Asia Pacific Iron Ore Operations
Although our annual production tonnage is substantially less than our competitors in the seaborne market, the Asia Pacific Iron Ore business maintains a competitive position with the major Australian iron ore producers. We produce a product mix of approximately 52 percent lump ore and 48 percent fines, which is a significantly higher lump mix than the major producers in Australia. This lump ore currently commands a premium in the seaborne market over iron ore fines.
Further, our Asia Pacific Iron Ore segment is a cost competitive producer and requires modest ongoing sustaining capital expenditures to continue our operations. Cash production costs during the three months and year ended December 31, 2014, were $43 per ton and $49 per ton, respectively. Over the remaining life of the mine, the capital expenditure requirements are estimated to be approximately $50 million or $1 per ton.
Recent Developments
Eastern Canadian Iron Ore
Our Wabush Scully mine in Newfoundland and Labrador was idled by the end of the first quarter of 2014 and subsequently began to commence permanent closure in the fourth quarter of 2014. With costs unsustainably high, it was not economically viable to continue running this operation. Approximately 500 employees at both the Wabush Scully mine and the Pointe Noire rail and port operation in Québec were impacted by these actions.
On November 19, 2014, we announced that we were pursuing exit options for our Eastern Canadian Iron Ore operations.
During the fourth quarter of 2014, we disclosed that, despite our cost-cutting progress at our Bloom Lake mine, we concluded that Phase I alone was not economically feasible based on our current operating plans. For the Bloom Lake mine to be profitable, we concluded that Phase II of the Bloom Lake mine must be developed to reduce the overall cash cost of operations. We could only develop Phase II of the Bloom Lake mine if we had been able to secure new equity partners to share in the capital costs, which we estimated to be approximately $1.2 billion. As the new equity partners were unable to commit within the short timeframe we required, we determined that the Phase II expansion of the Bloom Lake mine was no longer a viable option for us and we shifted our focus to considering available possibilities and executing an exit option for Eastern Canadian Iron Ore operations that minimized the cash outflows and associated liabilities. In December 2014, iron ore production at the Bloom Lake mine was suspended and the Bloom Lake mine was placed in ‘‘care-and-maintenance’’ mode.
On January 27, 2015, we announced that the Bloom Lake Group commenced restructuring proceedings in Montreal, Québec, under the CCAA. The Bloom Lake Group had recently suspended operations and for several months we were exploring options to sell certain of our Canadian assets, among other initiatives. The decision to seek protection under the CCAA was based on a thorough legal and financial analysis of the options available to the Bloom Lake Group. The Bloom Lake Group was no longer generating any revenues and was not able to meet its obligations as they came due. The initial CCAA order addressed the Bloom Lake Group's immediate liquidity issues and permits the Bloom Lake Group to preserve and protect its assets for the benefit of all stakeholders while restructuring and sale options are explored. As part of the CCAA process, the Court has appointed FTI Consulting Canada Inc. as the Monitor. The Monitor's role in the CCAA process is to monitor the activities of the Bloom Lake Group and provide assistance to the Bloom Lake Group and its stakeholders in respect of the CCAA process.
Worldlink Arbitration
In October 2011, our wholly owned subsidiary, CQIM, along with Bloom Lake General Partner Limited and The Bloom Lake Iron Ore Mine Limited Partnership, instituted an arbitration claim against the Bloom Lake mine’s former customer, Worldlink Resources Limited, for material and/or fundamental breaches of the parties’ 2007 offtake agreement for the purchase and sale of iron concentrate produced at the Bloom Lake mine. Our subsidiaries filed the arbitration claim with the International Court of Arbitration of the International Chamber of Commerce pursuant to the dispute resolution provisions of the offtake agreement. Our subsidiaries terminated the offtake agreement with Worldlink in August 2011 due to Worldlink’s failure to fulfill its obligations under the agreement and Worldlink’s demand to renegotiate the price of the iron ore concentrate in spite of being party to a long-term offtake agreement. Our subsidiaries claimed damages for the breach of the offtake agreement in excess of $85 million, and Worldlink counterclaimed for damages in excess of $100 million. In November 2014, the arbitrators decided in favor of Worldlink and awarded it damages in an amount of approximately $71 million as well as approximately $25 million in accrued interest from the date of termination of the offtake agreement in August 2011 and arbitration costs. This judgment has been included in the CCAA filing of the Bloom Lake and will be treated as an unsecured claim.
CLCC
On December 2, 2014, we entered into a definitive agreement to sell our CLCC assets in southern West Virginia to Coronado Coal II, LLC for $174 million in cash as well as the assumption of certain liabilities, of which $155 million has been collected as of December 31, 2014. The sale closed on December 31, 2014.
The CLCC assets, which we acquired in 2010, included two underground high-volatile metallurgical coal mines, Powellton No. 1 and Lower War Eagle, and the Toney Fork No. 2 surface thermal coal mine. The facilities included a coal preparation and processing plant and a train batch-weight load-out facility with access to rail. In 2014, the CLCC operations produced 1.5 million tons of metallurgical coal out of the 6.6 million total tons of metallurgical coal North American Coal produced for us, and the CLCC operations also produced 0.9 million tons of thermal coal. In 2013, the CLCC operations produced 1.5 million tons of metallurgical coal out of the 6.6 million total tons of the metallurgical coal North American Coal produced for us, and the CLCC operations also produced 0.6 million tons of thermal coal.
We recorded a loss on the sale of CLCC assets of approximately $419.6 million on a pre-tax basis in the fourth quarter of 2014.
Share Buyback
On August 25, 2014, the Board of Directors authorized us to buy back our outstanding common shares in the open market or in private negotiated transactions up to a maximum of $200 million. At that time, we obtained approval from our bank group to ensure the buyback program could be effectively implemented in a timely manner. The Company is not obligated to make any purchases under the buyback program and it may be suspended or discontinued by the Company at any time. No shares have been purchased through December 31, 2014. The authorization is active until December 31, 2015.
Credit Facility Amendments
On October 24, 2014, we entered into an agreement to amend our existing revolving credit agreement (Amendment No. 5). The amended terms remove the current maximum balance sheet leverage ratio of debt to capitalization of less than 45 percent, which was a covenant introduced in June 2014, and replaced that covenant with a maximum leverage ratio covenant of secured debt to EBITDA that is not to exceed 3.5 times. The minimum interest coverage ratio requirement of 3.5 times was subsequently reduced to 2.0 times upon completion of certain collateral actions within 60 days of the execution of the amendment. The collateral requirements were satisfied as of December 23, 2014. The amendment also reduced the size of the existing facility from $1.250 billion to $1.125 billion and included a security agreement.
On January 22, 2015, we entered into an agreement to further amend our existing revolving credit agreement (Amendment No. 6). The further amended terms waived the event of default related to a CCAA filing for Canadian entities. The CCAA filing for our Bloom Lake Group was made subsequent to the effectiveness of this amendment. The amendment also reduced the size of the existing facility from $1.125 billion to $900 million, with a further reduction to $750 million on May 31, 2015.
Each of these amendments to our credit agreement facilitate financial flexibility for us to execute our strategy and provide us a consistent source of liquidity. Refer to NOTE 5 - DEBT AND CREDIT FACILITIES and NOTE 21 - SUBSEQUENT EVENTS for further details of the amendments.
Debt
During the fourth quarter, we announced a tender offer to purchase our public debt at discounts, as well as a new secured notes offering, driven by our desire to pay down debt. However, the tender offers were terminated because our debt refinancing was postponed due to perceived adverse market conditions. After the postponement, we used our liquidity to execute the repurchase of our senior notes in the open market. During the fourth quarter 2014, we were able to pay down $300 million in aggregate principal in total debt less cash. By the end of the year, we had total debt less cash of $2.7 billion, with total debt of $3.0 billion, zero drawn on our revolving credit facility, and $291.0 million of cash and cash equivalents. In January 2015, we further reduced total debt by approximately $159 million through senior note repurchases in the open market with approximately $106 million of net proceeds from the sale of CLCC and cash from operations.
Business Segments
Our Company’s operations are organized and managed according to product category and geographic location: U.S. Iron Ore, Asia Pacific Iron Ore, North American Coal and Eastern Canadian Iron Ore.
Results of Operations – Consolidated
2014 Compared to 2013
The following is a summary of our consolidated results of operations for the years ended December 31, 2014 and 2013:
|
| | | | | | | | | | | |
| (In Millions) |
| 2014 | | 2013 | | Variance Favorable/ (Unfavorable) |
Revenues from product sales and services | $ | 4,623.7 |
| | $ | 5,691.4 |
| | $ | (1,067.7 | ) |
Cost of goods sold and operating expenses | (4,172.3 | ) | | (4,542.1 | ) | | 369.8 |
|
Sales margin | $ | 451.4 |
| | $ | 1,149.3 |
| | $ | (697.9 | ) |
Sales margin % | 9.8 | % | | 20.2 | % | | (10.4 | )% |
Revenues from Product Sales and Services
Sales revenue for the year ended December 31, 2014 decreased $1,067.7 million, or 18.8 percent, from 2013. The decrease in sales revenue during 2014 compared to 2013 was primarily attributable to the decrease in market pricing for our products, which impacted revenues by $1.0 billion for the year ended December 31, 2014.
Changes in world market pricing impacts our revenues each year. During 2014, iron ore revenues were impacted primarily by the decrease in the Platts 62 percent Fe fines spot price, which declined 28.5 percent to an average price of $97 per ton, resulting in decreased revenues of $830.8 million, excluding the impact of Wabush tons sold. The decrease in our realized revenue rates during 2014 compared to 2013 was 9.5 percent, 32.8 percent and 26.7 percent for our U.S. Iron Ore, Asia Pacific Iron Ore and Eastern Canadian Iron Ore operations, respectively. Also, the decision to idle Wabush impacted the period-over-period revenues negatively by $288.0 million. Furthermore, during 2014, our North American Coal business segment experienced continued downward pricing pressures, which negatively impacted revenues by $176.8 million and decreased our realized revenue rate by 23.6 percent. Partially offsetting these decreases was an increase in revenues period-over-period as a result of higher iron ore and coal sales volumes of $183.5 million for the year ended December 31, 2014.
Refer to “Results of Operations – Segment Information" for additional information regarding the specific factors that impacted revenue during the period.
Cost of Goods Sold and Operating Expenses
Cost of goods sold and operating expenses for the years ended December 31, 2014 and 2013 were $4,172.3 million and $4,542.1 million, respectively, a decrease of $369.8 million, or 8.1 percent year-over-year.
Cost of goods sold and operating expenses for the year ended December 31, 2014 decreased as costs were impacted positively as a result of the Wabush idle that occurred during the second quarter of 2014, which reduced costs by $304.4 million period-over-period. Operational efficiencies and cost cutting efforts across all of our business units have reduced costs for the year ended December 31, 2014 by $217.0 million. Also, as a result of favorable foreign exchange rates in 2014 versus 2013, we realized lower costs of $93.8 million. Partially offsetting these decreases were an increase in costs period-over-period as a result of higher iron ore and coal sales volumes of $141.6 million for the year ended December 31, 2014. Additionally, we incurred incrementally higher lower-of-cost-or-market inventory charges of $56.8 million for the year ended December 31, 2014, as a result of the continued downward pricing pressure.
Refer to “Results of Operations – Segment Information” for additional information regarding the specific factors that impacted our operating results during the period.
Other Operating Income (Expense)
The following is a summary of other operating income (expense) for the years ended December 31, 2014 and 2013:
|
| | | | | | | | | | | |
| (In Millions) |
| 2014 | | 2013 | | Variance Favorable/ (Unfavorable) |
Selling, general and administrative expenses | $ | (208.7 | ) | | $ | (231.6 | ) | | $ | 22.9 |
|
Exploration costs | (8.8 | ) | | (59.0 | ) | | 50.2 |
|
Impairment of goodwill and other long-lived assets | (9,029.9 | ) | | (250.8 | ) | | (8,779.1 | ) |
Gain (loss) on disposal of assets | (423.0 | ) | | 16.7 |
| | (439.7 | ) |
Miscellaneous - net | (226.3 | ) | | 46.4 |
| | (272.7 | ) |
| $ | (9,896.7 | ) | | $ | (478.3 | ) | | $ | (9,418.4 | ) |
Selling, general and administrative expenses during the year ended December 31, 2014 decreased $22.9 million over 2013. The year ended December 31, 2014 was favorably impacted by $37.2 million for employment costs related to cost savings actions and reduced year-over-year expense of $10.5 million related to pension and other postemployment benefits. Offsetting these cost reductions was an increase in costs related to the proxy contest and the change in control of the majority of our Board of Directors. We incurred substantial costs associated with various advisors, including bankers, attorneys and others. Costs associated with these events were approximately $26.6 million for the year ended December 31, 2014.
Exploration costs decreased by $50.2 million during the year ended December 31, 2014 from 2013, primarily due to decreases in costs at our Ferroalloys operations and Global Exploration Group operations. Ferroalloys and the Global Exploration Group are reported within our Other reportable segments. Our Ferroalloys operating segment had cost decreases of $38.8 million in 2014 over 2013 due to the decision made in the fourth quarter of 2013 to indefinitely suspend the Chromite Project and to not allocate additional capital for the project given the uncertain timeline and risks associated with the development of necessary infrastructure to bring the project online. Our Global Exploration Group had cost decreases of $8.0 million in 2014 over 2013, due to lower overhead and professional services spend. In alignment with our capital allocation strategy, we anticipate minimal levels of exploration spending to continue in 2015 and beyond.
Impairment of goodwill and other long-lived assets were $9,029.9 million and $250.8 million during the years ended December 31, 2014 and 2013, respectively. During the year ended December 31, 2014, we recorded goodwill impairment of $73.5 million related to our Asia Pacific Iron Ore reporting unit. We also recorded other long-lived asset impairment charges of $8,956.4 million during 2014. The charges are related to our Wabush mine and Bloom Lake mine within our Eastern Canadian Iron Ore operating segment, our Asia Pacific Iron Ore operating segment and our CLCC thermal operation, which was sold during the fourth quarter of 2014, Oak Grove operation and Pinnacle operation within our North American Coal operating segment, along with impairments charged to reporting units within our Other reportable segments. The impairment charges were primarily a result of management determining that the carrying value of the asset groups may not be recoverable primarily due to long-term price forecasts as part of management’s long-range planning process. Updated estimates of long-term prices for all products, specifically the Platts 62 percent Fe fines spot price, which particularly effects Eastern Canadian Iron Ore and Asia Pacific Iron Ore business segments because their contracts correlate heavily to world market spot pricing, and the benchmark price for premium low-volatile hard coking coal were lower than prior estimates. These estimates were updated based upon current market conditions, macro-
economic factors influencing the balance of supply and demand for our products and expectations for future cost and capital expenditure requirements. Additionally, a new CEO, Lourenco Goncalves, was appointed by the Board of Directors in early August 2014 and subsequently identified as the CODM in accordance with ASC 280, Segment Reporting. The new CODM views Eastern Canadian Iron Ore, Asia Pacific Iron Ore, North American Coal and Ferroalloys as non-core assets and has communicated plans to evaluate the business units for a change in strategy including possible divestiture. These factors, among other considerations utilized in the individual impairment assessments, indicate that the carrying value of the respective asset groups and Asia Pacific Iron Ore goodwill may not be recoverable. Refer to NOTE 6 - FAIR VALUE OF FINANCIAL INSTRUMENTS for further information.
During the fourth quarter of 2013, we continued to experience higher than expected production costs and operational inefficiencies at our Wabush operations within our Eastern Canadian Iron Ore operating segment that have resulted in continued declines in our profitability of that business, which represents an asset group for purposes of testing our long-lived assets for recoverability. Driven by the unsustainable high cost structure, which was not economically viable to continue running the operations, we announced on February 11, 2014, the decision to idle the production of our Wabush Scully mine by the end of the first quarter and began to implement the permanent closure plan for the mine. Upon completion of an impairment analysis, it was determined the fair value was less than the carrying value of the asset group, which resulted in an impairment of other long-lived assets of $154.6 million at December 31, 2013.
Additionally during the fourth quarter of 2013, a goodwill impairment charge of $80.9 million was recorded for our Cliffs Chromite Ontario and Cliffs Chromite Far North reporting units within our Ferroalloys operating segment. Ferroalloys and the Global Exploration Group are reported within our Other reportable segments. The goodwill impairment charge was primarily a result of the decision to indefinitely suspend the Chromite Project and to not allocate additional capital for the project given the uncertain timeline and risks associated with the development of necessary infrastructure to bring the project online.
Net loss on disposal of assets was $423.0 million during the year ended December 31, 2014, compared to a net gain on disposal of assets of $16.7 million in 2013. The net loss on disposal of assets for 2014 was primarily attributable to the loss of $419.6 million incurred on the sale of our CLCC assets.
The following is a summary of Miscellaneous - net for the year ended December 31, 2014 and 2013:
|
| | | | | | | | | | | |
| (In Millions) |
| 2014 | | 2013 | | Variance
Favorable/
(Unfavorable) |
Foreign exchange remeasurement | $ | 30.7 |
| | $ | 64.0 |
| | $ | (33.3 | ) |
Litigation judgment | (96.3 | ) | | — |
| | $ | (96.3 | ) |
Minimum shipment penalties | (92.6 | ) | | (37.3 | ) | | (55.3 | ) |
Wabush idle costs | (90.7 | ) | | (7.4 | ) | | (83.3 | ) |
Other | 22.6 |
| | 27.1 |
| | (4.5 | ) |
| $ | (226.3 | ) | | $ | 46.4 |
| | $ | (272.7 | ) |
Miscellaneous – net expense was unfavorable by $272.7 million during the year ended December 31, 2014 in comparison to 2013. The year ended December 31, 2014 was impacted negatively by $83.3 million as a result of our first quarter 2014 decision to idle and subsequently close the Wabush mine. These costs include idling and closure costs, employment-related expenditures and contract costs. During the year ended December 31, 2014, we incurred costs of $96.3 million related to an unfavorable litigation judgment in the Worldlink arbitration and $92.6 million for failure to meet minimum monthly shipment requirements. We recorded $36.4 million during the third quarter of 2014 related to minimum shipment penalties associated with the cancellation of the Wabush mine rail contract. The remaining increase in minimum shipment penalties were a result of the continued delay in the Bloom Lake Phase II expansion and idling of the Bloom Lake operations and subsequent transition to "care-and-maintenance" mode. The contract containing the minimum shipment penalties associated with the Bloom Lake mine has been included in the CCAA filing and will be treated as an unsecured claim. Additionally, for the year ended December 31, 2014, there was an unfavorable incremental impact of $33.3 million due to the change in foreign exchange re-measurement on short-term intercompany notes, Australian bank accounts that are denominated in U.S. dollars and certain monetary financial assets and liabilities, which are denominated in something other than the functional currency of the entity.
Other Income (Expense)
The following is a summary of other income (expense) for the years ended December 31, 2014 and 2013:
|
| | | | | | | | | | | |
| (In Millions) |
| 2014 | | 2013 | | Variance Favorable/ (Unfavorable) |
Interest expense, net | (185.2 | ) | | (179.1 | ) | | (6.1 | ) |
Other non-operating income (expense) | 26.8 |
| | (2.6 | ) | | 29.4 |
|
| $ | (158.4 | ) | | $ | (181.7 | ) | | $ | 23.3 |
|
The increase in interest expense in 2014 compared to 2013 was attributable primarily to the change in borrowing capacity of our revolving credit facility which resulted in $3.7 million of unamortized debt issuance costs being expensed as of the effective date of the amendment. Refer to NOTE 5 - DEBT AND CREDIT FACILITIES for further information.
Other non-operating income increased by $29.4 million during the year ended December 31, 2014 in comparison to 2013. The increase in other non-operating income was mainly due to our repurchase of debt in the fourth quarter of 2014 that resulted in a $16.2 million gain on extinguishment of debt. Additionally, other non-operating income was impacted positively in the current period by $7.8 million of income related to the sale of our remaining shares in a marketable security as a decision was made to liquidate the asset in 2014.
Income Taxes
Our tax rate is affected by permanent items, such as depletion and the relative amount of income we earn in various foreign jurisdictions with tax rates that differ from the U.S. statutory rate. It also is affected by discrete items that may occur in any given period, but are not consistent from period to period. The following represents a summary of our tax provision and corresponding effective rates for the years ended December 31, 2014 and 2013:
|
| | | | | | | | | | | |
| (In Millions) |
| 2014 | | 2013 | | Variance |
Income tax benefit (expense) | $ | 1,302.0 |
| | $ | (55.1 | ) | | $ | 1,357.1 |
|
Effective tax rate | 13.6 | % | | 11.3 | % | | 2.3 | % |
A reconciliation of our income tax attributable to continuing operations computed at the U.S. federal statutory rate for the years ended December 31, 2014 and 2013 is as follows:
|
| | | | | | | | | | | | | |
| (In Millions) |
| 2014 | | 2013 |
Tax at U.S. statutory rate of 35 percent | $ | (3,361.3 | ) | | 35.0 | % | | $ | 171.3 |
| | 35.0 | % |
Increases/(Decreases) due to: | | | | | | | |
Foreign exchange remeasurement | (4.1 | ) | | — |
| | (2.6 | ) | | (0.5 | ) |
Non-taxable loss (income) related to noncontrolling interests | 290.1 |
| | (3.0 | ) | | (1.5 | ) | | (0.3 | ) |
Impact of tax law change | 13.0 |
| | (0.1 | ) | | — |
| | — |
|
Percentage depletion in excess of cost depletion | (87.9 | ) | | 0.9 |
| | (97.6 | ) | | (19.9 | ) |
Impact of foreign operations | 592.0 |
| | (6.2 | ) | | (10.2 | ) | | (2.1 | ) |
Income not subject to tax | (46.5 | ) | | 0.5 |
| | (106.6 | ) | | (21.8 | ) |
Goodwill impairment | 22.7 |
| | (0.2 | ) | | 20.5 |
| | 4.2 |
|
State taxes, net | (43.6 | ) | | 0.5 |
| | 5.6 |
| | 1.1 |
|
Settlement of financial guaranty | (343.3 | ) | | 3.6 |
| | — |
| | — |
|
Manufacturer's deduction | — |
| | — |
| | (7.9 | ) | | (1.6 | ) |
Valuation allowance | 1,660.6 |
| | (17.3 | ) | | 73.0 |
| | 14.9 |
|
Tax uncertainties | 0.2 |
| | — |
| | 19.6 |
| | 5.3 |
|
Prior year adjustments made in current year | (10.4 | ) | | 0.1 |
| | (11.4 | ) | | (3.6 | ) |
Other items - net | 16.5 |
| | (0.2 | ) | | 2.9 |
| | 0.6 |
|
Provision for income tax benefit and effective income tax rate including discrete items | $ | (1,302.0 | ) | | 13.6 | % | | $ | 55.1 |
| | 11.3 | % |
Our tax provision for the year ended December 31, 2014 was a benefit of $1,302.0 million and a 13.6 percent effective tax rate compared with an expense of $55.1 million and an effective tax rate of 11.3 percent for the prior-year. The change in the income tax benefit from the prior-year expense is due primarily to the impairment of global long-lived assets offset by valuation allowances on future tax benefits that management has determined are not recoverable and the settlement of a financial guaranty. The impact of foreign operations relates to losses in foreign jurisdictions where the statutory rates, ranging from 25 percent to 30 percent, differ from the U.S. statutory rate of 35 percent. Other items include non-deductible goodwill impairment as well as a decrease in the tax benefit from interest income not subject to tax.
Income not subject to tax includes the tax benefit of the non-taxable interest income that is $46.5 million for the year ended December 31, 2014. Of this, $27.8 million, relates to an intercompany note between the U.S. and Canada. This note was restructured on April 27, 2014 and will no longer result in an income tax benefit after this date. An additional, $18.7 million relates to an intercompany note which was originally between Canada and Australia, but was restructured on December 4, 2014 and is now between Luxembourg and Australia. The balance of the MRPS is $236.0 million at December 31, 2014 with an interest rate of 9.4 percent and a maturity date of December 31, 2020. The balances of the intercompany loans are not permanently invested in the subsidiaries.
See NOTE 9 - INCOME TAXES for further information.
Equity Loss from Ventures
Equity loss from ventures for the year ended December 31, 2014 of $9.9 million compares to equity loss from ventures for the year ended December 31, 2013 of $74.4 million. The equity loss from ventures for the year ended December 31, 2014 primarily is comprised of the impairment charge of $9.2 million related to a Global Exploration Group investment. The equity loss from ventures for the year ended December 31, 2013 primarily is comprised of the impairment charge of $67.6 million related to our 30 percent ownership interest in Amapá, the sale of which was approved by the Board of Directors in December 2012. The sale closed in the fourth quarter of 2013.
Noncontrolling Interest
Noncontrolling interest primarily is comprised of our consolidated, but less-than-wholly owned subsidiaries at the Bloom Lake and Empire mining operations. The net loss attributable to the noncontrolling interest related to Bloom Lake was $1,113.3 million and $66.5 million for the years ended December 31, 2014 and 2013, respectively. The net loss in 2014 was driven by other long-lived asset impairment charges recorded in the second half of 2014 for the Bloom Lake mine of $6.2 billion, of which $1.1 billion was allocated to the noncontrolling interest. This would not have impacted earnings comparably in 2013.
The net income attributable to the noncontrolling interest related to the Empire mining venture was $26.9 million and $20.7 million for the years ended December 31, 2014 and 2013, respectively.
Results of Operations – Consolidated
2013 Compared to 2012
The following is a summary of our consolidated results of operations for the years ended December 31, 2013 and 2012:
|
| | | | | | | | | | | |
| (In Millions) |
| 2013 | | 2012 | | Variance Favorable/ (Unfavorable) |
Revenues from product sales and services | $ | 5,691.4 |
| | $ | 5,872.7 |
| | $ | (181.3 | ) |
Cost of goods sold and operating expenses | (4,542.1 | ) | | (4,700.6 | ) | | 158.5 |
|
Sales margin | $ | 1,149.3 |
| | $ | 1,172.1 |
| | $ | (22.8 | ) |
Sales margin % | 20.2 | % | | 20.0 | % | | 0.2 | % |
Revenues from Product Sales and Services
Sales revenue for the year ended December 31, 2013 decreased $181.3 million, or 3.1 percent, from 2012.
The decrease in sales revenue during 2013 compared to 2012 primarily was attributable to lower worldwide iron ore sales volumes of 1.4 million tons, or $174.7 million, and lower realized revenue rates for coal products of 15.5 percent year-over-year, which resulted in a decrease of $135.1 million. These decreases were offset partially by higher North American Coal sales volumes of 762 thousand tons, or $91.1 million.
Refer to “Results of Operations – Segment Information” for additional information regarding the specific factors that impacted revenue during the period.
Cost of Goods Sold and Operating Expenses
Cost of goods sold and operating expenses for the years ended December 31, 2013 and 2012 were $4,542.1 million and $4,700.6 million, a decrease of $158.5 million, or 3.4 percent, year-over-year.
Cost of goods sold and operating expenses for the year ended December 31, 2013 decreased primarily as a result of cost rate decreases of $143.7 million and a favorable foreign exchange rate impact of $70.9 million. Cost rate decreases of $122.1 million at our North American Coal operations were driven primarily due to reduced headcount, cost savings measures and more effective operating efficiency. These cost decreases were offset partially by additional costs of $72.5 million related to supply and product inventory write-downs predominately at our Wabush mine within our Eastern Canadian Iron Ore operations during the year ended December 31, 2013.
Refer to “Results of Operations – Segment Information” for additional information regarding the specific factors that impacted our operating results during the period.
Other Operating Income (Expense)
Following is a summary of other operating income (expense) for the years ended December 31, 2013 and 2012:
|
| | | | | | | | | | | |
| (In Millions) |
| 2013 | | 2012 | | Variance Favorable/ (Unfavorable) |
Selling, general and administrative expenses | $ | (231.6 | ) | | $ | (282.5 | ) | | $ | 50.9 |
|
Exploration costs | (59.0 | ) | | (142.8 | ) | | 83.8 |
|
Impairment of goodwill and other long-lived assets | (250.8 | ) | | (1,049.9 | ) | | 799.1 |
|
Gain (loss) on disposal of assets | 16.7 |
| | 1.2 |
| | 15.5 |
|
Miscellaneous - net | 46.4 |
| | (6.9 | ) | | 53.3 |
|
| $ | (478.3 | ) | | $ | (1,480.9 | ) | | $ | 1,002.6 |
|
Selling, general and administrative expenses during the year ended December 31, 2013 decreased $50.9 million, over 2012. The year ended December 31, 2013 was impacted positively by reductions in outside service spending, general travel and employee-related expenses and technology spending of $42.7 million, $20.5 million and $7.1 million, respectively. These decreases were offset partially by $16.4 million in severance costs related to the voluntary and involuntary terminations as a result of cost savings actions for the year ended December 31, 2013 compared to 2012.
Exploration costs decreased by $83.8 million during the year ended December 31, 2013 from 2012, primarily due to decreases in spend at our Ferroalloys operations and Global Exploration Group operations. Ferroalloys and the Global Exploration Group are reported within our Other reportable segments. Our Global Exploration Group had cost decreases of $48.6 million in 2013 over 2012, due to lower drilling and professional services spend for certain projects. Our Ferroalloys operations had cost decreases of $28.8 million in 2013 over 2012. During 2012, there were increased engineering and drilling costs for external resources utilized to support the Chromite Project feasibility study.
During the fourth quarter of 2013, we continued to experience higher than expected production costs and operational inefficiencies at our Wabush operations within our Eastern Canadian Iron Ore operating segment that resulted in continued declines in our profitability of that business, which represents an asset group for purposes of testing our long-lived assets for recoverability. Driven by the unsustainable high cost structure, which was not economically viable to continue running the operations, we announced on February 11, 2014, we would idle the production of our Wabush Scully mine by the end of the first quarter. The mine was idled by the end March 2014 and in the fourth quarter of 2014 we began to implement the permanent closure plan for the mine. Upon completion of an impairment analysis, it was determined the fair value was less than the carrying value of the asset group, which resulted in an impairment of other long-lived assets of $154.6 million at December 31, 2013.
Additionally during the fourth quarter of 2013, a goodwill impairment charge of $80.9 million was recorded for our Cliffs Chromite Ontario and Cliffs Chromite Far North reporting units within our Ferroalloys operating segment. Ferroalloys is reported within our Other reportable segments. The goodwill impairment charge was primarily a result of the decision to indefinitely suspend the Chromite Project and to not allocate additional capital for the project given the uncertain timeline and risks associated with the development of necessary infrastructure to bring the project online.
During the fourth quarter of 2012, upon performing our 2012 annual goodwill impairment assessments, a goodwill impairment charge of $997.3 million was recorded for our CQIM reporting unit within the Eastern Canadian Iron Ore operating segment. The impairment charge for our CQIM reporting unit was driven by the project’s lower than anticipated long-term profitability coupled with delays in achieving full operational capacity and higher capital and operating costs. Additionally, a goodwill impairment charge of $2.7 million was recorded for our Wabush reporting unit. This charge was primarily a result of downward adjustments to our long-term pricing estimates and higher operating costs due to lower production.
Miscellaneous – net was favorable by $53.3 million during the year ended December 31, 2013 from 2012. The year ended December 31, 2013 was impacted positively as a result of incremental gains of $67.3 million due to foreign exchange re-measurement on short-term intercompany notes, Australian bank accounts that are denominated in U.S. dollars and certain monetary financial assets and liabilities, which are denominated in something other than the functional currency of the entity. Additionally, there was an increase of $31.6 million and $24.3 million, respectively, in net insurance recoveries related to North American Coal mines and various legal settlements period-over-period. These incremental increases were offset partially by the incurred casualty losses in 2013 of $19.1 million related to the Pointe Noire oil spill
as well as minimum contractual rail shipment tonnage not being met due to the delay in the Bloom Lake II expansion, which resulted in incurred penalties of $37.3 million.
Other Income (Expense)
Following is a summary of other income (expense) for the years ended December 31, 2013 and 2012:
|
| | | | | | | | | | | |
| (In Millions) |
| 2013 | | 2012 | | Variance Favorable/ (Unfavorable) |
Interest expense, net | (179.1 | ) | | (195.6 | ) | | 16.5 |
|
Other non-operating income (expense) | (2.6 | ) | | 2.6 |
| | (5.2 | ) |
| $ | (181.7 | ) | | $ | (193.0 | ) | | $ | 11.3 |
|
The decrease in interest expense in 2013 compared to 2012 was attributable primarily due to reduced interest expense of $35.7 million related to the repurchase of the $325.0 million private placement senior notes. This decrease was offset partially by additional interest expense of $20.3 million related to the $500 million 3.95 percent senior notes issued in December 2012. Refer to NOTE 5 - DEBT AND CREDIT FACILITIES for further information.
Income Taxes
Our tax rate is affected by permanent items, such as depletion and the relative amount of income we earn in various foreign jurisdictions with tax rates that differ from the U.S. statutory rate. It also is affected by discrete items that may occur in any given period, but are not consistent from period to period. The following represents a summary of our tax provision and corresponding effective rates for the December 31, 2013 and 2012:
|
| | | | | | | | | | | |
| (In Millions) |
| 2013 | | 2012 | | Variance |
Income tax expense | $ | (55.1 | ) | | $ | (255.9 | ) | | $ | 200.8 |
|
Effective tax rate | 11.3 | % | | (51.0 | )% | | 62.3 | % |
A reconciliation of our income tax attributable to continuing operations computed at the U.S. federal statutory rate for the years ended December 31, 2013 and 2012 is as follows:
|
| | | | | | | | | | | | | |
| (In Millions) |
| 2013 | | 2012 |
Tax at U.S. statutory rate of 35 percent | $ | 171.3 |
| | 35.0 | % | | $ | (175.6 | ) | | 35.0 | % |
Increases/(Decreases) due to: | | | | | | | |
Foreign exchange remeasurement | (2.6 | ) | | (0.5 | ) | | 62.3 |
| | (12.4 | ) |
Non-taxable loss (income) related to noncontrolling interests | (1.5 | ) | | (0.3 | ) | | 61.0 |
| | (12.0 | ) |
Impact of tax law change | — |
| | — |
| | (357.1 | ) | | 71.2 |
|
Percentage depletion in excess of cost depletion | (97.6 | ) | | (19.9 | ) | | (109.1 | ) | | 21.7 |
|
Impact of foreign operations | (10.2 | ) | | (2.1 | ) | | 65.2 |
| | (13.0 | ) |
Income not subject to tax | (106.6 | ) | | (21.8 | ) | | (108.0 | ) | | 21.5 |
|
Goodwill impairment | 20.5 |
| | 4.2 |
| | 202.2 |
| | (40.3 | ) |
State taxes, net | 5.6 |
| | 1.1 |
| | 7.3 |
| | (1.5 | ) |
Manufacturer's deduction | (7.9 | ) | | (1.6 | ) | | (4.7 | ) | | 0.9 |
|
Valuation allowance | 73.0 |
| | 14.9 |
| | 634.5 |
| | (126.5 | ) |
Tax uncertainties | 19.6 |
| | 5.3 |
| | (14.8 | ) | | 2.9 |
|
Prior year adjustments made in current year | (11.4 | ) | | (3.6 | ) | | (5.7 | ) | | 1.1 |
|
Other items - net | 2.9 |
| | 0.6 |
| | (1.6 | ) | | 0.4 |
|
Income tax expense | $ | 55.1 |
| | 11.3 | % | | $ | 255.9 |
| | (51.0 | )% |
In 2013, our income tax expense decreased by $200.8 million compared to 2012. The decrease in income tax expense year over year related primarily to various items recorded in 2012 including the placement of a full valuation allowance on the asset related to the Alternative Minimum Tax credit, the effect of currency elections on remeasurement, and the goodwill impairment related to Bloom Lake. Additionally, we recorded approximately $11.4 million of tax benefit in 2013 related primarily to adjustments to prior-year current and deferred tax balances.
See NOTE 9 - INCOME TAXES for further information.
Equity Loss from Ventures
Equity loss from ventures for the year ended December 31, 2013 of $74.4 million compares to equity loss from ventures for the year ended December 31, 2012 of $404.8 million. The equity loss from ventures for the year ended December 31, 2013 primarily was comprised of the impairment charge of $67.6 million related to our 30 percent ownership interest in Amapá, the sale of which was approved by the Board of Directors in December 2012. The sale closed in the fourth quarter of 2013. The equity loss from ventures for 2012 was comprised primarily of an impairment charge of $365.4 million related to the sale of our ownership interest in Amapá. Additionally, our equity loss consisted of our share of operating losses of $4.9 million for the year ended December 31, 2013, compared with operating losses of $31.4 million for 2012. Amapá’s equity loss from operations in 2012 was attributable primarily to our share of a settlement charge taken in the third quarter of 2012 for the termination of a transportation agreement that resulted in a $10.2 million loss and a $5.5 million adjustment related to tax credits that we determined would not be realizable.
Income and Gain on Sale from Discontinued Operations, net of tax
Income and Gain on Sale from Discontinued Operations, net of tax was comprised primarily of the gain on the sale of Sonoma and the loss on the operations of the 45 percent economic interest in the Sonoma joint venture coal mine for the year ended December 31, 2012. The sale of Sonoma resulted in a net gain of $38.0 million that was recorded upon the completion of the sale on November 12, 2012. The Sonoma joint venture operations resulted in a net loss of $2.1 million for the year ended December 31, 2012. Income from discontinued operations, net of tax in 2013 related to additional income tax benefit resulting from the actual tax gain from the sale of Sonoma included on the 2012 tax return, which was filed during the three months ended September 30, 2013.
Noncontrolling Interest
Noncontrolling interest primarily was comprised of our consolidated, but less-than-wholly owned subsidiaries at the Bloom Lake and Empire mining operations. The net loss attributable to the noncontrolling interest related to Bloom Lake was $66.5 million and $252.0 million for the years ended December 31, 2013 and 2012, respectively. The net loss in 2012 was driven by an impairment of goodwill of $997.3 million, of which $249.3 million was allocated to the noncontrolling interest.
The net income attributable to the noncontrolling interest related to the Empire mining venture was $20.7 million and $25.9 million for the years ended December 31, 2013 and 2012, respectively
Results of Operations – Segment Information
Our Company's primary operations are organized and managed according to product category and geographic location. Segment information reflects our strategic business units, which are organized to meet customer requirements and global competition. We evaluate segment performance based on sales margin, defined as revenues less cost of goods sold and operating expenses identifiable to each segment. This measure of operating performance is an effective measurement as we focus on reducing production costs.
We have historically evaluated segment performance based on sales margin, defined as revenues less cost of goods sold, and operating expenses identifiable to each segment. Additionally, beginning in the third quarter of 2014, concurrent with the change of a majority of our Board of Directors in August, 2014, which constituted and triggered a "change in control" as defined in our equity plans, management began to evaluate segment performance based on EBITDA, defined as Net Income (Loss) before interest, income taxes, depreciation, depletion and amortization, and Adjusted EBITDA, defined as EBITDA excluding certain items such as impairment charges, impacts of permanently idled, closed or sold facilities, foreign currency remeasurement, severance and other costs associated with the change in control, litigation judgments and intersegment corporate allocations of SG&A costs. Management uses and believes that investors benefit from referring to these measures in evaluating operating and financial results, as well as in planning, forecasting and analyzing future periods as these financial measures approximate the cash flows associated with the operational earnings.
2014 Compared to 2013
|
| | | | | | | |
| (In Millions) |
| 2014 | | 2013 |
| | | |
Net Income (Loss) | $ | (8,311.6 | ) | | $ | 361.8 |
|
Less: | | | |
Interest expense, net | (185.2 | ) | | (179.1 | ) |
Income tax benefit (expense) | 1,302.0 |
| | (55.1 | ) |
Depreciation, depletion and amortization | (504.0 | ) | | (593.3 | ) |
EBITDA | $ | (8,924.4 | ) | | $ | 1,189.3 |
|
Less: | | | |
Impairment of goodwill and other long-lived assets | $ | (9,029.9 | ) | | $ | (250.8 | ) |
Loss on sale of Cliffs Logan County Coal | (419.6 | ) | | — |
|
Wabush mine impact | (158.7 | ) | | (72.7 | ) |
Bloom Lake mine impact | (137.9 | ) | | 46.5 |
|
Foreign exchange remeasurement | 30.7 |
| | 64.0 |
|
Proxy contest and change in control costs in SG&A | (26.6 | ) | | — |
|
Litigation judgment | (96.3 | ) | | (9.6 | ) |
Severance in SG&A | (15.8 | ) | | (16.4 | ) |
Total Adjusted EBITDA | $ | 929.7 |
| | $ | 1,428.3 |
|
| | | |
EBITDA: | | | |
U.S. Iron Ore | $ | 805.6 |
| | $ | 1,000.1 |
|
Asia Pacific Iron Ore | (369.8 | ) | | 500.4 |
|
North American Coal | (1,326.8 | ) | | 129.5 |
|
Eastern Canadian Iron Ore | (7,673.9 | ) | | (192.8 | ) |
Other | (359.5 | ) | | (247.9 | ) |
Total EBITDA | $ | (8,924.4 | ) | | $ | 1,189.3 |
|
| | | |
Adjusted EBITDA: | | | |
U.S. Iron Ore | $ | 831.2 |
| | $ | 1,030.8 |
|
Asia Pacific Iron Ore | 264.6 |
| | 525.7 |
|
North American Coal | (28.5 | ) | | 154.0 |
|
Eastern Canadian Iron Ore | — |
| | — |
|
Other | (137.6 | ) | | (282.2 | ) |
Total Adjusted EBITDA | $ | 929.7 |
| | $ | 1,428.3 |
|
EBITDA for the year ended December 31, 2014 decreased by $10,113.7 million on a consolidated basis from 2013. The decrease was primarily driven by the goodwill and long-lived asset impairment charges recorded during 2014 of $7,269.2 million, $624.2 million, $857.5 million and $279.0 million related to the Eastern Canadian Iron Ore, Asia Pacific Iron Ore, North American Coal and Other segments, respectively. Additionally, lower sales margins across all operating segments negatively impacted EBITDA and was the main driver in the change of Adjusted EBITDA, which decreased by $498.6 million for the year ended December 31, 2014 from the comparable period in 2013. See further detail below for additional information regarding the specific factors that impacted each reportable segments' sales margin during 2014.
U.S. Iron Ore
The following is a summary of U.S. Iron Ore results for the years ended December 31, 2014 and 2013:
|
| | | | | | | | | | | | | | | | | | | | | | | | | | | | |
| | (In Millions) |
| | | | Changes due to: | |
|
| | Year Ended
December 31, | | Revenue and cost rate | | Sales volume | | Idle cost/production volume variance | | Freight and reimburse-ment | | Total change |
| | 2014 | | 2013 | | | | | |
Revenues from product sales and services | | $ | 2,506.5 |
| | $ | 2,667.9 |
| | $ | (233.6 | ) | | $ | 60.8 |
| | $ | — |
| | $ | 11.4 |
| | $ | (161.4 | ) |
Cost of goods sold and operating expenses | | (1,796.1 | ) | | (1,766.0 | ) | | (34.4 | ) | | (33.2 | ) | | 48.9 |
| | (11.4 | ) | | (30.1 | ) |
Sales margin | | $ | 710.4 |
| | $ | 901.9 |
| | $ | (268.0 | ) | | $ | 27.6 |
| | $ | 48.9 |
| | $ | — |
| | $ | (191.5 | ) |
| | | | | | | | | | | | | | |
| | Year Ended
December 31, | | | | | | | |
| | |
Per Ton Information | | 2014 | | 2013 | | Difference | | Percent change | | | | | | |
Realized product revenue rate1 | | $ | 102.36 |
| | $ | 113.08 |
| | $ | (10.72 | ) | | (9.5 | )% | | | | | | |
Cash production cost | | 64.09 |
| | 64.65 |
| | (0.56 | ) | | (0.9 | )% | | | | | | |
Non-production cash cost | | 0.82 |
| | 0.43 |
| | 0.39 |
| | 90.7 | % | | | | | | |
Cost of goods sold and operating expense rate1 (excluding DDA) | | 64.91 |
| | 65.08 |
| | (0.17 | ) | | (0.3 | )% | | | | | | |
Depreciation, depletion & amortization | | 4.92 |
| | 5.65 |
| | (0.73 | ) | | (12.9 | )% | | | | | | |
Total cost of goods sold and operating expense rate | | 69.83 |
| | 70.73 |
| | (0.90 | ) | | (1.3 | )% | | | | | | |
Sales margin | | $ | 32.53 |
| | $ | 42.35 |
| | $ | (9.82 | ) | | (23.2 | )% | | | | | | |
| | | | | | | | | | | | | | |
Sales tons2 (In thousands) | | 21,840 |
| | 21,299 |
| | | | | | | | | | |
Production tons2 (In thousands) | | | | | | | | | | | | | | |
Total | | 29,733 |
| | 27,234 |
| | | | | | | | | | |
Cliffs’ share of total | | 22,431 |
| | 20,271 |
| | | | | | | | | | |
1 Excludes revenues and expenses related to domestic freight, which are offsetting and have no impact on sales margin. Revenues also exclude venture partner cost reimbursements. |
2 Tons are long tons (2,240 pounds). |
Sales margin for U.S. Iron Ore was $710.4 million for the year ended December 31, 2014, compared with the sales margin of $901.9 million for the year ended December 31, 2013. The decline compared to the prior year is attributable to a decrease in revenue of $161.4 million as well as an increase in cost of goods sold and operating expenses of $30.1 million. Sales margin per ton decreased 23.2 percent to $32.53 during the year ended December 31, 2014 compared to 2013.
Revenue decreased by $172.8 million, excluding the increase of $11.4 million of freight and reimbursements, from the prior year, predominantly due to:
| |
• | The average year-to-date realized product revenue rate declined by $10.72 per ton or 9.5 percent to $102.36 per ton in 2014, which resulted in a decrease of $233.6 million. This decline is a result of: |
| |
◦ | Changes in customer pricing negatively affected the realized revenue rate by $6 per ton driven primarily by the period-over-period reduction in Platts 62 percent Fe fines spot price and by new base pricing from an additional contract; and |
| |
◦ | Realized revenue rates impacted negatively by $5 per ton related to one major customer contract with a reduced average selling price due to a contractual change in the 2014 pricing mechanism. |
•Primarily offset by higher sales volumes of 541 thousand tons or $60.8 million due to:
| |
◦ | Higher Great Lakes sales due to increased contracted tons in 2014 from two customers due to separate contract extensions/amendments, higher demand from a customer due to the Great Lakes freeze preventing the customer from reaching its self-produced ore along with increased nominations in 2014 for two major customer contracts. |
| |
◦ | Partially offset by decreased export sales due to increased 2014 Great Lakes nominations and low market pricing providing a disincentive for spot shipment opportunities along with reduced spot sales that occurred with one customer in the prior-year not recurring for as much tonnage in 2014. |
Cost of goods sold and operating expenses in 2014 increased $18.7 million, excluding the increase of $11.4 million of freight and reimbursements from the prior year, predominantly as a result of:
| |
• | Higher costs related to increased mobile equipment repairs and increased maintenance and repair costs primarily driven by increased kiln repairs at Empire in 2014 due to the 2016 life-of-mine extension, mill repair at the Hibbing mine, along with higher costs related to increased energy rates in the first quarter of 2014; and |
| |
• | Increased sales volumes, as discussed above, that increased costs by $33.2 million compared to the prior-year period. |
| |
• | Partially offset by lower idle costs of $48.9 million due to restarting the two production lines at our Northshore mine during the first quarter of 2014 that were previously idled in January 2013 and the non-recurrence of the 2013 summer shutdown of the Empire mine in 2014. |
Production
Cliffs' share of production in its U.S. Iron Ore segment increased by 10.7 percent in 2014 when compared to 2013. There was increased production at our Empire mine of 1.3 million tons in 2014 as a result of the non-recurrence of the summer shutdown that occurred in 2013, beginning early in the second quarter and ending in the third quarter. Additionally, there was an increase in production of 1.4 million tons at the Northshore mine during 2014, as we restarted the two idled furnaces in the first quarter of 2014. We had previously idled two of the four furnaces at the Northshore mine in January 2013. These increases were partially offset by decreased production of 260 thousand tons at our United Taconite mine due to extreme weather and unplanned maintenance outages. One of the four furnaces in the Northshore pellet plant became idled in January 2015 and is expected to remain idled throughout the year.
Asia Pacific Iron Ore
The following is a summary of Asia Pacific Iron Ore results for the years ended December 31, 2014 and 2013:
|
| | | | | | | | | | | | | | | | | | | | | | | | | | | | |
| | (In Millions) |
| | | | Change due to: | | |
| | Year Ended
December 31, | | Revenue and cost rate | | Sales volume | | Exchange rate | | Freight and reimburse-ment | | Total change |
| | 2014 | | 2013 | | | | | |
Revenues from product sales and services | | $ | 866.7 |
| | $ | 1,224.3 |
| | $ | (414.8 | ) | | $ | 54.8 |
| | $ | (4.5 | ) | | $ | 6.9 |
| | $ | (357.6 | ) |
Cost of goods sold and operating expenses | | (745.0 | ) | | (857.2 | ) | | 102.7 |
| | (37.9 | ) | | 54.3 |
| | (6.9 | ) | | 112.2 |
|
Sales margin | | $ | 121.7 |
| | $ | 367.1 |
| | $ | (312.1 | ) | | $ | 16.9 |
| | $ | 49.8 |
| | $ | — |
| | $ | (245.4 | ) |
| | | | | | | | | | | | | | |
| | Year Ended
December 31, | | | | | | | | | |
|
Per Ton Information | | 2014 | | 2013 | | Difference | | Percent change | | | | | | |
Realized product revenue rate1 | | $ | 74.56 |
| | $ | 110.87 |
| | $ | (36.31 | ) | | (32.8 | )% | | | | | | |
Cash production cost | | 49.41 |
| | 58.02 |
| | (8.61 | ) | | (14.8 | )% | | | | | | |
Non-production cash cost | | 1.95 |
| | 5.69 |
| | (3.74 | ) | | (65.7 | )% | | | | | | |
Cost of goods sold and operating expense rate1 (excluding DDA) | | 51.36 |
| | 63.71 |
| | (12.35 | ) | | (19.4 | )% | | | | | | |
Depreciation, depletion & amortization | | 12.65 |
| | 13.92 |
| | (1.27 | ) | | (9.1 | )% | | | | | | |
Total cost of goods sold and operating expense rate | | 64.01 |
| | 77.63 |
| | (13.62 | ) | | (17.5 | )% | | | | | | |
Sales margin | | $ | 10.55 |
| | $ | 33.24 |
| | $ | (22.69 | ) | | (68.3 | )% | | | | | | |
| | | | | | | | | | | | | | |
Sales tons2 (In thousands) | | 11,531 |
| | 11,043 |
| | | | | | | | | | |
Production tons2 (In thousands) | | 11,352 |
| | 11,109 |
| | | | | | | | | | |
1 We began selling a portion of our product on a CFR basis in 2014. As such, the information above excludes revenues and expenses related to freight, which are offsetting and have no impact on sales margin. |
2 Metric tons (2,205 pounds). |
Sales margin for our Asia Pacific Iron Ore segment decreased to $121.7 million during the year ended December 31, 2014 compared with $367.1 million for the same period in 2013. Sales margin per ton decreased 68.3 percent to $10.55 per ton in 2014 compared to 2013.
Revenue decreased by $364.5 million during the year ended December 31, 2014 over the prior year, excluding the increase of $6.9 million of freight and reimbursements, primarily as a result of:
| |
• | An overall decrease to the average realized revenue rate, which resulted in a decrease of $414.8 million, primarily as a result of a decrease in the Platts 62 percent Fe fines spot price to an average of $97 per ton from $135 per ton in the prior-year period, |
| |
• | Partially offset by the higher sales volume of 11.5 million tons during the year ended December 31, 2014 compared with 11.0 million tons during the prior-year period due to strong rail deliveries and increased production, resulting in an increase in revenue of $54.8 million. |
Cost of goods sold and operating expenses in the year ended December 31, 2014 decreased $119.1 million, excluding the increase of $6.9 million of freight and reimbursements, compared to 2013 primarily as a result of:
| |
• | Reduced mining costs of $81.2 million mainly due to lower mining contractor costs primarily resulting from a focus on efficiencies across the operation, lower sales royalties of $23.9 million primarily attributable to the decline in the Platts 62 percent Fe fines spot price, and lower logistics costs of $12.0 million primarily attributable to the finalization of the port dispute. These cost savings are partially offset |
by an increase in site administration expenses of $9.6 million due to realignment of head count to the sites and severance payments of $1.6 million; and
| |
• | Favorable foreign exchange rate variances of $54.3 million or $5 per metric ton. |
| |
• | These decreases were offset partially by higher sales volumes, as discussed above, that resulted in increased costs of $37.9 million compared to the prior year. |
Production
Production at our Asia Pacific Iron Ore segment increased 243 thousand metric tons or 2.2 percent during the year ended December 31, 2014 when compared to 2013. The increase in production tons compared to the prior-year period is mainly attributable to increased rail capacity as there were less train delays and better loading procedures implemented to get more tons into each wagon.
North American Coal
The following is a summary of North American Coal results for the years ended December 31, 2014 and 2013:
|
| | | | | | | | | | | | | | | | | | | | | | | | | | | | |
| | (In Millions) |
| | | | Change due to: | | |
| | Year Ended
December 31, | | Revenue and cost rate | | Sales volume | | Inventory write-down | | Freight and reimburse-ment | | Total change |
| | 2014 | | 2013 | | | | | |
Revenues from product sales and services | | $ | 687.1 |
| | $ | 821.9 |
| | $ | (176.8 | ) | | $ | 12.8 |
| | $ | — |
| | $ | 29.2 |
| | $ | (134.8 | ) |
Cost of goods sold and operating expenses | | (822.9 | ) | | (836.4 | ) | | 89.1 |
| | (13.0 | ) | | (33.4 | ) | | (29.2 | ) | | 13.5 |
|
Sales margin | | $ | (135.8 | ) | | $ | (14.5 | ) | | $ | (87.7 | ) | | $ | (0.2 | ) | | $ | (33.4 | ) | | $ | — |
| | $ | (121.3 | ) |
| | | | | | | | | | | | | | |
| | Year Ended
December 31, | | | | | | | | | |
|
Per Ton Information | | 2014 | | 2013 | | Difference | | Percent change | | | | | | |
Realized product revenue rate1 | | $ | 77.31 |
| | $ | 101.20 |
| | $ | (23.89 | ) | | (23.6 | )% | | | | | | |
Cash production cost | | 68.64 |
| | 75.27 |
| | (6.63 | ) | | (8.8 | )% | | | | | | |
Non-production cash cost | | 12.58 |
| | 10.20 |
| | 2.38 |
| | 23.3 | % | | | | | | |
Cost of goods sold and operating expense rate1 (excluding DDA) | | 81.22 |
| | 85.47 |
| | (4.25 | ) | | (5.0 | )% | | | | | | |
Depreciation, depletion & amortization | | 14.45 |
| | 17.72 |
| | (3.27 | ) | | (18.5 | )% | | | | | | |
Total cost of goods sold and operating expense rate | | 95.67 |
| | 103.19 |
| | (7.52 | ) | | (7.3 | )% | | | | | | |
Sales margin | | $ | (18.36 | ) | | $ | (1.99 | ) | | $ | (16.37 | ) | | n/m | | | | | | |
| | | | | | | | | | | | | | |
Sales tons2 (In thousands) | | 7,400 |
| | 7,274 |
| | | | | | | | | | |
Production tons2 (In thousands) | | 7,536 |
| | 7,221 |
| | | | | | | | | | |
1 Excludes revenues and expenses related to domestic freight, which are offsetting and have no impact on sales margin. |
2 Tons are short tons (2,000 pounds). |
Sales margin for the North American Coal segment decreased to a loss of $135.8 million during the year ended December 31, 2014, compared to a sales margin loss of $14.5 million during the year ended December 31, 2013. Sales margin per ton decreased to a loss of $18.36 per ton in 2014 compared to a sales margin loss of $1.99 per ton in the prior year.
Revenues from product sales and services were $687.1 million, which is a decrease of $164.0 million over the prior-year period, excluding the increase of $29.2 million of freight and reimbursements, predominantly due to:
| |
• | A decrease in our realized product revenue rate of $176.8 million or 23.6 percent on a per-ton basis for the year ended December 31, 2014. This decline is a result of: |
| |
◦ | The downward trend in market pricing period over period, including a decrease of $33 per ton in the 2014 average benchmark price, along with a more favorable impact in 2013 from carryover contracts; and |
| |
◦ | An unfavorable change in product mix negatively impacting the realized revenue rate by $5 per ton primarily attributable to lower domestic sales of high-volatile and low-volatile metallurgical coal which required higher export sales and increased sales of thermal coal, both of which are unfavorable to the overall realized revenue rate. |
| |
• | Partially offset by sales volume increases of 126 thousand tons or 1.7 percent during 2014 in comparison to the prior-year resulting in an increase in revenue of $12.8 million, primarily due to higher thermal coal sales due to a new contract offset by decreased sales of high-volatile metallurgical coal resulting from non-renewal of a customer contract. The decreased sales of high-volatile metallurgical coal was partly mitigated by an increase in export sales. |
Cost of goods sold and operating expenses in 2014 decreased $42.7 million, excluding the increase of $29.2 million of freight and reimbursements from the comparable period in the prior year, predominantly as a result of:
| |
• | Decreased spending of $26.6 million on production costs due to increased focus on reducing external services and administrative costs at our low-volatile metallurgical coal mines, a reduction in depreciation, amortization and depletion expense of $21.9 million in 2014 due to the long-lived asset impairments taken during the current year, and decreased costs related to royalties and severance taxes of $14.0 million due to a reduced year-over-year revenue rate; and |
| |
• | The impact of lower-of-cost-or-market inventory charges resulted in lower costs of $15.9 million as inventory was sold. |
| |
◦ | An unfavorable variance in the lower-of-cost-or-market inventory charge of $33.4 million in comparison to the prior-year period as the lower-of-cost-or-market inventory charges at December 31, 2014 and 2013 were $44.5 million and $11.1 million, respectively; and |
| |
◦ | Higher sales volume attributable to additional thermal coal sales, as discussed above, resulted in an additional $13.0 million of costs. |
Production
Production of low- and high-volatile metallurgical coal in 2014 was 6.6 million tons, which is consistent with the prior-year production. Due to increased demand for thermal coal in 2014, we increased production at our thermal coal mine from one shift to two shifts in the first quarter of 2014 to align production with customer demand. Thermal coal production was 927 thousand tons during 2014, which is an increase of 46.7 percent compared to the prior year. The increase in thermal coal production was the primary contributor to our increased overall coal production in 2014. Additionally in August 2014, the Oak Grove mine set its one-day production record by producing 14 thousand tons in one day.
In the fourth quarter of 2014, we sold our CLCC assets. Production tons at CLCC were 2.5 million tons and 2.1 million tons for the years ended December 31, 2014 and 2013, respectively, and are included in the production tons disclosed above.
Eastern Canadian Iron Ore
The following is a summary of Eastern Canadian Iron Ore results for the years ended December 31, 2014 and 2013:
|
| | | | | | | | | | | | | | | | | | | | | | | | | | | | | | | | |
| | (In Millions) |
| | | | Change due to: | | |
| | Year Ended
December 31, | | Revenue and cost rate | | Sales volume | | Wabush idle 2 | | Inventory write-down | | Exchange rate | | Total change |
| | 2014 | | 2013 | | | | | | |
Revenues from product sales and services | | $ | 563.4 |
| | $ | 978.7 |
| | $ | (182.4 | ) | | $ | 55.1 |
| | $ | (288.0 | ) | | $ | — |
| | $ | — |
| | $ | (415.3 | ) |
Cost of goods sold and operating expenses | | (808.3 | ) | | (1,082.0 | ) | | 10.7 |
| | (57.5 | ) | | 304.4 |
| | (23.4 | ) | | 39.5 |
| | 273.7 |
|
Sales margin | | $ | (244.9 | ) | | $ | (103.3 | ) | | $ | (171.7 | ) | | $ | (2.4 | ) | | $ | 16.4 |
| | $ | (23.4 | ) | | $ | 39.5 |
| | $ | (141.6 | ) |
| | | | | | | | | | | | | | | | |
| | Year Ended
December 31, | |
| |
| |
| |
| |
| | |
Per Ton Information | | 2014 | | 2013 | | Difference | | Percent change | | | | | | | | |
Realized product revenue rate 3 | | 81.19 |
| | $ | 110.79 |
| | $ | (29.60 | ) | | (26.7 | )% | | | | | | | | |
Cash production cost | | 81.04 |
| | 86.20 |
| | (5.16 | ) | | (6.0 | )% | | | | | | | | |
Non-production cash cost | | 10.50 |
| | 3.67 |
| | 6.83 |
| | 186.1 | % | | | | | | | | |
Cost of goods sold and operating expense rate (excluding DDA) 3 | | 91.54 |
| | 89.87 |
| | 1.67 |
| | 1.9 | % | | | | | | | | |
Depreciation, depletion & amortization 3 | | 19.78 |
| | 25.79 |
| | (6.01 | ) | | (23.3 | )% | | | | | | | | |
Total cost of goods sold and operating expense rate 3 | | 111.32 |
| | 115.66 |
| | (4.34 | ) | | (3.8 | )% | | | | | | | | |
Sales margin 3 | | $ | (30.13 | ) | | $ | (4.87 | ) | | $ | (25.26 | ) | | n/m | | | | | | | | |
| | | | | | | | | | | | | | | | |
Bloom Lake sales tons | | 6,162 |
| | 5,665 |
| | | | | | | | | | | | |
Wabush sales tons | | 1,066 |
| | 2,886 |
| | | | | | | | | | | | |
Sales tons1 (In thousands) | | 7,228 |
| | 8,551 |
| | | | | | | | | | | | |
| | | | | | | | | | | | | | | | |
Bloom Lake production tons | | 5,940 |
| | 5,877 |
| | | | | | | | | | | | |
Wabush production tons | | 280 |
| | 2,778 |
| | | | | | | | | | | | |
Production tons1 (In thousands) | | 6,220 |
| | 8,655 |
| | | | | | | | | | | | |
1 Tons are metric tons (2,205 pounds). |
2 As a result of the Wabush mine idle, all revenue and cost activity related to the Wabush mine has been quantified in the Wabush idle column of the chart above. |
3 As a result of the Wabush mine idle, all revenue and cost activity related to the Wabush mine has been excluded from the Per Ton Information above. Per Ton Information relates to the Bloom Lake mine only. |
We reported a sales margin loss for our Eastern Canadian Iron Ore segment of $244.9 million for the year ended December 31, 2014, compared with a sales margin loss of $103.3 million for the year ended December 31, 2013. Sales margin per metric ton for the Bloom Lake mine increased to a loss of $30.13 per metric ton for the year ended December 31, 2014 compared to a sales margin loss of $4.87 per metric ton for 2013.
Revenue decreased by $415.3 million for the year ended December 31, 2014 when compared to prior year, primarily due to:
| |
• | A reduction in revenue of $288.0 million due to idling of the Wabush Scully mine in Newfoundland and Labrador at the end of March 2014 and the idling of the Wabush pellet plant in June 2013; and |
| |
• | An overall decrease to the Bloom Lake mine average realized revenue rate, which resulted in a decrease of $182.4 million, primarily as a result of a decrease in the Platts 62 percent Fe fines spot price to an average of $97 per ton from $135 per ton in the prior year, |
| |
• | Partially offset by higher sales volumes at the Bloom Lake mine of 497 thousand tons resulting in an increase to revenue of $55.1 million, which was primarily related to the timing of customer shipments that were delayed from the end of 2013 into 2014 as a result of adverse weather conditions. |
Cost of goods sold and operating expenses during the year ended December 31, 2014 decreased from 2013 by $273.7 million primarily due to:
| |
• | Lower costs of $304.4 million due to idling the Wabush pellet plant in June 2013 and idling of the Wabush Scully mine in Newfoundland and Labrador at the end of March 2014; |
| |
• | Favorable foreign exchange rate variances of $39.5 million; and |
| |
• | Reduced costs mainly attributable to lower depreciation, depletion and amortization costs of $24.2 million year-over-year primarily as a result of long-lived asset impairments taken in the third quarter of 2014 along with reduced spending on external services, |
| |
◦ | Higher sales volumes at the Bloom Lake facilities as discussed above resulting in increased costs of $57.5 million compared to the prior-year period; |
| |
◦ | Unfavorable foreign exchange contract hedging impacts of $13.6 million year-over-year driven by the de-designation of foreign currency hedges; and |
| |
◦ | An unfavorable variance of $23.4 million in lower-of-cost-or-market inventory charges at our Bloom Lake operation. Lower-of-cost-or-market charges were $27.9 million in 2014, primarily attributable to market declines in Platts spot rate pricing as well as higher cost of inventory driven by the timing of maintenance activities and mine development up until production ceased at Bloom Lake and the mine entered "care-and-maintenane" mode on December 31, 2014. The Bloom Lake mine had lower-of-cost-or-market inventory charges of $4.5 million in 2013. |
Production
The Bloom Lake facility produced 5.9 million tons of iron ore concentrate in each of the years ended December 31, 2014 and 2013, respectively. As we have previously disclosed, despite our cost-cutting progress at our Bloom Lake mine, we have concluded that Phase I alone is not economically feasible based on our current operating plans. We also determined that the Phase II expansion of the Bloom Lake mine was no longer a viable option for us and we shifted our focus to considering available possibilities and executing an exit option for Eastern Canadian Iron Ore operations that minimizes the cash outflows and associated liabilities. In December 2014, iron ore production at the Bloom Lake mine was suspended and the Bloom Lake mine was placed in ‘‘care-and-maintenance’’ mode.
Production at the Wabush facility was 0.3 million tons of iron ore concentrate during the year ended December 31, 2014 and 1.6 million tons of iron ore concentrate and 1.2 million tons of iron ore pellets during the year end December 31, 2013, respectively. Due to high production costs and lower pellet premium pricing, we idled production at the Wabush pellet plant and transitioned to producing an iron ore concentrate product from our Wabush Scully mine during June 2013. At the end of March 2014, we idled our Wabush Scully mine in Newfoundland and Labrador and began to implement the permanent closure plan for the mine in the fourth quarter of 2014.
2013 Compared to 2012
|
| | | | | | | |
| (In Millions) |
| 2013 | | 2012 |
| | | |
Net Income (Loss) | $ | 361.8 |
| | $ | (1,126.6 | ) |
Less: | | | |
Interest expense, net | (179.1 | ) | | (195.6 | ) |
Income tax benefit (expense) | (55.1 | ) | | (255.9 | ) |
Depreciation, depletion and amortization | (593.3 | ) | | (525.8 | ) |
EBITDA | $ | 1,189.3 |
| | $ | (149.3 | ) |
Less: | | | |
Impairment of goodwill and other long-lived assets | $ | (250.8 | ) | | $ | (1,049.9 | ) |
Impairment of equity method investment | — |
| | (365.4 | ) |
Loss on sale of Cliffs Logan County Coal | — |
| | — |
|
Wabush mine impact | (72.7 | ) | | (30.1 | ) |
Bloom Lake mine impact | 46.5 |
| | 6.4 |
|
Foreign exchange remeasurement | 64.0 |
| | (3.2 | ) |
Proxy contest and change in control costs in SG&A | — |
| | — |
|
Litigation judgment | (9.6 | ) | | — |
|
Severance in SG&A | (16.4 | ) | | — |
|
Total Adjusted EBITDA | $ | 1,428.3 |
| | $ | 1,292.9 |
|
| | | |
EBITDA: | | | |
U.S. Iron Ore | $ | 1,000.1 |
| | $ | 1,045.3 |
|
Asia Pacific Iron Ore | 500.4 |
| | 387.3 |
|
North American Coal | 129.5 |
| | 74.0 |
|
Eastern Canadian Iron Ore | (192.8 | ) | | (1,103.3 | ) |
Other | (247.9 | ) | | (552.6 | ) |
Total EBITDA | $ | 1,189.3 |
| | $ | (149.3 | ) |
| | | |
Adjusted EBITDA: | | | |
U.S. Iron Ore | $ | 1,030.8 |
| | $ | 1,085.6 |
|
Asia Pacific Iron Ore | 525.7 |
| | 402.1 |
|
North American Coal | 154.0 |
| | 106.7 |
|
Eastern Canadian Iron Ore | — |
| | — |
|
Other | (282.2 | ) | | (301.5 | ) |
Total Adjusted EBITDA | $ | 1,428.3 |
| | $ | 1,292.9 |
|
EBITDA for the year ended December 31, 2013 increased by $1,338.6 million on a consolidated basis from 2012. The increase was primarily driven by the favorable fluctuation in goodwill and long-lived asset impairment charges recorded during 2013 compared to 2012 for the Eastern Canadian Iron Ore segment. For the years ended December 31, 2013 and 2012, we recorded goodwill and long-lived asset impairment charges of $154.6 million and $1,049.9 million, respectively, related to the Eastern Canadian Iron Ore segment. Additionally, lower exploration and SG&A expense of $134.7 million when comparing 2013 to 2012 positively impacted EBITDA and was a main driver in the change of Adjusted EBITDA, which increased by $135.4 million for the year ended December 31, 2013 from 2012. See further detail below regarding the specific factors that impacted the sales margin of each reportable segment sales margin during 2013.
U.S. Iron Ore
Following is a summary of U.S. Iron Ore results for the years ended December 31, 2013 and 2012:
|
| | | | | | | | | | | | | | | | | | | | | | | | | | | |
| (In Millions) |
| | | Change due to | |
| Year Ended
December 31, | | Revenue and cost rate | | Sales volume | | Idle cost/Production volume variance | | Freight and reimburse-ment | | Total change |
| 2013 | | 2012 | | | | | |
Revenues from product sales and services | $ | 2,667.9 |
| | $ | 2,723.3 |
| | $ | (24.5 | ) | | $ | (39.6 | ) | | $ | — |
| | $ | 8.7 |
| | $ | (55.4 | ) |
Cost of goods sold and operating expenses | (1,766.0 | ) | | (1,747.1 | ) | | 11.7 |
| | 10.4 |
| | (32.3 | ) | | (8.7 | ) | | (18.9 | ) |
Sales margin | $ | 901.9 |
|
| $ | 976.2 |
| | $ | (12.8 | ) | | $ | (29.2 | ) | | $ | (32.3 | ) | | $ | — |
| | $ | (74.3 | ) |
| | | | | | | | | | | | | |
| Year Ended December 31, | | | | | | | | | | |
Per Ton Information | 2013 | | 2012 | | Difference | | Percent change | | | | | | |
Realized product revenue rate1 | $ | 113.08 |
| | $ | 114.29 |
| | $ | (1.21 | ) | | (1.1 | )% | | | | | | |
Cash production cost | 64.65 |
| | 63.28 |
| | 1.37 |
| | 2.2 | % | | | | | | |
Non-production cash cost | 0.43 |
| | 1.22 |
| | (0.79 | ) | | (64.8 | )% | | | | | | |
Cost of goods sold and operating expenses rate1 (excluding DDA) | 65.08 |
| | 64.50 |
| | 0.58 |
| | 0.9 | % | | | | | | |
Depreciation, depletion & amortization | 5.65 |
| | 4.66 |
| | 0.99 |
| | 21.2 | % | | | | | | |
Total cost of goods sold and operating expenses rate | 70.73 |
| | 69.16 |
| | 1.57 |
| | 2.3 | % | | | | | | |
Sales margin | $ | 42.35 |
| | $ | 45.13 |
| | $ | (2.78 | ) | | (6.2 | )% | | | | | | |
| | | | | | | | | | | | | |
Sales tons 2 (In thousands) | 21,299 |
| | 21,633 |
| | | | | | | | | | |
Production tons 2 (In thousands) | | | | | | | | | | | | | |
Total | 27,234 |
| | 29,526 |
| | | | | | | | | | |
Cliffs’ share of total | 20,271 |
| | 21,992 |
| | | | | | | | | | |
1 Excludes revenues and expenses related to domestic freight, which are offsetting and have no impact on sales margin. Revenues also exclude venture partner cost reimbursements. |
2 Tons are long tons (2,240 pounds). |
Sales margin for U.S. Iron Ore was $901.9 million for the year ended December 31, 2013, compared with the sales margin of $976.2 million for the year ended December 31, 2012. The decline compared to the prior year is attributable to a decrease in revenue of $55.4 million as well as an increase in cost of goods sold and operating expenses of $18.9 million. Sales margin per ton decreased 6.2 percent to $42.35 during the year ended December 31, 2013 compared to 2012.
Revenue decreased by $64.1 million, excluding the increase of $8.7 million of freight and reimbursements, from the prior year, predominantly due to:
| |
• | Lower sales volumes of 334 thousand tons or $39.6 million: |
| |
◦ | Primarily driven by the expiration of one contract with a continuing customer, a lower full-year nomination by a customer, reduced tonnage with a customer due to their force majeure and the bankruptcy of one customer in 2012, |
| |
◦ | Partially offset by the placement of an additional 1.2 million export tons primarily due to pellet contracts transferred from Wabush as well as trial and spot cargoes in Europe during 2013 |
when compared to the prior year. We additionally benefited from additional customer demand, specifically additional spot contracts with a major customer in the Great Lakes region.
| |
• | A decline in the average revenue rate, which resulted in a decrease of $24.5 million also was a contributing factor to the decrease in year-over-year revenues. The average year-to-date realized product revenue rate declined by $1.21 per ton or 1.1 percent to $113.08 per ton in 2013. This decline is a result of: |
| |
◦ | Unfavorable customer mix impacted the realized revenue rates by $3 per ton primarily due to higher sales tonnage to overseas customers, which have lower realized revenue rates driven by additional transportation costs to move inventory from the U.S. Iron Ore mine locations to the international port locations in Québec, which reduces our realized revenue rate per ton; and |
| |
◦ | Realized revenue rates were impacted negatively by $1 per ton as a result of discounts given during 2013 as a part of recently extended contracts, |
| |
◦ | Partially offset by one customer contract that increased the average rate by $3 per ton due to the reset of their contract base rate. |
Cost of goods sold and operating expenses in 2013 increased $10.2 million, excluding the increase of $8.7 million of freight and reimbursements compared to the prior year, predominantly as a result of:
| |
• | Higher idle costs of $32.3 million due to the previously announced temporary idling of production at the Empire mine and the idle of two of the four production lines at our Northshore mine, offset by; |
| |
• | Lower sales volumes decreased costs by $10.4 million compared to the prior year; |
| |
• | Lower costs of $12.0 million attributable to timing of tolling cost distribution to Empire mine partner ArcelorMittal when compared to the prior year; and |
| |
• | Lower costs of $11.6 million due to a reduction in electrical energy rates at Empire and Tilden mines as a result of switching energy suppliers, reduced contractor spend of $29.4 million and optimized maintenance spend of $21.1 million and partially offset by increased costs of $16.6 million due to higher rates for natural gas and supplies as well as increased costs of $17.5 million related to deeper pit hauls as compared to 2012. |
Production
Cliffs' share of production in our U.S. Iron Ore segment decreased by 7.8 percent during the year ended December 31, 2013 when compared to 2012. Beginning on January 5, 2013, we idled two of the four furnaces at the Northshore mine for the remainder of 2013 and into the first quarter of 2014, which resulted in decreased production of 1.4 million tons when compared to the year ended December 31, 2012. During the first quarter of 2014, we restarted the two idled furnaces.
Asia Pacific Iron Ore
Following is a summary of Asia Pacific Iron Ore results for the years ended December 31, 2013 and 2012:
|
| | | | | | | | | | | | | | | | | | | | | | | | | | |
| (In Millions) |
| Year Ended December 31, | | Change due to | | |
| Revenue and cost rate | | Sales Volume | | Completion of Cockatoo Mining Stage 3 | Exchange Rate | | Total change |
| 2013 | | 2012 | | | | |
Revenues from product sales and services | $ | 1,224.3 |
| | $ | 1,259.3 |
| | $ | 39.5 |
| | $ | (0.2 | ) | | $ | (77.0 | ) | $ | 2.7 |
| | $ | (35.0 | ) |
Cost of goods sold and operating expenses | (857.2 | ) | | (948.3 | ) | | (22.2 | ) | | 0.2 |
| | 51.2 |
| 61.9 |
| | 91.1 |
|
Sales margin | $ | 367.1 |
|
| $ | 311.0 |
|
| $ | 17.3 |
|
| $ | — |
|
| $ | (25.8 | ) | $ | 64.6 |
|
| $ | 56.1 |
|
|
| Year Ended December 31, | | | | | | | | | |
Per Ton Information | 2013 | | 2012 | | Difference | | Percent change | | | | | |
Realized product revenue rate | $ | 110.87 |
| | $ | 107.81 |
| | $ | 3.06 |
| | 2.8 | % | | | | | |
Cash production cost | 58.02 |
| | 62.02 |
| | (4.00 | ) | | (6.4 | )% | | | | | |
Non-production cash cost | 5.69 |
| | 6.16 |
| | (0.47 | ) | | (7.6 | )% | | | | | |
Cost of goods sold and operating expenses rate (excluding DDA) | 63.71 |
| | 68.18 |
| | (4.47 | ) | | (6.6 | )% | | | | | |
Depreciation, depletion & amortization | 13.92 |
| | 13.00 |
| | 0.92 |
| | 7.1 | % | | | | | |
Total cost of goods sold and operating expenses rate | 77.63 |
| | 81.18 |
| | (3.55 | ) | | (4.4 | )% | | | | | |
Sales margin | $ | 33.24 |
| | $ | 26.63 |
| | $ | 6.61 |
| | 24.8 | % | | | | | |
| | | | | | | | | | | | |
Sales tons 1 (In thousands) | 11,043 |
| | 11,681 |
| | | | | | | | | |
Production tons 1 (In thousands) | 11,109 |
| | 11,260 |
| | | | | | | | | |
1 Metric tons (2,205 pounds). Cockatoo Island production and sales are reflected at our 50 percent share during the first half of 2012. |
Sales margin for our Asia Pacific Iron Ore segment increased to $367.1 million during the year ended December 31, 2013 compared with $311.0 million for the same period in 2012. Sales margin per metric ton increased 24.8 percent to $33.24 per metric ton in 2013 compared to 2012.
Revenue decreased by $35.0 million during the year ended December 31, 2013 over the prior year primarily as a result of:
| |
• | The completion of the mining of Stage 3 at Cockatoo and the sale of our interest at the end of the third quarter of 2012, resulting in a revenue decrease of $77.0 million or 636 thousand metric tons compared to the prior year. |
| |
• | These decreases were offset partially by an increase in our realized product revenue rate for the year ended December 31, 2013 that resulted in an increase of $39.5 million or 2.8 percent on a per-ton basis. This increase is driven mainly by: |
| |
◦ | The Platts 62 percent Fe index increased to an average of $135 per metric ton from $130 per metric ton during the prior year, which positively impacted the revenue rate resulting in an increase of $56.6 million or $5 per metric ton to our realized revenue rate; and |
| |
◦ | The low-grade iron ore sales campaign in 2012 that did not recur in 2013, which positively impacted the revenue rate variance resulting in an increase of $40.6 million or $4 per metric ton, |
| |
◦ | Offset by a reduction to our realized revenue rate due to: |
| |
▪ | Unfavorable change in foreign exchange contract hedging impacts of $26.7 million or $2 per metric ton period over period; and |
| |
▪ | Lower iron ore content on standard product in 2013 resulting in a reduction of realized product revenue rate of $22.7 million or $2 per metric ton. |
Cost of goods sold and operating expenses in the year ended December 31, 2013 decreased $91.1 million compared to 2012 primarily as a result of:
| |
• | The completion of the mining of Stage 3 at Cockatoo and the sale of our interest at the end of the third quarter of 2012, resulting in a decrease in costs of $51.2 million in 2013 compared to the prior year; and |
| |
• | Favorable foreign exchange rate variances of $61.9 million or $6 per metric ton. |
| |
• | Partially offset by higher logistics costs of $29.6 million mainly attributable to higher railed tons and higher ship-loading handling charges in 2013 slightly mitigated by lower mining and crushing costs of $6.6 million due to improved efficiencies. |
Production
Production at our Asia Pacific Iron Ore segment decreased 151 thousand metric tons or 1.3 percent during the year ended December 31, 2013 when compared to 2012. We completed the mining of Stage 3 at Cockatoo and sold our interest during the third quarter of 2012, resulting in a decrease of 590 thousand metric tons in total production during the year 2013 compared to 2012. The decrease was offset partially by the increased production of 439 thousand metric tons at Koolyanobbing in 2013 resulting from the completion of the Koolyanobbing expansion project during mid-2012, which provided additional ore processing and rail and port capabilities that drove performance increases at this mine.
North American Coal
Following is a summary of North American Coal results for the years ended December 31, 2013 and 2012:
|
| | | | | | | | | | | | | | | | | | | | | | | |
| (In Millions) |
| | | Change due to: | | |
| Year Ended
December 31, | | Revenue and cost rate | | Sales Volume | | Freight and reimburse-ment | | Total change |
| 2013 | | 2012 | | | | |
Revenues from product sales and services | $ | 821.9 |
| | $ | 881.1 |
| | $ | (135.1 | ) | | $ | 91.1 |
| | $ | (15.2 | ) | | $ | (59.2 | ) |
Cost of goods sold and operating expenses | (836.4 | ) | | (882.9 | ) | | 122.1 |
| | (90.8 | ) | | 15.2 |
| | 46.5 |
|
Sales margin | $ | (14.5 | ) | | $ | (1.8 | ) | | $ | (13.0 | ) | | $ | 0.3 |
| | $ | — |
| | $ | (12.7 | ) |
| | | | | | | | | | | |
| Year Ended December 31, | | | | | | | | |
Per Ton Information | 2013 | | 2012 | | Difference | | Percent change | | | | |
Realized product revenue rate1 | $ | 101.20 |
| | $ | 119.79 |
| | $ | (18.59 | ) | | (15.5 | )% | | | | |
Cash production cost | 75.27 |
| | 92.34 |
| | (17.07 | ) | | (18.5 | )% | | | | |
Non-production cash cost | 10.20 |
| | 12.65 |
| | (2.45 | ) | | (19.4 | )% | | | | |
Cost of goods sold and operating expenses rate1 (excluding DDA) | 85.47 |
| | 104.99 |
| | (19.52 | ) | | (18.6 | )% | | | | |
Depreciation, depletion & amortization | 17.72 |
| | 15.08 |
| | 2.64 |
| | 17.5 | % | | | | |
Total cost of goods sold and operating expenses rate | 103.19 |
| | 120.07 |
| | (16.88 | ) | | (14.1 | )% | | | | |
Sales margin | $ | (1.99 | ) | | $ | (0.28 | ) | | $ | (1.71 | ) | | n/m | | | | |
| | | | | | | | | | | |
Sales tons 2 (In thousands) | 7,274 |
| | 6,512 |
| | | | | | | | |
Production tons 2 (In thousands) | 7,221 |
| | 6,394 |
| | | | | | | | |
1 Excludes revenues and expenses related to domestic freight, which are offsetting and have no impact on sales margin. |
2 Tons are short tons (2,000 pounds). |
Sales margin for the North American Coal segment decreased to a loss of $14.5 million during the year ended December 31, 2013, compared to a sales margin loss of $1.8 million during the year ended December 31, 2012. Sales margin per ton decreased to a loss of $1.99 per ton in 2013 compared to a sales margin loss of $0.28 per ton in the prior year.
Revenues from product sales and services were $821.9 million, which is a decrease of $44.0 million over the prior-year period, excluding the decrease of $15.2 million of freight and reimbursements, predominantly due to:
| |
• | A decrease in our realized product revenue rate of $135.1 million or 15.5 percent on a per-ton basis for the year ended December 31, 2013. This decline is a result of: |
| |
◦ | The downward trend in market pricing period over period, including a 24 percent decrease in the quarterly benchmark price, partially mitigated by annually priced contracts, carryover contracts and product mix from our high-volatile metallurgical coal, |
| |
◦ | Slightly offset by a shift in product sales mix. The sales mix for low-volatile metallurgical, high-volatile metallurgical and thermal coal was 69.6 percent, 21.6 percent and 8.8 percent, respectively, in 2013 compared to 68.1 percent, 19.9 percent and 12.0 percent, respectively, for 2012. The total mix impact was favorable by $1 per ton based on the higher price of low-volatile coal and lower rates for thermal coal. |
| |
• | Partially offset by a sales volume increase of 762 thousand tons or 11.7 percent during the year ended December 31, 2013 in comparison to the prior year resulted in an increase in revenue of $91.1 million, primarily due to: |
| |
◦ | Increases in low-volatile and high-volatile metallurgical coal sales of 907 thousand tons in 2013 due to increased production volumes when compared to the prior year and the force majeure related to the April 2011 tornado that extended into April 2012, |
| |
◦ | Partially offset by a reduction in thermal coal sales of 145 thousand tons due to reduced market demand. |
Cost of goods sold and operating expenses in 2013 decreased $31.3 million, excluding the decrease of $15.2 million of freight and reimbursements from the prior year, predominantly as a result of:
| |
• | Decreased costs related to labor of approximately $40.0 million and maintenance and external services of approximately $75.0 million at our mines with full operating production in 2012 and 2013 due to reduced headcount, cost savings measures and more effective operating efficiency; and |
| |
• | Favorable variance in the lower-of-cost-or-market inventory charge of $13.3 million in comparison to the prior year as the lower-of-cost-or-market inventory charges at December 31, 2013 and 2012 were $11.1 million and $24.4 million, respectively, |
| |
• | Partially offset by higher sales volume attributable to additional low-volatile and high-volatile metallurgical coal sales, as discussed above, resulted in an additional $90.8 million of costs; and |
| |
• | The accelerated closure of the Dingess-Chilton mine during the first quarter of 2013 and Lower War Eagle mine moving into the production stage of mining in November 2012 resulted in the recording of $18.0 million or $2 per ton of additional depreciation and depletion during 2013. |
Production
Production of low- and high-volatile metallurgical coal increased 18.2 percent in 2013 compared to 2012. Low-volatile production increased 803 thousand tons over the prior year due to improved operating efficiency. High-volatile metallurgical coal production levels in 2013 increased 212 thousand tons or 16.3 percent as a result of the Lower War Eagle mine moving into production during the fourth quarter of 2012, offset partially by the closure of Dingess-Chilton during the first quarter of 2013. Beginning in the second quarter of 2012 and continuing through 2013, we experienced a decline in demand for thermal coal. Accordingly, over this time period, we reduced production at our thermal mine to one shift to align production with customer demands. This resulted in reduced production of 188 thousand tons in 2013 compared to 2012. Due to increased thermal coal demand in 2014, we increased production at our thermal coal mine to two shifts beginning in the first quarter of 2014 to align production with 2014 customer demand. In the fourth quarter of 2014, we sold our CLCC assets. Production tons at CLCC were 2.1 million tons and 2.1 million tons for the years ended December 31, 2013 and 2012, respectively, and are included in the production tons disclosed above.
Eastern Canadian Iron Ore
Following is a summary of Eastern Canadian Iron Ore results for the years ended December 31, 2013 and 2012:
|
| | | | | | | | | | | | | | | | | | | | | | | | | | | | | | | |
| (In Millions) |
| | | Change due to | | |
| Year Ended
December 31, | | Revenue and cost rate | | Sales Volume | | Idle cost / Production volume variance | | Inventory write-down | | Exchange Rate | | Total change |
| 2013 | | 2012 | | | | | | |
Revenues from product sales and services | $ | 978.7 |
| | $ | 1,008.9 |
| | $ | 27.7 |
| | $ | (57.9 | ) | | $ | — |
| | $ | — |
| | $ | — |
| | $ | (30.2 | ) |
Cost of goods sold and operating expenses | (1,082.0 | ) | | (1,130.3 | ) | | 32.1 |
| | 53.4 |
| | 26.3 |
| | (72.5 | ) | | 9.0 |
| | 48.3 |
|
Sales margin | $ | (103.3 | ) |
| $ | (121.4 | ) | | $ | 59.8 |
| | $ | (4.5 | ) | | $ | 26.3 |
| | $ | (72.5 | ) | | $ | 9.0 |
| | $ | 18.1 |
|
| | | | | | | | | | | | | | | |
| Year Ended December 31, | | | | | | | | | | | | |
Per Ton Information | 2013 | | 2012 | | Difference | | Percent change | | | | | | | | |
Realized product revenue rate | $ | 114.45 |
| | $ | 112.93 |
| | $ | 1.52 |
| | 1.3 | % | | | | | | | | |
Cash production cost | 91.68 |
| | 108.24 |
| | (16.56 | ) | | (15.3 | )% | | | | | | | | |
Non-production cash cost | 13.98 |
| | 0.35 |
| | 13.63 |
| | n/m | | | | | | | | |
Cost of goods sold and operating expenses rate (excluding DDA) | 105.66 |
| | 108.59 |
| | (2.93 | ) | | (2.7 | )% | | | | | | | | |
Depreciation, depletion & amortization | 20.87 |
| | 17.93 |
| | 2.94 |
| | 16.4 | % | | | | | | | | |
Total cost of goods sold and operating expenses rate | 126.53 |
| | 126.52 |
| | 0.01 |
| | — | % | | | | | | | | |
Sales margin | $ | (12.08 | ) | | $ | (13.59 | ) | | $ | 1.51 |
| | n/m | | | | | | | | |
| | | | | | | | | | | | | | | |
Bloom Lake sales tons | 5,665 |
| | 5,693 |
| | | | | | | | | | | | |
Wabush sales tons | 2,886 |
| | 3,241 |
| | | | | | | | | | | | |
Sales tons 1 (In thousands) | 8,551 |
| | 8,934 |
| | | | | | | | | | | | |
| | | | | | | | | | | | | | | |
Bloom Lake production tons | 5,877 |
| | 5,450 |
| | | | | | | | | | | | |
Wabush production tons | 2,778 |
| | 3,065 |
| | | | | | | | | | | | |
Production tons 1 (In thousands) | 8,655 |
| | 8,515 |
| | | | | | | | | | | | |
1 Tons are metric tons (2,205 pounds). |
We reported a sales margin loss for our Eastern Canadian Iron Ore segment of $103.3 million for the year ended December 31, 2013, compared with a sales margin loss of $121.4 million for the year ended December 31, 2012. Sales margin per ton improved to a loss of $12.08 per ton for the year ended December 31, 2013 compared to a sales margin loss of $13.59 per ton for 2012.
Revenue decreased by $30.2 million for the year ended December 31, 2013 when compared to prior year, primarily due to:
| |
• | Lower sales volumes of 383 thousand tons. The reduction in tons sold resulted in a decrease to revenue of $57.9 million, which was related primarily to the transition and idling of pellet production at Wabush as pellet sales decreased by 1.7 million tons period-over-period, offset partially by the sale of 1.4 million more metric tons of Wabush Scully mine sinter feed in 2013 compared with 2012, |
| |
• | Partially offset by the increase to the average revenue rate, which resulted in an increase of $27.7 million, driven by changes in spot market pricing offset by lower pellet premiums due to a shift in product mix, primarily as a result of: |
| |
◦ | An increase to the Platts 62 percent Fe spot rate to an average of $135 per metric ton from $130 per metric ton in the prior year resulted in an increase of $5 per metric ton; and |
| |
◦ | An increase due to favorable provisional pricing adjustments related to prior-year sales and higher premiums for iron content in comparison to the prior year, increasing the average revenue rate by $2 per metric ton and $1 per metric ton, respectively, |
| |
◦ | Offset by a change in product mix as our Eastern Canadian Iron Ore segment ceased pellet production at our Wabush facility in June 2013 and began producing only sinter feed until the Wabush facility was idled at the end of March 2014 and we began to implement the permanent closure plan for the minein the fourth quarter of 2014. During 2013, 17 percent of products sold were pellets, compared to 36 percent in the prior year, which resulted in the realized revenue rate decreasing by $4 per metric ton due to lower average pellet premiums; and |
| |
◦ | Further offset by timing impacts of a negative $2 per metric ton period over period, primarily due to approximately 300 thousand metric tons of carryover pellets that were in sold in 2012 and based on 2011 contract pricing, which was substantially higher due to 2011 full-year market pricing. |
Cost of goods sold and operating expenses during the year ended December 31, 2013 decreased from 2012 by $48.3 million primarily due to:
| |
• | Lower sales volumes at the Wabush and Bloom Lake facilities resulted in decreased costs of $50.3 million and $3.1 million, respectively, compared to the prior year; |
| |
• | Incremental idle production costs at our Wabush operations of $26.3 million in 2012 that did not recur in 2013; and |
| |
• | Favorable foreign exchange rate variances of $9.0 million, |
| |
• | Partially offset by inventory write-downs primarily at our Wabush facility of $68.0 million related to a supplies inventory write-down of $29.7 million, lower-of-cost-or-market charges of $19.8 million and unsaleable inventory impairment charges of $18.5 million recorded during 2013. |
Production
The Bloom Lake facility produced 5.9 million and 5.4 million metric tons of iron ore concentrate during the years ended December 31, 2013 and 2012, respectively. During the first quarter of 2014, we announced that we were exploring various strategic alternatives for our Bloom Lake mine. We continued to operate the Bloom Lake mine Phase I operations on a reduced tailings and water management capital plan throughout 2014 and the Phase II expansion remained on hold. In the fourth quarter of 2014, all production at Bloom Lake mine was halted and the mine transitioned to "care-and-maintenance" status.
Production at the Wabush facility was 2.8 million and 3.1 million metric tons during the years ended December 31, 2013 and 2012, respectively. Due to high production costs and lower pellet premium pricing, we idled production at our Pointe Noire iron ore pellet plant and transitioned to producing an iron ore concentrate product from our Wabush Scully mine during June 2013. At the end of March 2014, we idled our Wabush Scully mine in Newfoundland and Labrador and began to implement the permanent closure plan for the mine in the fourth quarter of 2014. The idle was driven by the unsustainable high cost structure, which resulted in operations that are not economically viable to run over time.
Liquidity, Cash Flows and Capital Resources
Our primary sources of liquidity are cash generated from our operating and financing activities. Our capital allocation process is focused on prioritizing all potential uses of future cash flows. We continue to focus on cash generation in our business operations as well as reductions of any discretionary expenditures in order to ensure we are positioned to face the challenges and uncertainties of the volatile pricing markets for our products.
Based on current mine plans and subject to future iron ore and coal prices and supply and demand, we expect our operating cash flows generated in 2015 to be sufficient to cover our budgeted capital expenditures and dividend requirements. Furthermore, we supplement this cash generation with adequate liquidity via financing arrangements to fund our normal business operations and strategic initiatives through our revolving credit agreement. During the fourth quarter of 2014, we generated positive cash flows from operations and were able to reduce our overall total debt less cash position by approximately $300 million, including the repurchase of $45 million aggregate principal amount of our senior notes. Additionally, in January 2015, we further reduced total debt by approximately $159 million through senior note repurchases in the open market with approximately $106 million of net proceeds from the sale of CLCC and cash
from operations. Based on current market conditions, we expect to be able to fund our requirements for at least the next 12 months.
As a result of the Bloom Lake Group commencing restructuring proceedings under the CCAA, the initial order obtained on January 27, 2015 addressed the Bloom Lake Group’s immediate liquidity issues by staying creditor claims and permitting the Bloom Lake Group to preserve and protect its assets for the benefit of all stakeholders while restructuring and/or sale options are explored. Certain obligations, including certain equipment loans, were guaranteed by Cliffs and totaled approximately $145 million. Through this court monitored process, we anticipate the restructuring and/or sale of the Bloom Lake Group assets may mitigate the impact of these obligations to Cliffs' liquidity during 2015. Cash and cash equivalents of the Bloom Lake Group were $17.2 million at December 31, 2014.
Refer to “Outlook” for additional guidance regarding expected future results, including projections on pricing, sales volume and production for our various businesses.
The following discussion summarizes the significant activities impacting our cash flows during 2014 as well as those expected to impact our future cash flows over the next 12 months. Refer to the Statements of Consolidated Cash Flows for additional information.
Operating Activities
Net cash provided by operating activities decreased to $358.9 million for the year ended December 31, 2014, compared to cash provided by operating activities of $1,145.9 million for 2013. The decrease in operating cash flows in 2014 were primarily due to lower operating results as previously discussed.
Net cash provided by operating activities improved to $1,145.9 million for the year ended December 31, 2013, compared to cash provided by operating activities of $514.5 million for 2012. The increase in operating cash flow in 2013 was primarily due to the timing of payments related to 2011 income taxes in early 2012, other changes in working capital and reduced exploration and selling, general and administrative costs.
We expect economic growth in the U.S. to continue in 2015, and correspondingly expect steel demand to remain at healthy levels. While the industry demand will be supported by an improving housing market and a strengthened automotive sector, demand from energy companies is expected to decrease as oil prices remain at depressed levels. Additionally, the steel industry should face continued pressure from surging imports, which reached record levels in 2014, as the strength of the U.S. dollar continues to increase and continued oversupply of the global steel industry. In China, demand for steel should increase slightly compared to 2014, although at a rate far below growth percentages recorded earlier in the decade. In 2014, the increase in seaborne supply of iron ore was expected by many, but the slowdown in demand from Chinese end markets was unexpected and negatively impacted spot prices for iron ore. We expect seaborne iron ore prices to remain pressured unless there are vast structural changes to the supply/demand picture, including increased Chinese demand or iron ore capacity cuts.
Coupled with efficient tax structures, our U.S. operations and our financing arrangements provide sufficient capital resources; however, if we were to repatriate earnings, we would be subject to income tax. Our U.S. cash and cash equivalents balance at December 31, 2014 was $136.1 million, or approximately 46.8 percent of our consolidated total cash and cash equivalents balance of $290.9 million. As of December 31, 2014 and 2013, we had no restrictions on our borrowing capacity of our U.S.-based revolving credit facility inclusive of the changes made through Amendment No. 6. Furthermore, historically we have been able to raise additional capital through private financings and public debt and equity offerings, the bulk of which, to date, have been U.S.-based. If the demand for our product weakens and/or pricing deteriorates for a prolonged period, we have the financial and operational flexibility to reduce production, delay capital expenditures, sell assets and reduce overhead costs to provide liquidity in the absence of cash flow from operations.
Investing Activities
Net cash used in investing activities was $103.6 million for the year ended December 31, 2014, compared with $811.3 million for 2013. We had capital expenditures of $284.1 million and $861.6 million for the years ended December 31, 2014 and 2013, respectively. Offsetting our investments in property, plant and equipment, during 2014, we had cash proceeds from investing activities of $155.0 million from the sale of CLCC.
Net cash used by investing activities was $811.3 million for the year ended December 31, 2013, compared with $961.8 million for 2012. We had capital expenditures of $861.6 million and $1,127.5 million for the years ended December 31, 2013 and 2012, respectively. Our main capital investment focus had been on the construction of the Bloom Lake mine's operations. On the ramp-up and expansion projects at Bloom Lake mine, we spent approximately $426 million and approximately $475 million during the years ended December 31, 2013 and 2012, respectively. In addition, the expenditures for the Bloom Lake tailings and water management system totaled $191 million and $99 million in 2013 and 2012, respectively.
Up until the first quarter of 2014, our main capital investment focus was on the construction of the Bloom Lake mine's operations, at which time we placed the Phase II expansion on hold. We subsequently determined that the Phase II expansion of the Bloom Lake mine was no longer a viable option for us and we shifted our focus to considering available possibilities and executing an exit option for Eastern Canadian Iron Ore operations that minimizes the cash outflows and associated liabilities. In December 2014, iron ore production at the Bloom Lake mine was suspended and the Bloom Lake mine was placed in ‘‘care-and-maintenance’’ mode. Prior to Bloom Lake mine entering "care and maintenance" mode, on the expansion projects at the Bloom Lake mine, we spent approximately $51 million and approximately $426 million during the years ended December 31, 2014 and 2013, respectively, which predominately relates to work performed in 2013. In addition, the expenditures for the Bloom Lake tailings and water management system totaled $92 million and $191 million in 2014 and 2013, respectively. Additionally, we spent approximately $140 million and $203 million globally on expenditures related to sustaining capital excluding the Bloom Lake tailings and water management in 2014 and 2013, respectively. Sustaining capital spend includes infrastructure, mobile equipment, environmental, safety, fixed equipment, product quality and health.
In alignment with our strategy to focus on allocating capital among key priorities related to liquidity management, and business investment, we anticipate total cash used for capital expenditures in 2015 to be approximately $125 million to $150 million.
Financing Activities
Net cash used by financing activities was $288.3 million for the year ended December 31, 2014, compared with $171.9 million for 2013. Net cash used includes dividend distributions of $143.7 million and $127.6 million for the years ended December 31, 2014 and 2013, respectively. Additionally, cash used by financing activities during 2014 included $28.8 million for the repurchase of senior notes and $20.9 million for the repayment of equipment loans. In 2013, we had net repayments under our credit facilities of $325.0 million, which was partially offset by cash provided by financing activities of $164.8 million from equipment loans. Additionally, we completed public offerings of 29.25 million depositary shares and 10.35 million common shares, resulting in net proceeds of $709.4 million and $285.3 million, respectively, after underwriting fees and discounts of which a portion of the net proceeds were used to repay the $847.1 million outstanding under the term loan.
Net cash used by financing activities during 2013 was $171.9 million, compared to net cash provided by financing activities of $119.6 million for 2012. Cash flows provided by financing activities during 2012 included $497.0 million in net proceeds from the issuance of the $500.0 million 3.95 percent senior notes, completed through a public offering in December 2012. A portion of the net proceeds from the senior notes offering was used on December 28, 2012 to repay the $270.0 million and $55.0 million aggregate principal amount of outstanding private placement senior notes and also for the repayment of a portion of the borrowings outstanding under the term loan facility and the revolving credit facility. In addition, we had net borrowings and repayments under the revolving credit facility of $325.0 million and cash calls from our joint venture partners resulted in net cash receipts of $95.4 million. Offsetting the proceeds from financing activities in 2012 were dividend distributions of $307.2 million and $124.8 million for term loan repayments.
On September 10, 2014, we announced that our Board of Directors approved a buy back of outstanding common shares in the open market or in private negotiated transactions up to a maximum of $200 million dollars. We are not obligated to make any purchases, and the repurchase program may be suspended or discontinued at any time. The authorization is active until December 31, 2015.
On January 26, 2015, we announced that our Board of Directors had decided to eliminate the quarterly dividend of $0.15 per share on our common shares. The decision is applicable to the first quarter of 2015 and all subsequent quarters. The elimination of the common share dividend provides us with additional free cash of approximately $92 million annually, which we intend to use for further debt reduction, including the repurchase of senior notes at a discount. We see accelerated debt reduction as a more effective means of protecting our shareholders than continuing to pay a common share dividend.
The following represents our future cash commitments and contractual obligations as of December 31, 2014:
|
| | | | | | | | | | | | | | | | | | | | |
| | Payments Due by Period 1 (In Millions) |
| | | | Less than | | 1 - 3 | | 3 - 5 | | More Than |
Contractual Obligations | | Total | | 1 Year | | Year | | Year | | 5 Years |
Long-term debt | | $ | 2,995.8 |
| | $ | 21.8 |
| | $ | 46.3 |
| | $ | 530.1 |
| | $ | 2,397.6 |
|
Interest on debt 2 | | 1,901.0 |
| | 163.0 |
| | 323.4 |
| | 278.6 |
| | 1,136.0 |
|
Operating lease obligations | | 51.2 |
| | 12.0 |
| | 17.7 |
| | 11.6 |
| | 9.9 |
|
Capital lease obligations | | 198.6 |
| | 84.8 |
| | 61.0 |
| | 31.8 |
| | 21.0 |
|
Purchase obligations: | | | | | | | | | | |
Open purchase orders | | 174.3 |
| | 144.9 |
| | 29.4 |
| | — |
| | — |
|
Minimum royalty payments | | 34.7 |
| | 2.8 |
| | 5.7 |
| | 15.3 |
| | 10.9 |
|
Minimum "take or pay" purchase commitments 3 | | 1,229.8 |
| | 382.7 |
| | 624.8 |
| | 148.6 |
| | 73.7 |
|
Total purchase obligations | | 1,438.8 |
| | 530.4 |
| | 659.9 |
| | 163.9 |
| | 84.6 |
|
Other long-term liabilities: | | | | | | | | | | |
Pension funding minimums | | 216.7 |
| | 42.5 |
| | 34.2 |
| | 73.8 |
| | 66.2 |
|
OPEB claim payments | | 461.7 |
| | 6.8 |
| | 13.6 |
| | 14.4 |
| | 426.9 |
|
Environmental and mine closure obligations | | 261.2 |
| | 5.2 |
| | 7.9 |
| | 55.3 |
| | 192.8 |
|
Personal injury | | 12.0 |
| | 4.0 |
| | 4.9 |
| | 0.4 |
| | 2.7 |
|
Total other long-term liabilities | | 951.6 |
| | 58.5 |
| | 60.6 |
| | 143.9 |
| | 688.6 |
|
Total | | $ | 7,537.0 |
| | $ | 870.5 |
| | $ | 1,168.9 |
| | $ | 1,159.9 |
| | $ | 4,337.7 |
|
| | | | | | | | | | |
1 Includes our consolidated obligations. |
2 For the $500 million senior notes, interest is calculated using a fixed rate of 3.95 percent from 2015 to maturity in January 2018. For the $400 million senior notes, interest is calculated using a fixed rate of 5.90 percent from 2015 to maturity in March 2020. For the $1.3 billion senior notes, interest is calculated for the $500 million 10-year notes using a fixed rate of 4.80 percent from 2015 to maturity in October 2020, and the $800 million 30-year notes using a fixed rate of 6.25 percent from 2015 to maturity in October 2040. For the $700 million senior notes, interest is calculated using a fixed rate of 4.875 percent from 2015 to maturity in April 2021. For the $140.8 million of equipment loans, interest is calculated using the fixed rate associated with each of the equipment loans from 2015 to maturity in 2020. |
3 Includes minimum railroad transportation obligations, minimum electric power demand charges, minimum coal, diesel and natural gas obligations and minimum port facility obligations. |
The above table does not reflect $74.7 million of unrecognized tax benefits, which we have recorded for uncertain tax positions as we are unable to determine a reasonable and reliable estimate of the timing of future payments. Included in the above table are the cash commitments and contractual obligations associated with the Bloom Lake Group that have been included in the CCAA filing, most of which we believe will be treated as unsecured claims. Because of the uncertainty of the CCAA process, we are unable to determine a reasonable and reliable estimate of amounts and timing of future payments related to the obligations of the Bloom Lake Group.
Refer to NOTE 20 - COMMITMENTS AND CONTINGENCIES of the Consolidated Financial Statements for additional information regarding our future commitments and obligations.
Capital Resources
We expect to fund our business obligations from available cash, current and future operations and existing borrowing arrangements. We also may pursue other funding strategies in the capital markets to strengthen our liquidity. The following represents a summary of key liquidity measures as of December 31, 2014 and December 31, 2013:
|
| | | | | | | |
| (In Millions) |
| December 31,
2014 | | December 31, 2013 |
Cash and cash equivalents | $ | 290.9 |
| | $ | 335.5 |
|
Available revolving credit facility | $ | 1,125.0 |
| | $ | 1,750.0 |
|
Revolving loans drawn | — |
| | — |
|
Senior notes | 2,855.0 |
| | 2,900.0 |
|
Senior notes drawn | (2,855.0 | ) | | (2,900.0 | ) |
Letter of credit obligations and other commitments | (149.5 | ) | | (8.4 | ) |
Borrowing capacity available | $ | 975.5 |
| | $ | 1,741.6 |
|
Our primary source of funding is our revolving credit facility, which matures on October 16, 2017. We also have cash on hand, generated by the business, which totaled $290.9 million as of December 31, 2014. The combination of cash and availability under the credit facility gave us approximately $1.3 billion in liquidity entering the first quarter of 2015, which is expected to be used to fund operations and capital expenditures. As noted below, however, the availability under our revolving credit agreement was reduced to $900 million in January 2015 and will be reduced to $750 million on May 31, 2015.
On January 22, 2015, we amended the revolving credit agreement (Amendment No. 6) to effect the following:
| |
• | Reduces the size of the existing facility from $1.125 billion to $900 million at the closing of this amendment with a further reduction to $750 million on May 31, 2015. |
| |
• | Permits certain of our subsidiaries and joint ventures related to our Canadian operations (collectively, the "Canadian Entities") to enter into a restructuring (the "Canadian Restructuring"). |
| |
• | Permits costs and expenses incurred in connection with the Canadian Restructuring in an amount not to exceed $75 million to be added back to the calculation of EBITDA. |
| |
• | Adds limitations with respect to investments in the Canadian Entities after the Canadian Restructuring. |
| |
• | Adds limitations on the guaranty of indebtness of a Canadian Entity by us or our subsidiaries (other than by another Canadian Entity). |
| |
• | Permits additional liens on the assets of the Canadian Entities. |
| |
• | Reduces the permitted amount of quarterly dividends on our common shares to not more than $0.01 per share in any fiscal quarter. |
| |
• | Grants a security interest in our as-extracted collateral and certain of our subsidiaries. |
| |
• | Excludes certain indebtness and obligations of the Canadian Entities from the representations, covenants and events of default. |
The amended facility retains substantial financial flexibility for management to execute our strategy and provides us a consistent source of liquidity.
On October 24, 2014, we amended the revolving credit agreement (Amendment No 5.) to effect the following:
| |
• | Reduces the size of the existing facility from $1.250 billion to $1.125 billion. |
| |
• | Grants a valid and perfected first-priority (subject to certain permitted liens) security interest in certain property and assets of the Company and certain of its subsidiaries, subject to customary exclusions all specified in a security agreement. |
| |
• | With effect as of September 30, 2014, removes the maximum balance sheet leverage ratio of debt to capitalization of less than 45 percent, which was a covenant introduced in June 2014, and replaces that covenant with a maximum leverage ratio covenant of secured debt to EBITDA that is not to exceed 3.5 times. |
| |
• | Retains the minimum interest coverage ratio requirement of 3.5 times, and was subsequently reduced to 2.0 times upon completion of certain collateral actions within 60 days of the execution of the amendment. The collateral requirements were satisfied as of December 23, 2014. |
| |
• | Subjects restricted payments (including the $200 million share repurchase, which was approved in September 2014) and current dividend structure to a $400 million liquidity test. |
| |
• | Adds limitations regarding acquisitions, investments (including investments in non-wholly owned subsidiaries and joint ventures) and subsidiary debt. |
| |
• | Eliminates the accounts receivable securitization facility. |
| |
• | Terminates the ability to have foreign borrowers under the revolving credit agreement. |
The amended facility retains substantial financial flexibility for management to execute our strategy and provides us a consistent source of liquidity.
On September 9, 2014, we amended the revolving credit agreement (Amendment No. 4) to effect the following:
| |
• | Permitting a one-time exemption of up to $200 million in share repurchases (consummated in a single transaction or series of related transactions), effective until December 31, 2015. We are not obligated to make any purchases and the program may be suspended or discontinued at any time. |
| |
• | Reducing the size of the existing unsecured facility from $1.75 billion to $1.25 billion. |
| |
• | Adding restrictions on the granting of certain pledges and guarantees. |
| |
• | Adding an obligation to enter into a security agreement, on or before June 30, 2015, to grant security interests to secure obligations under the revolving credit agreement on U.S. receivables and inventory, other than receivables and related property subject to certain existing receivable securitization or other facilities, a pledge of 65 percent of the stock of all material, wholly-owned first-tier foreign subsidiaries and a pledge of all of the stock of all material U.S. subsidiaries, in each case, subject to certain limitations. |
All terms of Amendment No. 3 as of June 30, 2014, as discussed below, remained in place and were not changed by Amendment No. 4 as of September 9, 2014.
On June 30, 2014, we amended the revolving credit agreement (Amendment No. 3) to effect the following:
| |
• | Replacing the current maximum leverage covenant ratio of debt to earnings of less than 3.5 times with a maximum balance sheet leverage ratio of debt to capitalization of less than 45 percent. |
| |
• | Resetting the minimum interest coverage ratio from 2.5 to 1.0 to the ratio of 3.5 to 1.0. |
| |
• | Amending the definition of EBITDA to include certain cash charges related to the Company’s Wabush mine and other cash restructuring charges and the definition of net worth to exclude up to $1 billion in non-cash impairment charges. |
| |
• | Modifying the covenants restricting certain investments and acquisitions, the incurrence of certain indebtedness and liens, and the amount of dividends that may be declared or paid and shares that may be repurchased. |
As of December 31, 2014 and 2013, we were in compliance with all applicable financial covenants related to the revolving credit agreement.
Although we believe that the revolving credit agreement provides us sufficient liquidity to support our operating and investing activities, we continue to refine our capital structure to achieve an optimal mix and level of debt, equity and other prudent financing arrangements. Several credit markets may provide additional capacity should that become necessary. The bank market may provide funding through a secured credit facility, term loan or bridge loan. Additionally, we have access to the bond market as a source of capital. The risk associated with these credit markets is a significant increase in borrowing costs as a result of limited capacity and market conditions.
As we have previously disclosed, we have contemplated replacing our revolving credit facility with a secured asset-based revolving credit facility, and we are currently in discussions with lenders about putting such a facility in place. We cannot guarantee that we will be successful in obtaining an asset-based revolving credit facility on commercially acceptable terms or at all.
We intend from time to time to seek to retire or purchase our outstanding senior notes with cash on hand, borrowings from existing credit sources or new debt financings and/or exchanges for debt or equity securities, in open market purchases, privately negotiated transactions or otherwise. Such repurchases, if any, will depend on prevailing market conditions, our liquidity requirements, contractual restrictions and other factors, and the amounts involved may be material.
Off-Balance Sheet Arrangements
In the normal course of business, we are a party to certain off-balance sheet arrangements. These arrangements include minimum "take or pay" purchase commitments, such as minimum electric power demand charges, minimum coal, diesel and natural gas purchase commitments, minimum railroad transportation commitments and minimum port facility usage commitments; financial instruments with off-balance sheet risk, such as bank letters of credit and bank guarantees; and operating leases, which primarily relate to equipment and office space. Liabilities related to these arrangements are not reflected on our Statements of Consolidated Financial Position. However, the underlying obligations that they secure, such as asset retirement obligations, self-insured workers' compensation liabilities, royalty obligations and certain post-retirement benefit obligations, are reflected in our Statements of Consolidated Financial Position.
We may be required to provide financial assurance in order to perform the post-mining reclamation required by our mining permits, pay our production royalties, pay workers' compensation claims under self-insured workers' compensation laws in various states, pay retiree benefits and perform certain other obligations. In order to provide the required financial assurance, we generally use surety bonds and/or letters of credit, and, effective with Amendment No. 5 to the revolving credit agreement, letters of credit are primarily issued under our revolving credit facility. Previously we had an unsecured, uncommitted letter of credit line with Scotiabank. With the recent credit rating downgrades, we experienced an increase in requests for financial assurance to be provided. Additionally, with the Bloom Lake Group CCAA filing, approximately $15 million of surety bonds and letters of credit backing obligations have been called and settled in cash in early 2015.
Market Risks
We are subject to a variety of risks, including those caused by changes in commodity prices, foreign currency exchange rates and interest rates. We have established policies and procedures to manage such risks; however, certain risks are beyond our control.
Pricing Risks
Commodity Price Risk
Our consolidated revenues include the sale of iron ore pellets, iron ore concentrate, iron ore lump and fines, low-volatile metallurgical coal, high-volatile metallurgical coal and thermal coal. However, during the fourth quarter of 2014, we sold our high-volatile metallurgical coal and thermal coal mines in the sale of the CLCC assets. The sale of the CLCC assets closed on December 31, 2014, and therefore beyond 2014, we will no longer have revenues associated with high-volatile metallurgical coal and thermal coal. Our financial results can vary significantly as a result of fluctuations in the market prices of iron ore and coal. World market prices for these commodities have fluctuated historically and are affected by numerous factors beyond our control. The world market price that most commonly is utilized in our iron ore sales contracts is the Platts 62 percent Fe fines spot rate pricing, which can fluctuate widely due to numerous factors, such as global economic growth or contraction, change in demand for steel or changes in availability of supply.
Provisional Pricing Arrangements
Certain of our U.S. Iron Ore, Asia Pacific Iron Ore and Eastern Canadian Iron Ore customer supply agreements specify provisional price calculations, where the pricing mechanisms generally are based on market pricing, with the final revenue rate to be based on market inputs at a specified point in time in the future, per the terms of the supply agreements. The difference between the provisionally agreed-upon price and the estimated final revenue rate is characterized as a derivative and is required to be accounted for separately once the revenue has been recognized. The derivative instrument is adjusted to fair value through Product revenues each reporting period based upon current market data and forward-looking estimates provided by management until the final revenue rate is determined.
At December 31, 2014, we have recorded $11.8 million as derivative liabilities included in Other current liabilities in the Statements of Consolidated Financial Position related to our estimate of final sales rate with our U.S. Iron Ore, Asia Pacific Iron Ore and Eastern Canadian Iron Ore customers. These amounts represent the difference between the provisional price agreed upon with our customers based on the supply agreement terms and our estimate of the final sales rate based on the price calculations established in the supply agreements. As a result, we recognized a net $11.8 million decrease, respectively, in Product revenues in the Statements of Consolidated Operations for the year ended December 31, 2014 related to these arrangements.
Customer Supply Agreements
Certain supply agreements with one U.S. Iron Ore customer provide for supplemental revenue or refunds based on the customer’s average annual steel pricing at the time the product is consumed in the customer’s blast furnace. The supplemental pricing is characterized as a freestanding derivative, which is finalized based on a future price, and is adjusted to fair value as a revenue adjustment each reporting period until the pellets are consumed and the amounts are settled. The fair value of the instrument is determined using an income approach based on an estimate of the annual realized price of hot-rolled steel at the steelmaker’s facilities.
At December 31, 2014, we had a derivative asset of $63.2 million, representing the fair value of the pricing factors, based upon the amount of unconsumed tons and an estimated average hot-band steel price related to the period in which the tons are expected to be consumed in the customer’s blast furnace at each respective steelmaking facility, subject to final pricing at a future date. This compares with a derivative asset of $55.8 million as of December 31, 2013. As an example, we estimate that a $75 change in the average hot-band steel price realized from the December 31, 2014 estimated price recorded would cause the fair value of the derivative instrument to increase or decrease by approximately $8.8 million, thereby impacting our consolidated revenues by the same amount.
We have not entered into any hedging programs to mitigate the risk of adverse price fluctuations; however, certain of our term supply agreements contained price collars, which typically limit the percentage increase or decrease in prices for our products during any given year.
Volatile Energy and Fuel Costs
The volatile cost of energy is an important issue affecting our production costs, primarily in relation to our iron ore operations. Our consolidated U.S. Iron Ore mining ventures consumed approximately 20.4 million MMBtu’s of natural gas at an average delivered price of $6.31 per MMBtu and 29.3 million gallons of diesel fuel at an average delivered price of $3.11 per gallon during 2014. Consumption of diesel fuel by our Asia Pacific operations was approximately 14.7 million gallons at an average delivered price of $3.19 per gallon for the same period. Our consolidated Eastern Canadian Iron Ore mining ventures consumed approximately 7.6 million gallons of diesel fuel at an average delivered price of $4.03 per gallon during 2014. We would not anticipate significant consumption of fuel at our consolidated Eastern Canadian Iron Ore facilities during 2015 as a result our of strategy to execute an exit option for Eastern Canadian Iron Ore operations during 2015. Our CLCC operations consumed approximately 3.4 million gallons of diesel fuel at an average delivered price of $3.49 per gallon during 2014. Our CLCC assets were sold in fourth quarter of 2014 with the sale closing on December 31, 2014.
In the ordinary course of business, there also will be likely increases in prices relative to electrical costs at our U.S. mine sites. Specifically, our Tilden and Empire mines in Michigan have made the decision to return to regulated utility service with WE Energies effective February 1, 2015, which we estimate will result in an increase of approximately $5 per MWh over our average 2014 rates. As the cost of producing electricity increases, the utility companies regularly seek to reclaim those costs from the mine sites, which often results in tariff disputes.
Our strategy to address increasing energy rates includes improving efficiency in energy usage, identifying alternative providers and utilizing the lowest cost alternative fuels. A pilot energy hedging program has been implemented in order to manage the price risk of diesel and natural gas at our U.S. Iron Ore mines. This pilot program only affects the period of January through April of 2015. Based on the results of this pilot program, a more structured hedging program may be implemented in the future. We will continue to monitor relevant energy markets for risk mitigation opportunities and may make additional forward purchases or employ other hedging instruments in the future as warranted and deemed appropriate by management. Assuming we do not enter into further hedging activity in the near term, a 10 percent change in electrical, natural gas and diesel fuel prices would result in a change of approximately $39.5 million in our annual fuel and energy cost based on expected consumption for 2015.
Foreign Currency Exchange Rate Risk
We are subject to changes in foreign currency exchange rates primarily as a result of our operations in Australia and Canada, which could impact our financial condition. With respect to Australia, foreign exchange risk arises from our exposure to fluctuations in foreign currency exchange rates because our reporting currency is the U.S. dollar, but the functional currency of our Asia Pacific operations is the Australian dollar. Our Asia Pacific operations receive funds in U.S. currency for their iron ore sales and incur costs in Australian currency. For our Canadian operations, the functional currency is the U.S. dollar; however, most costs for these operations primarily are incurred in the Canadian dollar. The primary objective for the use of foreign exchange rate contracts is to reduce exposure to changes in Australian and U.S. currency exchange rates and Canadian and U.S. currency exchange rates, respectively, and to protect against undue adverse movement in these exchange rates.
At December 31, 2014, we had outstanding Australian foreign currency exchange rate contracts with notional amounts of $220.0 million with varying maturity dates ranging from January 2015 to October 2015 for which we elected hedge accounting. To evaluate the effectiveness of our hedges, we conduct sensitivity analysis. A 10 percent increase in the value of the Australian dollar from the month-end rate would increase the fair value of these contracts to approximately negative $1.6 million, and a 10 percent decrease would reduce the fair value to approximately negative $41.3 million. At December 31, 2014, we had no outstanding Canadian foreign currency exchange rate contracts for which we elected hedge accounting. In the fourth quarter of 2014, all outstanding Canadian foreign exchange rate contracts were de-designated and hedge accounting was discontinued. As a result of discontinued hedge accounting, the instruments are marked to fair value each reporting period through Cost of goods sold and operating expenses on the Statements of Consolidated Operations. We do not intend to enter into Canadian foreign exchange rate hedging contracts going forward. Refer to NOTE 13 - DERIVATIVE INSTRUMENTS AND HEDGING ACTIVITIES for further discussion of the de-designation of the Canadian foreign currency exchange contracts. In the future, we may enter into additional hedging instruments as needed in order to further hedge our exposure to changes in foreign currency exchange rates.
The following table represents our foreign currency exchange contract position for contracts held as cash flow hedges as of December 31, 2014:
|
| | | | | | | | | | | | | |
| ($ in Millions) |
Contract Maturity | Notional Amount | | Weighted Average Exchange Rate | | Spot Rate | | Fair Value |
Contract Portfolio 1 : | | | | | | | |
AUD Contracts expiring in the next 12 months | $ | 220.0 |
| | 0.90 |
| | 0.8175 |
| | $ | (21.6 | ) |
1 Includes collar options and forward contracts. |
Refer to NOTE 13 - DERIVATIVE INSTRUMENTS AND HEDGING ACTIVITIES for further information.
Interest Rate Risk
Interest payable on our senior notes is at fixed rates. Interest payable under our revolving credit facility is at a variable rate based upon the base rate or the LIBOR rate plus a margin depending on a leverage ratio. As of December 31, 2014, we had no amounts drawn on the revolving credit facility.
The interest rate payable on the $500 million 3.95 percent senior notes due 2018 may be subject to adjustments from time to time if either Moody's or S&P or, in either case, any substitute rating agency thereof downgrades (or subsequently upgrades) the debt rating assigned to the notes. In no event shall (1) the interest rate for the notes be reduced to below the interest rate payable on the notes on the date of the initial issuance of notes or (2) the total increase in the interest rate on the notes exceed 2.00 percent above the interest rate payable on the notes on the date of the initial issuance of notes. The interest rate payable on the $500 million 3.95 percent senior notes was increased to 5.95 percent based on continued Substitute Rating Agency downgrades in January 2015. The maximum rate increase of 2.00 percent for the interest rate payable on the notes will result in an additional interest expense of $10.0 million per annum.
Supply Concentration Risks
Many of our mines are dependent on one source each of electric power and natural gas. A significant interruption or change in service or rates from our energy suppliers could impact materially our production costs, margins and profitability.
Outlook
Beginning in 2015, in order to provide more financial transparency to our stakeholders, we will be providing full-year expected revenues-per-ton ranges based on different assumptions of seaborne iron ore prices. We indicated that each different pricing assumption holds all other assumptions constant, including customer mix, as well as industrial commodity prices, freight rates, energy prices, production input costs and/or hot-band steel prices (all factors contained in certain of our supply agreements).
We previously furnished 2015 pricing expectations in a Current Report on Form 8-K filed on November 19, 2014. Due to the significant decline in both hot-band steel and energy prices, we have since lowered our assumptions with respect to these contract inputs. Below are the updated 2015 pricing expectations in a Current Report on Form 8-K filed on February 3, 2015.
|
| | | | | |
2015 Full-Year Realized Revenues-Per-Ton Range Summary |
Platts IODEX (1) | | U.S. Iron Ore (2) | | Asia Pacific Iron Ore (3) |
$50 | | $75 - $80 | | $30 - $35 |
$55 | | $80 - $85 | | $35 - $40 |
$60 | | $80 - $85 | | $40 - $45 |
$65 | | $80 - $85 | | $45 - $50 |
$70 | | $80 - $85 | | $50 - $55 |
$75 | | $80 - $85 | | $55 - $60 |
$80 | | $85 - $90 | | $60 - $65 |
(1) | The Platts IODEX is the benchmark assessment based on a standard specification of iron ore fines with 62 percent iron content (C.F.R. China). |
(2) | U.S. Iron Ore tons are reported in long tons of pellets. |
(3) | Asia Pacific Iron Ore tons are reported in metric tons of lumps and fines, F.O.B. the port. |
U.S. Iron Ore Outlook (Long Tons)
For 2015, we expect full-year sales and production volume of approximately 22 million tons from our U.S. Iron Ore business. As previously disclosed, we do not plan to export any pellets out of the Great Lakes in 2015.
Our full-year 2015 U.S. Iron Ore cash production cost expectation is $55 - $60 per ton. Our cash cost of goods sold per ton expectation is $60 - $65. This expectation reflects operational improvements including reduced headcount, more efficient maintenance practices and improvements in logistics. Depreciation, depletion and amortization for full-year 2015 is expected to be approximately $5 per ton.
Asia Pacific Iron Ore Outlook (Metric Tons, F.O.B. the port)
Our full-year 2015 Asia Pacific Iron Ore expected sales and production volume is approximately 11 million tons. The product mix is expected to be approximately 51 percent lump and 49 percent fines iron ore. This expectation assumes no divestiture of this business in 2015, which may or may not occur.
Based on an average exchange rate of $0.81 U.S. Dollar to Australian Dollar, full-year 2015 Asia Pacific Iron Ore cash production cost per ton is expected to be approximately $40 - $45. Cash cost of goods sold per ton is also expected to be $40 - $45. This expectation reflects operational improvements and a more favorable foreign exchange rate compared to 2014. We indicated that for every $0.01 change in this exchange rate on a full-year basis, our cash cost of goods sold is impacted by approximately $7 million.
We anticipate depreciation, depletion and amortization to be approximately $2 per ton for full-year 2015.
North American Coal Outlook (Short Tons, F.O.B. the mine)
Our full-year 2015 North American Coal expected sales and production volume is approximately 5.5 million tons of low-volatile metallurgical coal from the two remaining mines, Pinnacle and Oak Grove. This expectation assumes no additional divestiture of this business in 2015, which may or may not occur.
Our full-year 2015 North American Coal revenues-per-ton outlook is $70 - $75. We have approximately 41 percent of our expected 2015 sales volume committed and priced at approximately $77 per short ton at the mine.
Our full-year 2015 North American Coal cash production cost expectation is $65 - $70 per ton. Our cash cost of goods sold per ton expectation is $70 - $75. Full-year 2015 depreciation, depletion and amortization is expected to be approximately $2 per ton.
The following table provides a summary of the 2015 guidance for our three remaining business segments:
|
| | | | | | |
| | 2015 Outlook Summary |
| | U.S. Iron Ore (A) | Asia Pacific Iron Ore (B) | North American Coal (C) |
Sales volume (million tons) | 22 | | 11 | | 5.5 |
Production volume (million tons) | 22 | | 11 | | 5.5 |
Cash production cost per ton | $55 - $60 | | $40 - $45 | | $65 - $70 |
Cash cost of goods sold per ton | $60 - $65 | | $40 - $45 | | $70 - $75 |
DD&A per ton | $5 | | $2 | | $2 |
| | | | | | |
(A) | U.S. Iron Ore tons are reported in long tons of pellets. |
(B) | Asia Pacific Iron Ore tons are reported in metric tons of lumps and fines. |
(C) | North American Coal tons are reported in short tons. |
Cash production cost and cash cost of goods sold per ton are non-GAAP financial measures that management uses in evaluating operating performance. The presentation of these measures is not intended to be considered in isolation from, as a substitute for, or as superior to, the financial information prepared and presented in accordance with U.S. GAAP. The presentation of these measures may be different from non-GAAP financial measures used by other companies. Cash production cost per ton is defined as cost of goods sold and operating expenses per ton less depreciation, depletion and amortization; as well as period costs, costs of services and inventory effects per ton. Cash cost per ton is defined as cost of goods sold and operating expenses per ton less depreciation, depletion and amortization per ton.
SG&A Expenses and Other Expectations
We are reducing our year-over-year SG&A expenses by approximately $70 million. Full-year 2015 SG&A expenses are expected to be approximately $140 million. The decrease is primarily driven by a reduction in headcount and reduced outside services spending as a result of a smaller global footprint. Cliffs' full-year cash outflow expectation for exploration spending is expected to be less than $5 million.
Consolidated full-year 2015 depreciation, depletion and amortization is expected to be approximately $150 million.
Capital Budget Update
We expect our full-year 2015 capital expenditures budget to be $125 - $150 million.
Recently Issued Accounting Pronouncements
Refer to NOTE 1 - BASIS OF PRESENTATION AND SIGNIFICANT ACCOUNTING POLICIES of the consolidated financial statements for a description of recent accounting pronouncements, including the respective dates of adoption and effects on results of operations and financial condition.
Critical Accounting Estimates
Management's discussion and analysis of financial condition and results of operations is based on our consolidated financial statements, which have been prepared in accordance with GAAP. Preparation of financial statements requires management to make assumptions, estimates and judgments that affect the reported amounts of assets, liabilities, revenues, costs and expenses, and the related disclosures of contingencies. Management bases its estimates on various assumptions and historical experience, which are believed to be reasonable; however, due to the inherent nature of estimates, actual results may differ significantly due to changed conditions or assumptions. On a regular basis, management reviews the accounting policies, assumptions, estimates and judgments to ensure that our financial statements are fairly presented in accordance with GAAP. However, because future events and their effects cannot be determined with certainty, actual results could differ from our assumptions and estimates, and such differences could be material. Management believes that the following critical accounting estimates and judgments have a significant impact on our financial statements.
Revenue Recognition
U.S. Iron Ore and Asia Pacific Iron Ore Provisional Pricing Arrangements
Most of our U.S. Iron Ore long-term supply agreements are comprised of a base price with annual price adjustment factors. The base price is the primary component of the purchase price for each contract. The inflation-indexed price adjustment factors are integral to the iron ore supply contracts and vary based on the agreement, but typically include adjustments based upon changes in benchmark and international pellet prices and changes in specified Producers Price Indices, including those for industrial commodities excluding fuel, cold rolled steel and strip, and fuel and related products. The pricing adjustments generally operate in the same manner, with each factor typically comprising a portion of the price adjustment, although the weighting of each factor varies based upon the specific terms of each agreement. In most cases, these adjustment factors have not been finalized at the time our product is sold. In these cases, we historically have estimated the adjustment factors at each reporting period based upon the best third-party information available. The estimates are then adjusted to actual when the information has been finalized.
The Producer Price Indices remain an estimated component of the sales price throughout the contract year and are estimated each quarter using publicly available forecasts of such indices. The final indices referenced in certain of the U.S. Iron Ore supply contracts typically are not published by the U.S. Department of Labor until the second quarter of the subsequent year. As a result, we record an adjustment for the difference between the fourth quarter estimate and the final price in the following year.
Throughout the year, certain of our Asia Pacific Iron Ore customers have contract arrangements in which pricing settlements are based upon an average benchmark pricing for future periods. Most of the future periods are settled within three months. To the extent the particular pricing settlement period is subsequent to the reporting period, we estimate the final pricing settlement based upon information available. Similar to U.S. Iron Ore, the estimates are then adjusted to actual when the price settlement period elapses.
Historically, provisional pricing arrangement adjustments have not been material as they have represented less than half of one percent of U.S., Eastern Canadian and Asia Pacific Iron Ore's respective revenues for each of the three preceding fiscal years ended December 31, 2014, 2013 and 2012.
U.S. Iron Ore Customer Supply Agreements
In addition, certain supply agreements with one U.S. Iron Ore customer include provisions for supplemental revenue or refunds based on the customer's average annual steel pricing for the year that the product is consumed in the customer's blast furnaces. The supplemental pricing is characterized as a freestanding derivative and is required to be accounted for separately once the product is shipped. The derivative instrument, which is finalized based on a future price, is marked to fair value as a revenue adjustment each reporting period until the pellets are consumed and the amounts are settled. The fair value of the instrument is determined using a market approach based on an estimate of the annual realized price of hot rolled steel at the steelmaker's facilities, and takes into consideration current market conditions and nonperformance risk. At December 31, 2014, we had a derivative asset of $63.2 million, representing the fair value of the pricing factors, based upon the amount of unconsumed tons and an estimated average hot band steel price related to the period in which the tons are expected to be consumed in the customer's blast furnace at each respective steelmaking facility, subject to final pricing at a future date. This compares with a derivative asset of $55.8 million as of December 31, 2013, based upon the amount of unconsumed tons and the related estimated average hot band steel price.
The customer's average annual price is not known at the time of sale and the actual price is received on a delayed basis at the end of the year, once the average annual price has been finalized. As a result, we estimate the average price and adjust the estimate to actual in the fourth quarter when the information is provided by the customer at the end of each year. Information used in developing the estimate includes such factors as production and pricing information from the customer, current spot prices, third-party analyst forecasts, publications and other industry information. The accuracy of our estimates typically increases as the year progresses based on additional information in the market becoming available and the customer's ability to more accurately determine the average price it will realize for the year. The following represents the historical accuracy of our pricing estimates related to the derivative as well as the impact on revenue resulting from the difference between the estimated price and the actual price for each quarter during 2014, 2013 and 2012 prior to receiving final information from the customer for tons consumed during each year:
|
| | | | | | | | | | | | | | | | | | | | | | | | | | | | | | | | | | | | |
| | 2014 | | 2013 | | 2012 |
| | Final Price | | Estimated Price | | Impact on Revenue (in millions) | | Final Price | | Estimated Price | | Impact on Revenue (in millions) | | Final Price | | Estimated Price | | Impact on Revenue (in millions) |
First Quarter | |
| $651 |
| |
| $645 |
| |
| $1.5 |
| |
| $622 |
| |
| $630 |
| |
| ($1.2 | ) | |
| $650 |
| |
| $698 |
| |
| ($9.8 | ) |
Second Quarter | | 651 |
| | 650 |
| | 2.7 |
| | 622 |
| | 614 |
| | 3.0 |
| | 650 |
| | 678 |
| | (7.9 | ) |
Third Quarter | | 651 |
| | 653 |
| | (3.4 | ) | | 622 |
| | 633 |
| | (2.1 | ) | | 650 |
| | 663 |
| | (3.3 | ) |
Fourth Quarter | | 651 |
| | 651 |
| | — |
| | 622 |
| | 622 |
| | — |
| | 650 |
| | 650 |
| | — |
|
As an example, we estimate that a $75 change in the average hot band steel price realized from the December 31, 2014 estimated price recorded for the unconsumed tons remaining at year end would cause the fair value of the derivative instrument to increase or decrease by approximately $8.8 million, thereby impacting our consolidated revenues by the same amount.
Mineral Reserves
We regularly evaluate our economic mineral reserves and update them as required in accordance with SEC Industry Guide 7. The estimated mineral reserves could be affected by future industry conditions, geological conditions and ongoing mine planning. Maintenance of effective production capacity of the mineral reserve could require increases in capital and development expenditures. Generally, as mining operations progress, haul lengths and lifts increase. Alternatively, changes in economic conditions or the expected quality of mineral reserves could decrease capacity or mineral reserves. Technological progress could alleviate such factors or increase capacity of mineral reserves.
We use our mineral reserve estimates, combined with our estimated annual production levels, to determine the mine closure dates utilized in recording the fair value liability for asset retirement obligations. Refer to NOTE 11 - ENVIRONMENTAL AND MINE CLOSURE OBLIGATIONS, for further information. Since the liability represents the present value of the expected future obligation, a significant change in mineral reserves or mine lives would have a substantial effect on the recorded obligation. We also utilize economic mineral reserves for evaluating potential impairments of mine assets and in determining maximum useful lives utilized to calculate depreciation and amortization of long-lived mine assets. Increases or decreases in mineral reserves or mine lives could significantly affect these items.
Asset Retirement Obligations and Environmental Remediation Costs
The accrued mine closure obligations for our active mining operations provide for contractual and legal obligations associated with the eventual closure of the mining operations. Our obligations are determined based on detailed estimates adjusted for factors that a market participant would consider (i.e., inflation, overhead and profit), which are escalated at an assumed rate of inflation to the estimated closure dates, and then discounted using the current credit-adjusted risk-free interest rate. The estimate also incorporates incremental increases in the closure cost estimates and changes in estimates of mine lives. The closure date for each location is determined based on the exhaustion date of the remaining iron ore reserves, which is dependent on our estimate of the economically recoverable mineral reserves. The estimated obligations are particularly sensitive to the impact of changes in mine lives given the difference between the inflation and discount rates. Changes in the base estimates of legal and contractual closure costs due to changes in legal or contractual requirements, available technology, inflation, overhead or profit rates also would have a significant impact on the recorded obligations.
We have a formal policy for environmental protection and restoration. Our obligations for known environmental matters at active and closed mining operations and other sites have been recognized based on estimates of the cost of investigation and remediation at each site. If the obligation can only be estimated as a range of possible amounts, with no specific amount being more likely, the minimum of the range is accrued. Management reviews its environmental remediation sites quarterly to determine if additional cost adjustments or disclosures are required. The characteristics of environmental remediation obligations, where information concerning the nature and extent of clean-up activities is not immediately available and which are subject to changes in regulatory requirements, result in a significant risk of increase to the obligations as they mature. Expected future expenditures are not discounted to present value unless the amount and timing of the cash disbursements can be reasonably estimated. Potential insurance recoveries are not recognized until realized. Refer to NOTE 11 - ENVIRONMENTAL AND MINE CLOSURE OBLIGATIONS, for further information.
Income Taxes
Our income tax expense, deferred tax assets and liabilities and reserves for unrecognized tax benefits reflect management's best assessment of estimated future taxes to be paid. We are subject to income taxes in both the U.S. and numerous foreign jurisdictions. Significant judgments and estimates are required in determining the consolidated income tax expense.
Deferred income taxes arise from temporary differences between tax and financial statement recognition of revenue and expense. In evaluating our ability to recover our deferred tax assets, we consider all available positive and negative evidence, including scheduled reversals of deferred tax liabilities, projected future taxable income, tax planning strategies and recent financial operations. In projecting future taxable income, we begin with historical results adjusted for the results of discontinued operations and changes in accounting policies and incorporate assumptions including the amount of future state, federal and foreign pretax operating income, the reversal of temporary differences, and the implementation of feasible and prudent tax planning strategies. These assumptions require significant judgment about the forecasts of future taxable income and are consistent with the plans and estimates we are using to manage the underlying businesses. In evaluating the objective evidence that historical results provide, we consider three years of cumulative operating income (loss).
At December 31, 2014 and 2013, we had a valuation allowance of $2,224.5 million and $864.1 million, respectively, against our deferred tax assets. Our losses in certain locations in recent periods represented sufficient negative evidence to require a full valuation allowance against certain deferred tax assets. Additionally, significant Alternative Minimum tax credits have been generated in recent years. Sufficient negative evidence suggests that the credits will not be realized in the foreseeable future, and a full valuation allowance has been recorded on the deferred tax asset. We intend to maintain a valuation allowance against the deferred tax assets related to these operating losses, credits and allowances until sufficient positive evidence exists to support the realization of such assets.
Changes in tax laws and rates also could affect recorded deferred tax assets and liabilities in the future. Management is not aware of any such changes that would have a material effect on the Company's results of operations, cash flows or financial position.
The calculation of our tax liabilities involves dealing with uncertainties in the application of complex tax laws and regulations in a multitude of jurisdictions across our global operations.
Accounting for uncertainty in income taxes recognized in the financial statements requires that a tax benefit from an uncertain tax position be recognized when it is more likely than not that the position will be sustained upon examination, including resolutions of any related appeals or litigation processes, based on technical merits.
We recognize tax liabilities in accordance with ASC 740, and we adjust these liabilities when our judgment changes as a result of evaluation of new information not previously available. Due to the complexity of some of these uncertainties, the ultimate resolution may result in payment that is materially different from our current estimate of the tax liabilities. These differences will be reflected as increases or decreases to income tax expense in the period in which they are determined.
Valuation of Goodwill
Goodwill represents the excess purchase price paid over the fair value of the net assets of acquired companies. We assign goodwill arising from acquired companies to the reporting units that are expected to benefit from the synergies of the acquisition. Our reporting units are either at the operating segment level or a component one level below our operating segments that constitutes a business for which management generally reviews production and financial results
of that component. Decisions are often made as to capital expenditures, investments and production plans at the component level as part of the ongoing management of the related operating segment. We have determined that our Asia Pacific Iron Ore and Ferroalloys operating segments constitute separate reporting units, that CQIM and our Wabush mine within our Eastern Canadian Iron Ore operating segment constitute reporting units, and that our Northshore mine within our U.S. Iron Ore operating segment constitutes a reporting unit. Goodwill is allocated among and evaluated for impairment at the reporting unit level in the fourth quarter of each year or as circumstances occur that potentially indicate that the carrying amount of these assets may not be recoverable.
We use a two-step process to test goodwill for impairment. In the first step, we generally use a discounted cash flow analysis to determine the fair value of each reporting unit, which considers forecasted cash flows discounted at an estimated weighted average cost of capital. In assessing the valuation of our goodwill, significant assumptions regarding the estimated future cash flows and other factors to determine the fair value of a reporting unit must be made, including among other things, estimates related to long-term price expectations, foreign currency exchange rates, expected capital expenditures and working capital requirements, which are based upon our long-range plan and life of mine estimates. If the discounted cash flow analysis yields a fair value estimate less than the reporting unit's carrying value, we would proceed to step two of the impairment test. In the second step, the implied fair value of the reporting unit's goodwill is determined by allocating the reporting unit's fair value to the assets and liabilities other than goodwill in a manner similar to a purchase price allocation. In performing this allocation of fair value to the assets and liabilities of the reporting unit, we typically utilize third-party valuation firms to support the fair values allocated. The resulting implied fair value of the goodwill that results from the application of this second step is then compared to the carrying amount of the goodwill and, if the carrying amount exceeds the implied fair value, an impairment charge is recorded for the difference. If these estimates were to change in the future as a result of changes in strategy or market conditions, we may be required to record impairment charges for these assets in the period such determination was made.
During the third quarter of 2014, a goodwill impairment charge of $73.5 million was recorded for our Asia Pacific Iron Ore operating segment. The impairment charge was primarily a result of changes in estimates of long-term price forecasts were updated as part of management’s long-range planning process.
During the fourth quarter of 2013, a goodwill impairment charge of $80.9 million was recorded for our Cliffs Chromite Ontario and Cliffs Chromite Far North reporting units within our Ferroalloys operating segment. The impairment charge was primarily a result of the decision to indefinitely suspend the Chromite Project and to not allocate significant additional capital for the project given the uncertain timeline and risks associated with the development of necessary infrastructure to bring the project online.
After performing our annual goodwill impairment test in the fourth quarter of 2012, we determined that $997.3 million and $2.7 million, respectively, of goodwill associated with our CQIM and Wabush reporting units, which are both included in the Eastern Canadian Iron Ore segment, was impaired as the carrying value of these reporting units exceeded their fair value.
As of December 31, 2014, our remaining value of goodwill is associated with our U.S. Iron Ore segment. The fair value of our Northshore reporting unit was substantially in excess of our carrying values as identified during our annual goodwill impairment test. The value of goodwill at our Northshore reporting unit totals $2.0 million. No other goodwill remains as of December 31, 2014.
Refer to NOTE 1 - BASIS OF PRESENTATION AND SIGNIFICANT ACCOUNTING POLICIES, for further information regarding our policy on goodwill impairment.
Valuation of Long-Lived Assets
In assessing the recoverability of our long-lived assets, significant assumptions regarding the estimated future cash flows and other factors to determine the fair value of the respective assets must be made, as well as the related estimated useful lives. If these estimates or their related assumptions change in the future as a result of changes in strategy or market conditions, we may be required to record impairment charges for these assets in the period such determination was made.
We monitor conditions that indicate that the carrying value of an asset or asset group may be impaired. In order to determine if assets have been impaired, assets are grouped and tested at the lowest level for which identifiable, independent cash flows are available. An impairment loss exists when projected undiscounted cash flows are less than the carrying value of the assets. The measurement of the impairment loss to be recognized is based on the difference between the fair value and the carrying value of the assets. Fair value can be determined using a market approach, income approach or cost approach. The impairment analysis and fair value determination can result in substantially
different outcomes based on critical assumptions and estimates including the quantity and quality of remaining economic ore reserves, future iron ore prices and production costs.
During the third and fourth quarter of 2014, we identified factors that indicate the carrying values of various asset groups may not be recoverable. Primary factors include that estimates of long-term price forecasts were updated as part of management’s long-range planning process. Updated estimates of long-term prices for all products, specifically the Platts 62 percent Fe fines spot price, which particularly effects Eastern Canadian Iron Ore and Asia Pacific Iron Ore business segments because their contracts correlate heavily to world market spot pricing, and the benchmark price for premium low-volatile hard coking coal were lower than prior estimates. These estimates were updated based upon current market conditions, macro-economic factors influencing the balance of supply and demand for our products and expectations for future cost and capital expenditure requirements. Additional factors include a new CEO, Lourenco Goncalves, appointed by the Board of Directors in early August 2014 and subsequently identified as the CODM in accordance with ASC 280, Segment Reporting. The new CODM views Eastern Canadian Iron Ore, Asia Pacific Iron Ore, North American Coal and Ferroalloys as non-core assets and has communicated plans to evaluate the business units for a change in strategy including possible divestiture. These factors, among other considerations utilized in the individual impairment assessments, indicate that the carrying value of the respective asset groups, which resulted in an impairment of other long-lived assets of $8,956.4 million for the year ended December 31, 2014.
During the fourth quarter of 2013, we continued to experience higher than expected production costs and operational inefficiencies at our Wabush operations within our Eastern Canadian Iron Ore operating segment that have resulted in continued declines in our profitability of that business, which represents an asset group for purposes of testing our long-lived assets for recoverability. Upon completion of an impairment analysis, it was determined the fair value was less than the carrying value of the asset group, which resulted in an impairment of other long-lived assets of $154.6 million at December 31, 2013.
Due to lower than previously expected profits as a result of decreased iron ore pricing expectations and higher than anticipated production costs, we determined that indicators of impairment with respect to certain of our long-lived assets groups existed at December 31, 2012. Our asset groups generally consist of the assets and liabilities of one or more mines, preparation plants and associated reserves for which the lowest level of identifiable cash flows largely are independent of cash flows of other mines, preparation plants and associated reserves. As a result of this assessment, we determined that the cash flows associated with our Eastern Canadian pelletizing operations were not sufficient to support the recoverability of the carrying value of these productive assets. Accordingly, an asset impairment charge of $49.9 million was recorded related to the Wabush mine property, plant and equipment that were reported in our Eastern Canadian Iron Ore operating segment during the fourth quarter of 2012. No impairment charges were identified in connection with our other long-lived asset groups as of December 31, 2012.
Refer to NOTE 1 - BASIS OF PRESENTATION AND SIGNIFICANT ACCOUNTING POLICIES, NOTE 4 - PROPERTY, PLANT AND EQUIPMENT and NOTE 6 - FAIR VALUE OF FINANCIAL INSTRUMENTS for further information regarding our policy on asset impairment, detail on our remaining PP&E and mineral rights and non-recurring fair value measurements.
Employee Retirement Benefit Obligations
We offer defined benefit pension plans, defined contribution pension plans and other postretirement benefit plans, primarily consisting of retiree healthcare benefits, to most employees in North America as part of a total compensation and benefits program. We do not have employee retirement benefit obligations at our Asia Pacific Iron Ore operations. The defined benefit pension plans largely are noncontributory and benefits generally are based on employees' years of service and average earnings for a defined period prior to retirement or a minimum formula.
Following is a summary of our defined benefit pension and OPEB funding and expense for the years 2012 through 2015:
|
| | | | | | | | | | | | | | | | |
| | Pension | | OPEB |
| | Funding | | Expense | | Funding | | Expense |
2012 | | $ | 67.7 |
| | $ | 55.2 |
| | $ | 39 |
| | $ | 28.1 |
|
2013 | | 53.7 |
| | 52.1 |
| | 25.5 |
| | 17.4 |
|
2014 | | 60.5 |
| | 31.3 |
| | 7.3 |
| | (0.7 | ) |
2015 (Estimated) | | 36.8 |
| | 23.6 |
| | 6.8 |
| | 6.0 |
|
Assumptions used in determining the benefit obligations and the value of plan assets for defined benefit pension plans and postretirement benefit plans (primarily retiree healthcare benefits) that we offer are evaluated periodically by management. Critical assumptions, such as the discount rate used to measure the benefit obligations, the expected long-term rate of return on plan assets, the medical care cost trend, and the rate of compensation increase are reviewed annually.
As of December 31, 2014 and 2013, we used the following assumptions:
|
| | | | | | | |
| Pension and Other Benefits |
| 2014 | | | 2013 |
| |
U.S. plan discount rate | 3.83 |
| % | | 4.57 |
| % |
Canadian pension plan discount rate | 3.75 |
| | | 4.50 |
| |
Canadian OPEB plan discount rate | 3.75 |
| | | 4.75 |
| |
U.S. rate of compensation increase - Salaried | 3.00 |
| | | 4.00 |
| |
U.S. rate of compensation increase - Hourly | 2.50 |
| | | 3.00 |
| |
Canadian rate of compensation increase | 3.00 |
| | | 4.00 |
| |
U.S. pension plan expected return on plan assets | 8.25 |
| | | 8.25 |
| |
U.S. OPEB plan expected return on plan assets | 7.00 |
| | | 7.00 |
| |
Canadian expected return on plan assets | 7.25 |
| | | 7.25 |
| |
The decrease in the discount rates in 2014 was driven by the change in bond yields, which were down approximately 80 basis points compared to the prior year.
Additionally, on December 31, 2014, we adopted the RP-2014 mortality tables projected generationally using scale MP-2014 with blue collar and white collar adjustments made for certain hourly and salaried groups, to determine the expected life of our plan participants, replacing the IRS 2014 prescribed mortality tables for our U.S. plans. For the Canadian plans, we adopted the 2014 Private Sector Canadian Pensioners’ Mortality Table for the hourly plans and the 2014 Canadian Pensioners’ Mortality Table for the salaried plans, where both tables were projected generationally using scale CPM-B, replacing the UP 1994 table with full projection.
Following are sensitivities of potential further changes in these key assumptions on the estimated 2015 pension and OPEB expense and the pension and OPEB benefit obligations as of December 31, 2014:
|
| | | | | | | | | | | | | | | | |
| | Increase in Expense | | Increase in Benefit Obligation |
| | (In Millions) | | (In Millions) |
| | Pension | | OPEB | | Pension | | OPEB |
Decrease discount rate .25 percent | | $ | 2.3 |
| | $ | 0.7 |
| | $ | 35.3 |
| | $ | 13.6 |
|
Decrease return on assets 1 percent | | 9.2 |
| | 2.6 |
| | N/A | | N/A |
Increase medical trend rate 1 percent | | N/A | | 6.4 |
| | N/A | | 49.6 |
|
Changes in actuarial assumptions, including discount rates, employee retirement rates, mortality, compensation levels, plan asset investment performance and healthcare costs, are determined based on analyses of actual and expected factors. Changes in actuarial assumptions and/or investment performance of plan assets may have a significant impact on our financial condition due to the magnitude of our retirement obligations. Refer to NOTE 7 - PENSIONS AND OTHER POSTRETIREMENT BENEFITS in Item 8. Financial Statements and Supplementary Data of this Annual Report on Form 10-K for further information.
Forward-Looking Statements
This report contains statements that constitute "forward-looking statements" within the meaning of the federal securities laws. As a general matter, forward-looking statements relate to anticipated trends and expectations rather than historical matters. Forward-looking statements are subject to uncertainties and factors relating to Cliffs’ operations and business environment that are difficult to predict and may be beyond our control. Such uncertainties and factors may cause actual results to differ materially from those expressed or implied by the forward-looking statements. These statements speak only as of the date of this report, and we undertake no ongoing obligation, other than that imposed by law, to update these statements. Uncertainties and risk factors that could affect Cliffs’ future performance and cause results to differ from the forward-looking statements in this report include, but are not limited to:
| |
• | our ability to successfully execute an exit option for Bloom Lake mine that minimizes the cash outflows and associated liabilities of our Canadian operations including the CCAA process; |
| |
• | trends affecting our financial condition, results of operations or future prospects, particularly the continued volatility of iron ore and coal prices; |
| |
• | our actual levels of capital spending; |
| |
• | availability of capital and our ability to maintain adequate liquidity and successfully implement our financing plans; |
| |
• | uncertainty or weaknesses in global economic conditions, including downward pressure on prices, reduced market demand and any slowing of the economic growth rate in China; |
| |
• | our ability to successfully identify and consummate any strategic investments and complete planned divestitures; |
| |
• | the outcome of any contractual disputes with our customers, joint venture partners or significant energy, material or service providers or any other litigation or arbitration; |
| |
• | the ability of our customers and joint venture partners to meet their obligations to us on a timely basis or at all; |
| |
• | our ability to reach agreement with our iron ore customers regarding any modifications to sales contract provisions; |
| |
• | the impact of price-adjustment factors on our sales contracts; |
| |
• | changes in sales volume or mix; |
| |
• | our actual economic iron ore and coal reserves or reductions in current mineral estimates, including whether any mineralized material qualifies as a reserve; |
| |
• | the impact of our customers using other methods to produce steel or reducing their steel production; |
| |
• | events or circumstances that could impair or adversely impact the viability of a mine and the carrying value of associated assets, as well as any resulting impairment charges; |
| |
• | the results of prefeasibility and feasibility studies in relation to projects; |
| |
• | impacts of existing and increasing governmental regulation and related costs and liabilities, including failure to receive or maintain required operating and environmental permits, approvals, modifications or other authorization of, or from, any governmental or regulatory entity and costs related to implementing improvements to ensure compliance with regulatory changes; |
| |
• | our ability to cost-effectively achieve planned production rates or levels; |
| |
• | uncertainties associated with natural disasters, weather conditions, unanticipated geological conditions, supply or price of energy, equipment failures and other unexpected events; |
| |
• | adverse changes in currency values, currency exchange rates, interest rates and tax laws; |
| |
• | our ability to maintain appropriate relations with unions and employees and enter into or renew collective bargaining agreements on satisfactory terms; |
| |
• | risks related to international operations; |
| |
• | availability of capital equipment and component parts; |
| |
• | the potential existence of significant deficiencies or material weakness in our internal control over financial reporting; and |
| |
• | problems or uncertainties with productivity, tons mined, transportation, mine-closure obligations, environmental liabilities, employee-benefit costs and other risks of the mining industry. |
For additional factors affecting the business of Cliffs, refer to Part I – Item 1A. Risk Factors. You are urged to carefully consider these risk factors.
|
| |
Item 7A. | Quantitative and Qualitative Disclosures About Market Risk |
Information regarding our Market Risk is presented under the caption Market Risks, which is included in Item 7. Management's Discussion and Analysis of Financial Condition and Results of Operations and is incorporated by reference and made a part hereof.
|
| |
Item 8. | Financial Statements and Supplementary Data |
Statements of Consolidated Financial Position
Cliffs Natural Resources Inc. and Subsidiaries
|
| | | | | | | |
| (In Millions) |
| December 31, |
| 2014 | | 2013 |
ASSETS | | | |
CURRENT ASSETS | | | |
Cash and cash equivalents | $ | 290.9 |
| | $ | 335.5 |
|
Accounts receivable, net | 205.6 |
| | 270.0 |
|
Inventories | 326.7 |
| | 391.4 |
|
Supplies and other inventories | 195.2 |
| | 216.0 |
|
Income tax receivable | 237.7 |
| | 74.1 |
|
Other current assets | 192.8 |
| | 273.0 |
|
TOTAL CURRENT ASSETS | 1,448.9 |
| | 1,560.0 |
|
PROPERTY, PLANT AND EQUIPMENT, NET | 1,414.9 |
| | 11,153.4 |
|
OTHER ASSETS | | | |
Deferred income taxes | 156.4 |
| | 41.5 |
|
Other non-current assets | 143.8 |
| | 367.0 |
|
TOTAL OTHER ASSETS | 300.2 |
| | 408.5 |
|
TOTAL ASSETS | $ | 3,164.0 |
| | $ | 13,121.9 |
|
(continued)
The accompanying notes are an integral part of these consolidated financial statements.
Statements of Consolidated Financial Position
Cliffs Natural Resources Inc. and Subsidiaries - (Continued)
|
| | | | | | | |
| (In Millions) |
| December 31, |
| 2014 | | 2013 |
LIABILITIES | | | |
CURRENT LIABILITIES | | | |
Accounts payable | $ | 272.1 |
| | $ | 345.5 |
|
Accrued employment costs | 99.5 |
| | 129.0 |
|
Income taxes payable | 1.0 |
| | 55.6 |
|
State and local taxes payable | 52.5 |
| | 61.7 |
|
Current portion of debt | 21.8 |
| | 20.9 |
|
Accrued expenses | 255.3 |
| | 206.4 |
|
Accrued royalties | 31.2 |
| | 57.3 |
|
Current portion of capital leases | 74.5 |
| | 49.0 |
|
Other current liabilities | 150.7 |
| | 160.1 |
|
TOTAL CURRENT LIABILITIES | 958.6 |
| | 1,085.5 |
|
POSTEMPLOYMENT BENEFIT LIABILITIES | | | |
Pensions | 275.4 |
| | 197.5 |
|
Other postretirement benefits | 119.8 |
| | 96.5 |
|
TOTAL POSTEMPLOYMENT BENEFIT LIABILITIES | 395.2 |
| | 294.0 |
|
ENVIRONMENTAL AND MINE CLOSURE OBLIGATIONS | 256.0 |
| | 309.7 |
|
DEFERRED INCOME TAXES | 51.3 |
| | 1,146.5 |
|
LONG-TERM DEBT | 2,962.3 |
| | 3,022.6 |
|
OTHER LIABILITIES | 274.9 |
| | 379.3 |
|
TOTAL LIABILITIES | 4,898.3 |
| | 6,237.6 |
|
COMMITMENTS AND CONTINGENCIES (SEE NOTE 20) |
| |
|
EQUITY | | | |
CLIFFS SHAREHOLDERS' EQUITY | | | |
Preferred Stock - no par value | | | |
Class A - 3,000,000 shares authorized | | | |
7% Series A Mandatory Convertible, Class A, no par value and $1,000 per share liquidation preference (See Note 15) | | | |
Issued and Outstanding - 731,223 shares (2013 - 731,250) | 731.3 |
| | 731.3 |
|
Class B - 4,000,000 shares authorized | | | |
Common Shares - par value $0.125 per share | | | |
Authorized - 400,000,000 shares (2013 - 400,000,000 shares); | | | |
Issued - 159,546,224 shares (2013 - 159,546,224 shares); | | | |
Outstanding - 153,246,754 shares (2013 - 153,126,291 shares) | 19.8 |
| | 19.8 |
|
Capital in excess of par value of shares | 2,309.8 |
| | 2,329.5 |
|
Retained earnings (Accumulated deficit) | (3,960.7 | ) | | 3,407.3 |
|
Cost of 6,299,470 common shares in treasury (2013 - 6,419,933 shares) | (285.7 | ) | | (305.5 | ) |
Accumulated other comprehensive loss | (245.8 | ) | | (112.9 | ) |
TOTAL CLIFFS SHAREHOLDERS' EQUITY (DEFICIT) | (1,431.3 | ) | | 6,069.5 |
|
NONCONTROLLING INTEREST (DEFICIT) | (303.0 | ) | | 814.8 |
|
TOTAL EQUITY (DEFICIT) | (1,734.3 | ) | | 6,884.3 |
|
TOTAL LIABILITIES AND EQUITY (DEFICIT) | $ | 3,164.0 |
| | $ | 13,121.9 |
|
The accompanying notes are an integral part of these consolidated financial statements.
Statements of Consolidated Operations
Cliffs Natural Resources Inc. and Subsidiaries
|
| | | | | | | | | | | |
| (In Millions, Except Per Share Amounts) |
| Year Ended December 31, |
| 2014 | | 2013 | | 2012 |
REVENUES FROM PRODUCT SALES AND SERVICES | | | | | |
Product | $ | 4,230.8 |
| | $ | 5,346.6 |
| | $ | 5,520.9 |
|
Freight and venture partners' cost reimbursements | 392.9 |
| | 344.8 |
| | 351.8 |
|
| 4,623.7 |
| | 5,691.4 |
| | 5,872.7 |
|
COST OF GOODS SOLD AND OPERATING EXPENSES | (4,172.3 | ) | | (4,542.1 | ) | | (4,700.6 | ) |
SALES MARGIN | 451.4 |
| | 1,149.3 |
| | 1,172.1 |
|
OTHER OPERATING INCOME (EXPENSE) | | | | | |
Selling, general and administrative expenses | (208.7 | ) | | (231.6 | ) | | (282.5 | ) |
Exploration costs | (8.8 | ) | | (59.0 | ) | | (142.8 | ) |
Impairment of goodwill and other long-lived assets | (9,029.9 | ) | | (250.8 | ) | | (1,049.9 | ) |
Gain (loss) on disposal of other assets | (423.0 | ) | | 16.7 |
| | 1.2 |
|
Miscellaneous - net | (226.3 | ) | | 46.4 |
| | (6.9 | ) |
| (9,896.7 | ) | | (478.3 | ) | | (1,480.9 | ) |
OPERATING INCOME (LOSS) | (9,445.3 | ) | | 671.0 |
| | (308.8 | ) |
OTHER INCOME (EXPENSE) | | | | | |
Interest expense, net | (185.2 | ) | | (179.1 | ) | | (195.6 | ) |
Other non-operating income (expense) | 26.8 |
| | (2.6 | ) | | 2.6 |
|
| (158.4 | ) | | (181.7 | ) | | (193.0 | ) |
INCOME (LOSS) FROM CONTINUING OPERATIONS BEFORE INCOME TAXES AND EQUITY INCOME (LOSS) FROM VENTURES | (9,603.7 | ) | | 489.3 |
| | (501.8 | ) |
INCOME TAX BENEFIT (EXPENSE) | 1,302.0 |
| | (55.1 | ) | | (255.9 | ) |
EQUITY LOSS FROM VENTURES, net of tax | (9.9 | ) | | (74.4 | ) | | (404.8 | ) |
INCOME (LOSS) FROM CONTINUING OPERATIONS | (8,311.6 | ) | | 359.8 |
| | (1,162.5 | ) |
INCOME and GAIN ON SALE FROM DISCONTINUED OPERATIONS, net of tax | — |
| | 2.0 |
| | 35.9 |
|
NET INCOME (LOSS) | (8,311.6 | ) | | 361.8 |
| | (1,126.6 | ) |
LOSS ATTRIBUTABLE TO NONCONTROLLING INTEREST | 1,087.4 |
| | 51.7 |
| | 227.2 |
|
NET INCOME (LOSS) ATTRIBUTABLE TO CLIFFS SHAREHOLDERS | $ | (7,224.2 | ) | | $ | 413.5 |
| | $ | (899.4 | ) |
PREFERRED STOCK DIVIDENDS | (51.2 | ) | | (48.7 | ) | | — |
|
NET INCOME (LOSS) ATTRIBUTABLE TO CLIFFS COMMON SHAREHOLDERS | $ | (7,275.4 | ) | | $ | 364.8 |
| | $ | (899.4 | ) |
| | | | | |
EARNINGS (LOSS) PER COMMON SHARE ATTRIBUTABLE TO CLIFFS SHAREHOLDERS - BASIC | | | | | |
Continuing operations | $ | (47.52 | ) | | $ | 2.39 |
| | $ | (6.57 | ) |
Discontinued operations | — |
| | 0.01 |
| | 0.25 |
|
| $ | (47.52 | ) | | $ | 2.40 |
| | $ | (6.32 | ) |
EARNINGS (LOSS) PER COMMON SHARE ATTRIBUTABLE TO CLIFFS SHAREHOLDERS - DILUTED | | | | | |
Continuing operations | $ | (47.52 | ) | | $ | 2.36 |
| | $ | (6.57 | ) |
Discontinued operations | — |
| | 0.01 |
| | 0.25 |
|
| $ | (47.52 | ) | | $ | 2.37 |
| | $ | (6.32 | ) |
AVERAGE NUMBER OF SHARES (IN THOUSANDS) | | | | | |
Basic | 153,098 |
| | 151,726 |
| | 142,351 |
|
Diluted | 153,098 |
| | 174,323 |
| | 142,351 |
|
The accompanying notes are an integral part of these consolidated financial statements.
Statements of Consolidated Comprehensive Income (Loss)
Cliffs Natural Resources Inc. and Subsidiaries
|
| | | | | | | | | | | |
| (In Millions) |
| Year Ended December 31, |
| 2014 | | 2013 | | 2012 |
NET INCOME (LOSS) ATTRIBUTABLE TO CLIFFS SHAREHOLDERS | $ | (7,224.2 | ) | | $ | 413.5 |
| | $ | (899.4 | ) |
OTHER COMPREHENSIVE INCOME (LOSS) | | | | | |
Pension and OPEB liability, net of tax | (91.0 | ) | | 208.3 |
| | 33.8 |
|
Unrealized net gain (loss) on marketable securities, net of tax | (7.2 | ) | | 3.1 |
| | (0.5 | ) |
Unrealized net gain (loss) on foreign currency translation | (42.3 | ) | | (208.6 | ) | | 3.8 |
|
Unrealized net gain (loss) on derivative financial instruments, net of tax | 2.8 |
| | (29.6 | ) | | 7.5 |
|
OTHER COMPREHENSIVE INCOME (LOSS) | (137.7 | ) | | (26.8 | ) | | 44.6 |
|
OTHER COMPREHENSIVE LOSS (INCOME) ATTRIBUTABLE TO THE NONCONTROLLING INTEREST | 4.8 |
| | (30.5 | ) | | (7.6 | ) |
TOTAL COMPREHENSIVE INCOME (LOSS) ATTRIBUTABLE TO CLIFFS SHAREHOLDERS | $ | (7,357.1 | ) | | $ | 356.2 |
| | $ | (862.4 | ) |
The accompanying notes are an integral part of these consolidated financial statements.
Statements of Consolidated Cash Flows
Cliffs Natural Resources Inc. and Subsidiaries
|
| | | | | | | | | | | |
| (In Millions) |
| Year Ended December 31, |
| 2014 | | 2013 | | 2012 |
OPERATING ACTIVITIES | | | | | |
Net income (loss) | $ | (8,311.6 | ) | | $ | 361.8 |
| | $ | (1,126.6 | ) |
Adjustments to reconcile net income (loss) to net cash provided (used) by operating activities: | | | | | |
Depreciation, depletion and amortization | 504.0 |
| | 593.3 |
| | 525.8 |
|
Impairment of goodwill and other long-lived assets | 9,029.9 |
| | 250.8 |
| | 1,049.9 |
|
Equity loss in ventures (net of tax) | 9.9 |
| | 74.4 |
| | 404.8 |
|
Deferred income taxes | (1,153.9 | ) | | (138.1 | ) | | 127.0 |
|
Changes in deferred revenue and below-market sales contracts | (18.0 | ) | | (52.8 | ) | | (24.5 | ) |
Loss on sale of Cliffs Logan County Coal | 419.6 |
| | — |
| | — |
|
Other | (37.7 | ) | | (3.3 | ) | | (40.9 | ) |
Changes in operating assets and liabilities: | | | | | |
Receivables and other assets | (82.8 | ) | | 138.8 |
| | (74.8 | ) |
Product inventories | 37.8 |
| | 30.8 |
| | 39.9 |
|
Payables and accrued expenses | (38.3 | ) | | (109.8 | ) | | (366.1 | ) |
Net cash provided by operating activities | 358.9 |
| | 1,145.9 |
| | 514.5 |
|
INVESTING ACTIVITIES | | | | | |
Purchase of property, plant and equipment | (284.1 | ) | | (861.6 | ) | | (1,127.5 | ) |
Proceeds from sale of Cliffs Logan County Coal | 155.0 |
| | — |
| | — |
|
Proceeds from sale of Sonoma | — |
| | — |
| | 152.6 |
|
Other investing activities | 25.5 |
| | 50.3 |
| | 13.1 |
|
Net cash used in investing activities | (103.6 | ) | | (811.3 | ) | | (961.8 | ) |
FINANCING ACTIVITIES | | | | | |
Net proceeds from issuance of Series A, Mandatory Convertible Preferred Stock, Class A | — |
| | 709.4 |
| | — |
|
Net proceeds from issuance of common shares | — |
| | 285.3 |
| | — |
|
Net proceeds from issuance of senior notes | — |
| | — |
| | 497.0 |
|
Repayment of term loan | — |
| | (847.1 | ) | | (124.8 | ) |
Borrowings under credit facilities | 1,219.5 |
| | 670.5 |
| | 1,012.0 |
|
Repayment under credit facilities | (1,219.5 | ) | | (995.5 | ) | | (687.0 | ) |
Proceeds from equipment loans | — |
| | 164.8 |
| | — |
|
Repayments of equipment loans | (20.9 | ) | | (3.0 | ) | | — |
|
Repayment of senior notes | — |
| | — |
| | (325.0 | ) |
Repurchase of debt | (28.8 | ) | | — |
| | — |
|
Contributions (to)/by joint ventures, net | (25.7 | ) | | 23.3 |
| | 95.4 |
|
Common stock dividends | (92.5 | ) | | (91.9 | ) | | (307.2 | ) |
Preferred stock dividends | (51.2 | ) | | (35.7 | ) | | — |
|
Other financing activities | (69.2 | ) | | (52.0 | ) | | (40.8 | ) |
Net cash (used in) provided by financing activities | (288.3 | ) | | (171.9 | ) | | 119.6 |
|
EFFECT OF EXCHANGE RATE CHANGES ON CASH | (11.6 | ) | | (22.4 | ) | | 1.3 |
|
INCREASE (DECREASE) IN CASH AND CASH EQUIVALENTS | (44.6 | ) | | 140.3 |
| | (326.4 | ) |
CASH AND CASH EQUIVALENTS AT BEGINNING OF PERIOD | 335.5 |
| | 195.2 |
| | 521.6 |
|
CASH AND CASH EQUIVALENTS AT END OF PERIOD | $ | 290.9 |
| | $ | 335.5 |
| | $ | 195.2 |
|
The accompanying notes are an integral part of these consolidated financial statements.
See NOTE 17 - CASH FLOW INFORMATION.
Statements of Consolidated Changes in Equity
Cliffs Natural Resources Inc. and Subsidiaries
|
| | | | | | | | | | | | | | | | | | | | | | | | | | | | | | | | | | | | | |
| | | | | (In Millions) |
| | | | | Cliffs Shareholders | | | | |
| Number
of
Depositary Shares | | Depositary
Shares | | Number
of
Common
Shares | | Common
Shares | | Capital in
Excess of
Par Value
of Shares | | Retained
Earnings | | Common
Shares
in
Treasury | | Accumulated
Other
Comprehensive
Income
(Loss) | | Non-
Controlling
Interest | | Total |
January 1, 2012 | — |
| | $ | — |
| | 142.0 |
| | $ | 18.5 |
| | $ | 1,770.8 |
| | $ | 4,424.3 |
| | $ | (336.0 | ) | | $ | (92.6 | ) | | $ | 1,254.7 |
| | $ | 7,039.7 |
|
Comprehensive income | | | | | | | | | | | | | | | | | | | |
Net income | — |
| | — |
| | — |
| | — |
| | — |
| | (899.4 | ) | | — |
| | — |
| | (227.2 | ) | | (1,126.6 | ) |
Other comprehensive income (loss) | — |
| | — |
| | — |
| | — |
| | — |
| | — |
| | — |
| | 37.0 |
| | 7.6 |
| | 44.6 |
|
Total comprehensive income (loss) | | | | | | | | | | | | | | | | | (219.6 | ) | | (1,082.0 | ) |
Purchase of subsidiary shares from
noncontrolling interest | — |
| | — |
| | — |
| | — |
| | — |
| | — |
| | — |
| | — |
| | (2.1 | ) | | (2.1 | ) |
Undistributed losses to noncontrolling
interest | — |
| | — |
| | — |
| | — |
| | — |
| | — |
| | — |
| | — |
| | 0.4 |
| | 0.4 |
|
Capital contribution by noncontrolling
interest to subsidiary | — |
| | — |
| | — |
| | — |
| | 1.6 |
| | — |
| | — |
| | — |
| | 102.8 |
| | 104.4 |
|
Acquisition of controlling interest | — |
| | — |
| | — |
| | — |
| | — |
| | — |
| | — |
| | — |
| | (8.0 | ) | | (8.0 | ) |
Stock and other incentive plans | — |
| | — |
| | 0.5 |
| | — |
| | 2.3 |
| | — |
| | 13.4 |
| | — |
| | — |
| | 15.7 |
|
Common stock dividends ($2.16 per
share) | — |
| | — |
| | — |
| | — |
| | — |
| | (307.2 | ) | | — |
| | — |
| | — |
| | (307.2 | ) |
December 31, 2012 | — |
| | $ | — |
| | 142.5 |
| | $ | 18.5 |
| | $ | 1,774.7 |
| | $ | 3,217.7 |
| | $ | (322.6 | ) | | $ | (55.6 | ) | | $ | 1,128.2 |
| | $ | 5,760.9 |
|
Comprehensive income | | | | | | | | | | | | | | | | | | | |
Net income | — |
| | — |
| | — |
| | — |
| | — |
| | 413.5 |
| | — |
| | — |
| | (51.7 | ) | | 361.8 |
|
Other comprehensive income (loss) | — |
| | — |
| | — |
| | — |
| | — |
| | — |
| | — |
| | (57.3 | ) | | 30.5 |
| | (26.8 | ) |
Total comprehensive income (loss) | | | | | | | | | | | | | | | | | (21.2 | ) | | 335.0 |
|
Equity offering | — |
| | — |
| | 10.4 |
| | 1.3 |
| | 284.0 |
| | — |
| | — |
| | — |
| | — |
| | 285.3 |
|
Capital contribution by noncontrolling
interest to subsidiary | — |
| | — |
| | — |
| | — |
| | 0.2 |
| | (0.6 | ) | | — |
| | — |
| | 5.6 |
| | 5.2 |
|
Acquisition of controlling interest | — |
| | — |
| | — |
| | — |
| | 295.4 |
| | (82.7 | ) | | — |
| | — |
| | (314.8 | ) | | (102.1 | ) |
Undistributed losses to noncontrolling
interest | — |
| | — |
| | — |
| | — |
| | — |
| | — |
| | — |
| | — |
| | 17.0 |
| | 17.0 |
|
Stock and other incentive plans | — |
| | — |
| | 0.3 |
| | — |
| | (2.9 | ) | | — |
| | 17.1 |
| | — |
| | — |
| | 14.2 |
|
Depositary Shares | 29.3 |
| | 731.3 |
| | — |
| | — |
| | (21.9 | ) | | — |
| | — |
| | — |
| | — |
| | 709.4 |
|
Common stock dividends ($0.60 per
share) | — |
| | — |
| | — |
| | — |
| | — |
| | (91.9 | ) | | — |
| | — |
| | — |
| | (91.9 | ) |
Preferred stock dividends ($1.66 per
depositary share) | — |
| | — |
| | — |
| | — |
| | — |
| | (48.7 | ) | | — |
| | — |
| | — |
| | (48.7 | ) |
December 31, 2013 | 29.3 |
| | $ | 731.3 |
| | 153.2 |
| | $ | 19.8 |
| | $ | 2,329.5 |
| | $ | 3,407.3 |
| | $ | (305.5 | ) | | $ | (112.9 | ) | | $ | 814.8 |
| | $ | 6,884.3 |
|
Comprehensive income | | | | | | | | | | | | | | | | | | | |
Net income | — |
| | — |
| | — |
| | — |
| | — |
| | (7,224.2 | ) | | — |
| | — |
| | (1,087.4 | ) | | (8,311.6 | ) |
Other comprehensive income (loss) | — |
| | — |
| | — |
| | — |
| | — |
| | — |
| | — |
| | (132.9 | ) | | (4.8 | ) | | (137.7 | ) |
Total comprehensive income (loss) | | | | | | | | | | | | | | | | | (1,092.2 | ) | | (8,449.3 | ) |
Capital contribution to noncontrolling
interest to subsidiary | — |
| | — |
| | — |
| | — |
| | — |
| | — |
| | — |
| | — |
| | (0.1 | ) | | (0.1 | ) |
Distributions to noncontrolling
interest | — |
| | — |
| | — |
| | — |
| | — |
| | — |
| | — |
| | — |
| | (25.5 | ) | | (25.5 | ) |
Stock and other incentive plans | — |
| | — |
| | — |
| | — |
| | (19.7 | ) | | — |
| | 19.8 |
| | — |
| | — |
| | 0.1 |
|
Common stock dividends ($0.60 per
share) | — |
| | — |
| | — |
| | — |
| | — |
| | (92.5 | ) | | — |
| | — |
| | — |
| | (92.5 | ) |
Preferred stock dividends ($1.75 per
depositary share) | — |
| | — |
| | — |
| | — |
| | — |
| | (51.3 | ) | | — |
| | — |
| | — |
| | (51.3 | ) |
December 31, 2014 | 29.3 |
| | $ | 731.3 |
| | 153.2 |
| | $ | 19.8 |
| | $ | 2,309.8 |
| | $ | (3,960.7 | ) | | $ | (285.7 | ) | | $ | (245.8 | ) | | $ | (303.0 | ) | | $ | (1,734.3 | ) |
The accompanying notes are an integral part of these consolidated financial statements.
Cliffs Natural Resources Inc. and Subsidiaries
Notes to Consolidated Financial Statements
NOTE 1 - BASIS OF PRESENTATION AND SIGNIFICANT ACCOUNTING POLICIES
Business Summary
We are an international mining and natural resources company, a major global iron ore producer and a producer of low-volatile metallurgical coal. In the U.S., we operate five iron ore mines in Michigan and Minnesota, and two low-volatile metallurgical coal operations located in Alabama and West Virginia. In the fourth quarter of 2014, we sold our CLCC assets, which consisted of two high-volatile metallurgical coal mines and one thermal coal mine. The sale was completed on December 31, 2014. As such, our results include the CLCC results through the day of the sale completion. As of December 31, 2014, our Asia Pacific operations consist solely of our Koolyanobbing iron ore mining complex in Western Australia. We also own two iron ore mines in Eastern Canada. In the first quarter of 2014, Wabush Scully mine in Newfoundland and Labrador was idled and subsequently moved to permanent closure during the fourth quarter. In December 2014, iron ore production at the Bloom Lake mine was suspended and the Bloom Lake mine was placed in ‘‘care-and-maintenance’’ mode. Our operations are organized according to product category and geographic location: U.S. Iron Ore, Asia Pacific Iron Ore, North American Coal and Eastern Canadian Iron Ore.
Significant Accounting Policies
We consider the following policies to be beneficial in understanding the judgments that are involved in the preparation of our consolidated financial statements and the uncertainties that could impact our financial condition, results of operations and cash flows.
Use of Estimates
The preparation of financial statements, in conformity with GAAP, requires management to make estimates and assumptions that affect the reported amounts of assets and liabilities and disclosure of contingent assets and liabilities at the date of the financial statements and the reported amounts of revenues and expenses during the reporting period. The more significant areas requiring the use of management estimates and assumptions related to mineral reserves future realizable cash flow; environmental, reclamation and closure obligations; valuation of long-lived assets and investments; valuation of inventory; valuation of post-employment, post-retirement and other employee benefit liabilities; valuation of tax assets; reserves for contingencies and litigation; and the fair value of derivative instruments. Actual results could differ from estimates. On an ongoing basis, management reviews estimates. Changes in facts and circumstances may alter such estimates and affect results of operations and financial position in future periods.
Basis of Consolidation
The consolidated financial statements include our accounts and the accounts of our wholly owned and majority-owned subsidiaries, including the following operations at December 31, 2014:
|
| | | | | | | | |
Name | | Location | | Ownership Interest | | Operation | | Status of Operations |
Northshore | | Minnesota | | 100.0% | | Iron Ore | | Active |
United Taconite | | Minnesota | | 100.0% | | Iron Ore | | Active |
Tilden | | Michigan | | 85.0% | | Iron Ore | | Active |
Empire | | Michigan | | 79.0% | | Iron Ore | | Active |
Koolyanobbing | | Western Australia | | 100.0% | | Iron Ore | | Active |
Pinnacle | | West Virginia | | 100.0% | | Coal | | Active |
Oak Grove | | Alabama | | 100.0% | | Coal | | Active |
CLCC | | West Virginia | | 100.0% | | Coal | | Assets sold as of December 31, 2014 |
Wabush | | Newfoundland and Labrador/ Québec, Canada | | 100.0% | | Iron Ore | | Permanent closure |
Bloom Lake | | Québec, Canada | | 82.8% | | Iron Ore | | Care-and-maintenance |
Cliffs Chromite Ontario - Black Label Deposit | | Ontario, Canada | | 100.0% | | Chromite | | Suspended |
Cliffs Chromite Ontario - Black Thor Deposit | | Ontario, Canada | | 100.0% | | Chromite | | Suspended |
Cliffs Chromite Ontario & Cliffs Chromite Far North - Big Daddy Deposit | | Ontario, Canada | | 70.0% | | Chromite | | Suspended |
Intercompany transactions and balances are eliminated upon consolidation.
Noncontrolling Interests
During the fourth quarter of 2013, CQIM’s interest in Bloom Lake increased by an aggregate of 7.8 percent after CQIM paid both its own and WISCO’s proportionate shares of the cash call for the first half of 2013. As a result of our cash call payments, CQIM was issued a total of 457,556 new Bloom Lake units, increasing our interest to 82.8 percent in Bloom Lake and diluting WISCO’s interest to 17.2 percent. The new unit issuance decreased equity attributable to WISCO by $314.8 million for the year ended December 31, 2013 by decreasing WISCO’s interest in Bloom Lake’s accumulated deficit. We accounted for the increase in ownership as an equity transaction, which resulted in a $314.8 million increase to equity attributable to Cliffs’ shareholders.
Immaterial Error
In connection with our acquisition of Consolidated Thompson in May 2011, the Company acquired a 75 percent controlling interest in Bloom Lake. For financial reporting purposes, the Company fully consolidates Bloom Lake in the accompanying financial statements and allocates a portion of its consolidated results of operations and shareholders’ equity, which is reported as Loss attributable to noncontrolling interest in the Statements of Consolidated Operations and Noncontrolling interest in the Statements of Consolidated Financial Position.
As a result of the application of ASC 805, Business Combinations, we allocated the purchase price to the assets, liabilities and noncontrolling interest at the acquisition date of May 11, 2011 based on their fair values. These fair value adjustments were recorded in the opening balance sheet and consolidated results of operations; however, subsequent effects of the amortization of these fair value adjustments were not allocated to the noncontrolling interest.
In accordance with U.S. GAAP, management has quantitatively and qualitatively evaluated the materiality of the error and has determined that the misstatement was immaterial to the interim and annual financial statements previously filed from June 30, 2011 through December 31, 2013. Accordingly, the adjustment was recorded prospectively in the Statements of Consolidated Operations for the period ended December 31, 2013 and in the Statements of Consolidated Financial Position as of December 31, 2013. The adjustment to noncontrolling interest related to Bloom Lake was approximately $45.1 million and resulted in an increase to Net Income (Loss) Attributable to Cliffs Shareholders and a
reduction of Loss attributable to noncontrolling interest and corresponding decrease to Noncontrolling interest in the Statements of Consolidated Financial Position for the year end and as of December 31, 2013. The adjustments also resulted in an increase to basic and diluted earnings per common share of $0.30 and $0.26, respectively, for the year ended December 31, 2013. No other financial statement line items were impacted by this adjustment. The prior period amounts included within the accompanying Consolidated Financial Statements have not been retrospectively adjusted for this impact due to management's materiality assessment as discussed above. The impact of the prospective adjustments in the Statements of Consolidated Operations would have resulted in an increase to basic and diluted earnings per common share of $0.25 and $0.07 for the years ended December 31, 2012 and 2011, respectively.
Cash Equivalents
Cash and cash equivalents include cash on hand and on deposit as well as all short-term securities held for the primary purpose of general liquidity. We consider investments in highly liquid debt instruments with an original maturity of three months or less from the date of acquisition to be cash equivalents. We routinely monitor and evaluate counterparty credit risk related to the financial institutions by which our short-term investment securities are held.
Trade Accounts Receivable and Allowance for Doubtful Accounts
Trade accounts receivable are recorded at the invoiced amount and do not bear interest. The allowance for doubtful accounts is our best estimate of the amount of probable credit losses in Cliffs' existing accounts receivable. We establish provisions for losses on accounts receivable when it is probable that all or part of the outstanding balance will not be collected. We regularly review our accounts receivable balances and establish or adjust the allowance as necessary using the specific identification method. The allowance for doubtful accounts was $8.1 million at December 31, 2014 and 2013. There was $9.0 million of bad debt expense for the year ended December 31, 2012. There was no bad debt expense for the years ended December 31, 2014 and 2013.
Inventories
U.S. Iron Ore
U.S. Iron Ore product inventories are stated at the lower of cost or market. Cost of iron ore inventories is determined using the LIFO method.
We had approximately 1.4 million tons and 1.2 million tons of finished goods stored at ports and customer facilities on the lower Great Lakes to service customers at December 31, 2014 and 2013, respectively. We maintain ownership of the inventories until title has transferred to the customer, usually when payment is received. Maintaining ownership of the iron ore products at ports on the lower Great Lakes reduces risk of non-payment by customers.
Asia Pacific Iron Ore
Asia Pacific Iron Ore product inventories are stated at the lower of cost or market. Costs of inventories are being valued on a weighted average cost basis. We maintain ownership of the inventories until title has transferred to the customer, which generally is when the product is loaded into the vessel.
North American Coal
North American Coal product inventories are stated at the lower of cost or market. Cost of coal inventories is calculated using the weighted average cost. We maintain ownership until coal is loaded into rail cars at the mine for domestic sales and until loaded in the vessels at the terminal for export sales.
Eastern Canadian Iron Ore
Iron ore pellet inventories are stated at the lower of cost or market. Cost is determined using the LIFO method. We maintain ownership of the inventories until title has transferred to the customer, which is generally when the product is loaded into the vessel.
Iron ore concentrate inventories are stated at the lower of cost or market. The cost of iron ore concentrate inventories is determined using weighted average cost. We maintain ownership of the inventories until title has transferred to the customer, which generally is when the product is loaded into the vessel.
Supplies and Other Inventories
Supply inventories include replacement parts, fuel, chemicals and other general supplies, which are expected to be used or consumed in normal operations. Supply inventories also include critical spares. Critical spares are replacement parts for equipment that is critical for the continued operation of the mine or processing facilities.
Supply inventories are stated at the lower of cost or market using average cost, less an allowance for obsolete and surplus items. The allowance for obsolete and surplus items was $68.2 million and $63.4 million at December 31, 2014 and 2013, respectively.
Derivative Financial Instruments and Hedging Activities
We are exposed to certain risks related to the ongoing operations of our business, including those caused by changes in commodity prices, interest rates and foreign currency exchange rates. We have established policies and procedures, including the use of certain derivative instruments, to manage such risks.
Derivative financial instruments are recognized as either assets or liabilities in the Statements of Consolidated Financial Position and measured at fair value. On the date a derivative instrument is entered into, we generally designate a qualifying derivative instrument as a hedge of the variability of cash flows to be received or paid related to a recognized asset or liability or forecasted transaction (cash flow hedge). We formally document all relationships between hedging instruments and hedged items, as well as its risk-management objective and strategy for undertaking various hedge transactions. This process includes linking all derivatives that are designated as cash flow hedges to specific firm commitments or forecasted transactions. We also formally assess both at the hedge's inception and on an ongoing basis, whether the derivatives that are used in hedging transactions are highly effective in offsetting changes in cash flows of the related hedged items. When it is determined that a derivative is not highly effective as a hedge or that it has ceased to be a highly effective hedge, we discontinue hedge accounting prospectively and record all future changes in fair value in the period of the instrument's earnings or losses. The policy allows for not more than 75 percent, but not less than 40 percent for up to 12 months and not less than 10 percent for up to 15 months, of forecasted net currency exposures that are probable to occur.
For derivative instruments that have been designated as cash flow hedges, the effective portion of the changes in fair value are recorded in accumulated other comprehensive income (loss) and any portion that is ineffective is recorded in current period earnings or losses. Amounts recorded in accumulated other comprehensive income (loss) are reclassified to earnings or losses in the period the underlying hedged transaction affects earnings or when the underlying hedged transaction is no longer reasonably possible of occurring.
For derivative instruments that have not been designated as cash flow hedges, changes in fair value are recorded in the period of the instrument's earnings or losses.
Refer to NOTE 13 - DERIVATIVE INSTRUMENTS AND HEDGING ACTIVITIES for further information.
Property, Plant and Equipment
Our properties are stated at the lower of cost less accumulated depreciation or fair value. Depreciation of plant and equipment is computed principally by the straight-line method based on estimated useful lives, not to exceed the mine lives. The Northshore, United Taconite, Empire, Tilden and Wabush operations use the double-declining balance method of depreciation for certain mining equipment. The Asia Pacific Iron Ore operation uses the production output method for certain mining equipment. Depreciation is provided over the following estimated useful lives:
|
| | | | |
Asset Class | | Basis | | Life |
Buildings | | Straight line | | 45 Years |
Mining equipment | | Straight line/Double declining balance | | 3 to 20 Years |
Processing equipment | | Straight line | | 10 to 45 Years |
Electric power facilities | | Straight line | | 10 to 45 years |
Land improvements | | Straight line | | 20 to 45 years |
Office and information technology | | Straight line | | 3 to 15 Years |
Depreciation continues to be recognized when operations temporarily are idled.
Our Asia Pacific Iron Ore, Bloom Lake, Wabush, and United Taconite operations' interests in iron ore reserves and mineralized materials were valued when acquired using a discounted cash flow method. The fair value was estimated based upon the present value of the expected future cash flows from iron ore operations over the economic lives of the respective mines.
Our North American Coal operation leases coal mining rights from third parties through lease agreements. The lease agreements are for varying terms and extend through the earlier of their lease termination date or until all merchantable and mineable coal has been extracted. Our interest in coal reserves and non-reserve coal was valued when acquired using a discounted cash flow method. The fair value was estimated based upon the present value of the expected future cash flows from coal operations over the life of the reserves acquired.
Refer to NOTE 4 - PROPERTY, PLANT AND EQUIPMENT for further information.
Capitalized Stripping Costs
During the development phase, stripping costs are capitalized as a part of the depreciable cost of building, developing and constructing a mine. These capitalized costs are amortized over the productive life of the mine using the units of production method. The production phase does not commence until the removal of more than a de minimis amount of saleable mineral material occurs in conjunction with the removal of overburden or waste material for purposes of obtaining access to an ore body. The stripping costs incurred in the production phase of a mine are variable production costs included in the costs of the inventory produced (extracted) during the period that the stripping costs are incurred.
Stripping costs related to expansion of a mining asset of proven and probable reserves are variable production costs that are included in the costs of the inventory produced during the period that the stripping costs are incurred.
Equity Method Investments
Investments in unconsolidated ventures that we have the ability to exercise significant influence over, but not control, are accounted for under the equity method. The following table presents the detail of our investments in unconsolidated ventures and where those investments are classified in the Statements of Consolidated Financial Position as of December 31, 2014 and December 31, 2013. Parentheses indicate a net liability.
|
| | | | | | | | | | | | | | |
| | | | | | | | (In Millions) |
Investment | | Classification | | Accounting Method | | Ownership Interest | | December 31,
2014 | | December 31, 2013 |
Hibbing | | Other non-current assets 1 | | Equity Method | | 23% | | $ | 3.1 |
| | (3.9 | ) |
Other | | Other non-current assets | | Equity Method | | Various | | 3.9 |
| | 34.7 |
|
| | | | | | | | $ | 7.0 |
| | $ | 30.8 |
|
1 At December 31, 2013, the classification for Hibbing was Other liabilities.
During the year ended December 31, 2014, an impairment charge of $21.5 million was recorded related to joint ventures investments and is recognized in Impairment of goodwill and other long-lived assets in the Statements of Consolidated Operations.
Hibbing
Our share of equity income (loss) is eliminated against consolidated product inventory upon production, and against Cost of goods sold and operating expenses when sold. This effectively reduces our cost for our share of the mining ventures' production cost, reflecting the cost-based nature of our participation in unconsolidated ventures.
Amapá
On December 27, 2012, our Board of Directors authorized the sale of our 30 percent interest in Amapá. Per this original agreement, together with Anglo, we were to sell our respective interest in a 100 percent sale transaction to Zamin. The carrying value of our investment was in excess of the net proceeds expected from the sale, which approximated fair value, resulting in a $365.4 million impairment charge, which was recorded through Equity loss from ventures, net of tax in the Statements of Consolidated Operations for the year ended December 31, 2012.
On March 28, 2013, an unknown event caused the Santana port shiploader to collapse into the Amazon River, preventing further ship loading by the mine operator, Anglo. In light of the March 28, 2013 collapse of the Santana port shiploader and subsequent evaluation of the effect that this event had on the carrying value of our investment in Amapá as of June 30, 2013, we recorded an impairment charge of $67.6 million in the second quarter of 2013.
On August 28, 2013, we entered into additional agreements to sell our 30 percent interest in Amapá to Anglo for nominal cash consideration, plus the right to certain contingent deferred consideration upon the two-year anniversary of the closing. The closing was conditional on obtaining certain regulatory approvals and the additional agreement provided Anglo with an option to request that we transfer our interest in Amapá directly to Zamin. Anglo exercised this option and the transfer to Zamin was completed in the fourth quarter of 2013.
Cockatoo Island
On July 31, 2012, we entered into a definitive asset sale agreement with our joint venture partner, HWE Cockatoo Pty Ltd., to sell our beneficial interest in the mining tenements and certain infrastructure of Cockatoo Island to Pluton Resources, which was amended on August 31, 2012. On September 7, 2012, the closing date, Pluton Resources paid a nominal sum of AUD $4.00 and assumed ownership of the assets and responsibility for the environmental rehabilitation obligations and other assumed liabilities not inherently attached to the tenements acquired. The rehabilitation obligations and assumed liabilities that are inherently attached to the tenements were transferred to Pluton Resources upon registration by the Department of Mining and Petroleum denoting Pluton Resources as the tenement holder. Upon final settlement of the sale, which was completed during the second quarter of 2013, we extinguished approximately $18.6 million related to the estimated cost of the rehabilitation.
Goodwill
Goodwill represents the excess purchase price paid over the fair value of the net assets of acquired companies. We had goodwill of $2.0 million and $74.5 million recorded in the Statements of Consolidated Financial Position at December 31, 2014 and 2013, respectively. In accordance with the provisions of ASC 350, we compare the fair value of the respective reporting unit to its carrying value on an annual basis (or more frequently if necessary as discussed below) to determine if there is potential goodwill impairment. If the fair value of the reporting unit is less than its carrying value, an impairment loss is recorded to the extent that the implied value of the goodwill within the reporting unit is less than the carrying value of its goodwill.
During the third quarter of 2014, a goodwill impairment charge of $73.5 million was recorded for our Asia Pacific Iron Ore reporting unit within the Asia Pacific Iron Ore operating segment. The impairment charge was a result of downward long-term pricing estimates as determined through management's long-range planning process.
After performing our annual goodwill impairment test in the fourth quarter of 2013, we determined that $80.9 million of goodwill associated with our Ferroalloys operating segment was impaired. The impairment charge was primarily a result of the decision made in the fourth quarter of 2013 to indefinitely suspend the Chromite Project and to not allocate additional capital for the project given the uncertain timeline and risks associated with the development of necessary infrastructure to bring the project online.
During the fourth quarter of 2012, upon performing our annual goodwill impairment test, a goodwill impairment charge of $997.3 million was recorded for our CQIM reporting unit within the Eastern Canadian Iron Ore operating segment. The impairment charge for our CQIM reporting unit was driven by the project’s lower than anticipated long-term profitability coupled with delays in achieving full operational capacity and higher capital and operating costs. Additionally, the announced delay of the Phase II expansion of the Bloom Lake mine also contributed to the impairment.
Refer to NOTE 12 - GOODWILL AND OTHER INTANGIBLE ASSETS AND LIABILITIES and NOTE 6 - FAIR VALUE OF FINANCIAL INSTRUMENTS for further information.
Other Intangible Assets and Liabilities
Other intangible assets are subject to periodic amortization on a straight-line basis over their estimated useful lives as follows:
|
| | | | |
Intangible Assets | | Basis | | Useful Life (years) |
Permits - Asia Pacific Iron Ore | | Units of production | | Life of mine |
Permits - All Other | | Straight line | | 15 - 40 |
Utility Contracts | | Straight line | | 5 |
Leases - North American Coal | | Units of production | | Life of mine |
Leases - All Other | | Straight line | | 4.5 - 17.5 |
Asset Impairment
Long-Lived Tangible and Intangible Assets
We monitor conditions that may affect the carrying value of our long-lived tangible and intangible assets when events and circumstances indicate that the carrying value of the asset groups may not be recoverable. In order to determine if assets have been impaired, assets are grouped and tested at the lowest level for which identifiable, independent cash flows are available ("asset group"). An impairment loss exists when projected undiscounted cash flows are less than the carrying value of the asset group. The measurement of the impairment loss to be recognized is based on the difference between the fair value and the carrying value of the asset group. Fair value can be determined using a market approach, income approach or cost approach.
As a result of these assessments during 2014, we determined that the cash flows associated with our Eastern Canadian Iron Ore, Asia Pacific Iron Ore, North American Coal and Ferroalloys asset groups were not sufficient to support the recoverability of the carrying value of these productive assets. Accordingly, during 2014, we recorded a long-lived tangible asset impairment charge of $8,839.0 million and an intangible asset impairment charge of $15.5 million in our Statements of Consolidated Operations. At December 31, 2013, we determined there were long-lived tangible and intangible asset impairments related to the Wabush operations within our Eastern Canadian Iron Ore operating segment that resulted in impairment charges of $145.1 million and $9.5 million, respectively. At December 31, 2012, we determined there was a long-lived asset impairment related to the Wabush mine's pelletizing operations that resulted in an impairment charge of $49.9 million.
Refer to NOTE 4 - PROPERTY, PLANT AND EQUIPMENT, NOTE 12 - GOODWILL AND OTHER INTANGIBLE ASSETS AND LIABILITIES and NOTE 6 - FAIR VALUE OF FINANCIAL INSTRUMENTS for further information.
Fair Value Measurements
Valuation Hierarchy
ASC 820 establishes a three-level valuation hierarchy for classification of fair value measurements. The valuation hierarchy is based upon the transparency of inputs to the valuation of an asset or liability as of the measurement date. Inputs refer broadly to the assumptions that market participants would use in pricing an asset or liability. Inputs may be observable or unobservable. Observable inputs are inputs that reflect the assumptions market participants would use in pricing the asset or liability developed based on market data obtained from independent sources. Unobservable inputs are inputs that reflect our own assumptions about the assumptions market participants would use in pricing the asset or liability developed based on the best information available in the circumstances. The three-tier hierarchy of inputs is summarized below:
| |
• | Level 1 — Valuation is based upon quoted prices (unadjusted) for identical assets or liabilities in active markets. |
| |
• | Level 2 — Valuation is based upon quoted prices for similar assets and liabilities in active markets, or other inputs that are observable for the asset or liability, either directly or indirectly, for substantially the full term of the financial instrument. |
| |
• | Level 3 — Valuation is based upon other unobservable inputs that are significant to the fair value measurement. |
The classification of assets and liabilities within the valuation hierarchy is based upon the lowest level of input that is significant to the fair value measurement in its entirety. Valuation methodologies used for assets and liabilities measured at fair value are as follows:
Cash Equivalents
Where quoted prices are available in an active market, cash equivalents are classified within Level 1 of the valuation hierarchy. Cash equivalents classified in Level 1 at December 31, 2014 and 2013 include money market funds. Valuation of these instruments is determined using a market approach and is based upon unadjusted quoted prices for identical assets in active markets.
Marketable Securities
Where quoted prices are available in an active market, marketable securities are classified within Level 1 of the valuation hierarchy. Marketable securities classified in Level 1 at December 31, 2014 and 2013 include available-for-sale securities. The valuation of these instruments is determined using a market approach and is based upon unadjusted quoted prices for identical assets in active markets.
Derivative Financial Instruments
Derivative financial instruments valued using financial models that use as their basis readily observable market parameters are classified within Level 2 of the valuation hierarchy. Such derivative financial instruments include substantially all of our foreign currency exchange contracts and derivative financial instruments that are valued based upon published pricing settlements realized by other companies in the industry. Derivative financial instruments that are valued based upon models with significant unobservable market parameters and are normally traded less actively, are classified within Level 3 of the valuation hierarchy.
Refer to NOTE 6 - FAIR VALUE OF FINANCIAL INSTRUMENTS and NOTE 7 - PENSIONS AND OTHER POSTRETIREMENT BENEFITS for further information.
Pensions and Other Postretirement Benefits
We offer defined benefit pension plans, defined contribution pension plans and other postretirement benefit plans, primarily consisting of retiree healthcare benefits, to most employees in North America as part of a total compensation and benefits program. We do not have employee pension or post-retirement benefit obligations at our Asia Pacific Iron Ore operations or our Bloom Lake mine operations within our Eastern Canadian Iron Ore segment.
We recognize the funded or unfunded status of our postretirement benefit obligations on our December 31, 2014 and 2013 Statements of Consolidated Financial Position based on the difference between the market value of plan assets and the actuarial present value of our retirement obligations on that date, on a plan-by-plan basis. If the plan assets exceed the retirement obligations, the amount of the surplus is recorded as an asset; if the retirement obligations exceed the plan assets, the amount of the underfunded obligations are recorded as a liability. Year-end balance sheet adjustments to postretirement assets and obligations are recorded as Accumulated other comprehensive loss.
The actuarial estimates of the PBO and APBO retirement obligations incorporate various assumptions including the discount rates, the rates of increases in compensation, healthcare cost trend rates, mortality, retirement timing and employee turnover. For the U.S. and Canadian plans, the discount rate is determined based on the prevailing year-end rates for high-grade corporate bonds with a duration matching the expected cash flow timing of the benefit payments from the various plans. The remaining assumptions are based on our estimates of future events by incorporating historical trends and future expectations. The amount of net periodic cost that is recorded in the Statements of Consolidated Operations consists of several components including service cost, interest cost, expected return on plan assets, and amortization of previously unrecognized amounts. Service cost represents the value of the benefits earned in the current year by the participants. Interest cost represents the cost associated with the passage of time. Certain items, such as plan amendments, gains and/or losses resulting from differences between actual and assumed results for demographic and economic factors affecting the obligations and assets of the plans, and changes in other assumptions are subject to deferred recognition for income and expense purposes. The expected return on plan assets is determined utilizing the weighted average of expected returns for plan asset investments in various asset categories based on historical performance, adjusted for current trends. See NOTE 7 - PENSIONS AND OTHER POSTRETIREMENT BENEFITS for further information.
Asset Retirement Obligations
Asset retirement obligations are recognized when incurred and recorded as liabilities at fair value. The fair value of the liability is determined as the discounted value of the expected future cash flow. The asset retirement obligation is accreted over time through periodic charges to earnings. In addition, the asset retirement cost is capitalized as part of the asset’s carrying value and amortized over the life of the related asset. Reclamation costs are adjusted periodically to reflect changes in the estimated present value resulting from the passage of time and revisions to the estimates of either the timing or amount of the reclamation costs. We review, on an annual basis, unless otherwise deemed necessary, the asset retirement obligation at each mine site in accordance with the provisions of ASC 410. We perform an in-depth evaluation of the liability every three years in addition to routine annual assessments.
Future remediation costs for inactive mines are accrued based on management’s best estimate at the end of each period of the costs expected to be incurred at a site. Such cost estimates include, where applicable, ongoing maintenance and monitoring costs. Changes in estimates at inactive mines are reflected in earnings in the period an estimate is revised. See NOTE 11 - ENVIRONMENTAL AND MINE CLOSURE OBLIGATIONS for further information.
Environmental Remediation Costs
We have a formal policy for environmental protection and restoration. Our mining and exploration activities are subject to various laws and regulations governing protection of the environment. We conduct our operations to protect the public health and environment and believe our operations are in compliance with applicable laws and regulations in all material respects. Our environmental liabilities, including obligations for known environmental remediation exposures at active and closed mining operations and other sites, have been recognized based on the estimated cost of investigation and remediation at each site. If the cost only can be estimated as a range of possible amounts with no point in the range being more likely, the minimum of the range is accrued. Future expenditures are not discounted unless the amount and timing of the cash disbursements reasonably can be estimated. It is possible that additional environmental obligations could be incurred, the extent of which cannot be assessed. Potential insurance recoveries have not been reflected in the determination of the liabilities. See NOTE 11 - ENVIRONMENTAL AND MINE CLOSURE OBLIGATIONS for further information.
Revenue Recognition
U.S. Iron Ore, Asia Pacific Iron Ore and Eastern Canadian Iron Ore
We sell our products pursuant to comprehensive supply agreements negotiated and executed with our customers. Revenue is recognized from a sale when persuasive evidence of an arrangement exists, the price is fixed or determinable, the product is delivered in accordance with F.O.B. terms, title and risk of loss have transferred to the customer in accordance with the specified provisions of each supply agreement and collection of the sales price reasonably is assured. Our U.S. Iron Ore, Asia Pacific Iron Ore and Eastern Canadian Iron Ore supply agreements provide that title and risk of loss transfer to the customer either upon loading of the vessel, shipment or, as is the case with some of our U.S. Iron Ore supply agreements, when payment is received. Under certain term supply agreements, we ship the product to ports on the lower Great Lakes or to the customers’ facilities prior to the transfer of title. Our rationale for shipping iron ore products to certain customers and retaining title until payment is received for these products is to minimize credit risk exposure.
Iron ore sales are recorded at a sales price specified in the relevant supply agreements resulting in revenue and a receivable at the time of sale. Upon revenue recognition for provisionally priced sales, a freestanding derivative is created for the difference between the sales price used and expected future settlement price. The derivative, which does not qualify for hedge accounting, is adjusted to fair value through Product revenues as a revenue adjustment each reporting period based upon current market data and forward-looking estimates determined by management until the final sales price is determined. The principal risks associated with recognition of sales on a provisional basis include iron ore price fluctuations between the date initially recorded and the date of final settlement. For revenue recognition, we estimate the future settlement rate; however, if significant changes in iron ore prices occur between the provisional pricing date and the final settlement date, we might be required to either return a portion of the sales proceeds received or bill for the additional sales proceeds due based on the provisional sales price. Refer to NOTE 13 - DERIVATIVE INSTRUMENTS AND HEDGING ACTIVITIES for further information.
In addition, certain supply agreements with one customer include provisions for supplemental revenue or refunds based on the customer’s annual steel pricing for the year the product is consumed in the customer’s blast furnaces. We account for this provision as a derivative instrument at the time of sale and record this provision at fair value until the year the product is consumed and the amounts are settled as an adjustment to revenue. Refer to NOTE 13 - DERIVATIVE INSTRUMENTS AND HEDGING ACTIVITIES for further information.
Revenue from product sales also includes reimbursement for freight charges paid on behalf of customers and freight costs to move product from the Upper Great Lakes to ports in Québec to use for exports and from the port of Esperance to ports in China, which are included in Freight and venture partners' cost reimbursements separate from Product revenues. Revenue is recognized for the expected reimbursement of services when the services are performed.
North American Coal
We sell our products pursuant to supply agreements negotiated and executed with our customers. Revenue is recognized when persuasive evidence of an arrangement exists, the price is fixed or determinable, the product is delivered in accordance with F.O.B. terms, title and risk of loss have transferred to the customer in accordance with the specified provisions of each supply agreement and collection of the sales price reasonably is assured. Delivery on our coal sales is determined to be complete for revenue recognition purposes when title and risk of loss has passed to the customer in accordance with stated contractual terms and there are no other future obligations related to the shipment. For domestic shipments, title and risk of loss generally passes as the coal is loaded into transport carriers for delivery to the customer. For international shipments, title generally passes at the time coal is loaded onto the shipping vessel. Revenue from product sales in 2014, 2013 and 2012 included reimbursement for freight charges paid to move coal from the mine to port locations of $115.0 million, $85.8 million and $101.0 million, respectively, and is recorded in Freight and venture partners' cost reimbursements on the Statements of Consolidated Operations.
Deferred Revenue
The terms of one of our U.S. Iron Ore pellet supply agreements required supplemental payments to be paid by the customer during the period 2009 through 2012, with the option to defer a portion of the 2009 monthly amount in exchange for interest payments until the deferred amount was repaid in 2013. Installment amounts received under this arrangement in excess of sales are classified as deferred revenue in the Statements of Consolidated Financial Position upon receipt of payment. Revenue is recognized over the life of the supply agreement, which extends until 2022, in equal annual installments. As of December 31, 2014 and 2013, installment amounts received in excess of sales totaled $102.8 million and $115.6 million, respectively. As of December 31, 2014, deferred revenue of $12.8 million was recorded in Other current liabilities and $90.0 million was recorded as long term in Other liabilities in the Statements of Consolidated Financial Position. As of December 31, 2013, deferred revenue of $12.8 million was recorded in Other current liabilities and $102.8 million was recorded as long term in Other liabilities in the Statements of Consolidated Financial Position.
In 2014 and 2013, due to the payment terms and the timing of cash receipts near year-end, cash receipts exceeded shipments. The shipments were completed early in the subsequent years. We considered whether revenue should be recognized on these sales under the “bill and hold” guidance provided by the SEC Staff; however, based upon the assessment performed, revenue recognition on these transactions totaling $29.3 million and $13.5 million, respectively, was deferred on the December 31, 2014 and December 31, 2013 Statements of Consolidated Financial Position.
Cost of Goods Sold
U.S. Iron Ore, Asia Pacific Iron Ore and Eastern Canadian Iron Ore
Cost of goods sold and operating expenses represents all direct and indirect costs and expenses applicable to the sales and revenues of our mining operations. Operating expenses primarily represent the portion of the Tilden mining venture costs for which we do not own; that is, the costs attributable to the share of the mine’s production owned by the other joint venture partner in the Tilden mine. The mining venture functions as a captive cost company; it supplies product only to its owners effectively for the cost of production. Accordingly, the noncontrolling interests’ revenue amounts are stated at cost of production and are offset by an equal amount included in Cost of goods sold and operating expenses resulting in no sales margin reflected for the noncontrolling partner participant. As we are responsible for product fulfillment, we act as a principal in the transaction and, accordingly, record revenue under these arrangements on a gross basis.
The following table is a summary of reimbursements in our U.S. Iron Ore operations for the years ended December 31, 2014, 2013 and 2012:
|
| | | | | | | | | | | | |
| | (In Millions) |
| | Year Ended December 31, |
| | 2014 | | 2013 | | 2012 |
Reimbursements for: | | | | | | |
Freight | | $ | 163.0 |
| | $ | 177.3 |
| | $ | 142.0 |
|
Venture partners’ cost | | 108.0 |
| | 82.2 |
| | 108.8 |
|
Total reimbursements | | $ | 271.0 |
| | $ | 259.5 |
| | $ | 250.8 |
|
In 2014, we began selling a portion of its Asia Pacific Iron Ore product on a CFR basis. As a result, $6.9 million of freight was included in Cost of goods sold and operating expenses. There was no freight for the year ended December 31, 2013.
Where we have joint ownership of a mine, our contracts entitle us to receive royalties and/or management fees, which we earn as the pellets are produced.
North American Coal
Cost of goods sold and operating expenses represent all direct and indirect costs and expenses applicable to the sales and revenues of our mining operations.
Repairs and Maintenance
Repairs, maintenance and replacement of components are expensed as incurred. The cost of major equipment overhauls is capitalized and depreciated over the estimated useful life, which is the period until the next scheduled overhaul, generally five years. All other planned and unplanned repairs and maintenance costs are expensed when incurred.
Share-Based Compensation
The fair value of each performance share grant is estimated on the date of grant using a Monte Carlo simulation to forecast relative TSR performance. Consistent with the guidelines of ASC 718, a correlation matrix of historic and projected stock prices was developed for both the Company and its predetermined peer group of mining and metals companies. The fair value assumes that performance goals will be achieved.
The expected term of the grant represents the time from the grant date to the end of the service period for each of the three plan-year agreements. We estimated the volatility of our common shares and that of the peer group of mining and metals companies using daily price intervals for all companies. The risk-free interest rate is the rate at the grant date on zero-coupon government bonds, with a term commensurate with the remaining life of the performance plans.
The fair value of stock options is estimated on the date of grant using a Black-Scholes model using the grant date price of our common shares and option exercise price, and assumptions regarding the option’s expected term, the volatility of our common shares, the risk-free interest rate, and the dividend yield over the option’s expected term.
Refer to NOTE 8 - STOCK COMPENSATION PLANS for additional information.
Income Taxes
Income taxes are based on income for financial reporting purposes, calculated using tax rates by jurisdiction, and reflect a current tax liability or asset for the estimated taxes payable or recoverable on the current year tax return and expected annual changes in deferred taxes. Any interest or penalties on income tax are recognized as a component of income tax expense.
We account for income taxes under the asset and liability method, which requires the recognition of deferred tax assets and liabilities for the expected future tax consequences of events that have been included in the financial statements. Under this method, deferred tax assets and liabilities are determined based on the differences between the financial statement and tax basis of assets and liabilities using enacted tax rates in effect for the year in which the differences are expected to reverse. The effect of a change in tax rates on deferred tax assets and liabilities is recognized in income in the period that includes the enactment date.
We record net deferred tax assets to the extent we believe these assets will more likely than not be realized. In making such determination, we consider all available positive and negative evidence, including scheduled reversals of deferred tax liabilities, projected future taxable income, tax planning strategies and recent financial results of operations.
Accounting for uncertainty in income taxes recognized in the financial statements requires that a tax benefit from an uncertain tax position be recognized when it is more likely than not that the position will be sustained upon examination, including resolutions of any related appeals or litigation processes, based on technical merits.
See NOTE 9 - INCOME TAXES for further information.
Discontinued Operations
On July 10, 2012, we entered into a definitive share and asset sale agreement to sell our 45 percent economic interest in the Sonoma joint venture coal mine located in Queensland, Australia. Upon completion of the transaction on November 12, 2012, we collected approximately AUD $141.0 million in net cash proceeds. The assets sold included our interests in the Sonoma mine along with our ownership of the affiliated washplant. The Sonoma operations previously were included in Other within our reportable segments.
In April 2014, the FASB issued ASU 2014-08, Reporting Discontinued Operations and Disclosures of Disposals of Components of an Entity, which changes the criteria for reporting discontinued operations and requires additional disclosures about discontinued operations. The standard requires that an entity report as a discontinued operation only a disposal that represents a strategic shift in operations that has a major effect on its operations and financial results. ASU 2014-08 is effective prospectively for new disposals that occur within annual periods beginning on or after December 15, 2014. Early adoption is permitted and we adopted ASU 2014-08 during the three months ended December 31, 2014. Both Wabush and CLCC did not qualify as discontinued operations as determined under the new guidance. Neither the closure of Wabush nor the sale of the CLCC assets was considered a strategic shift in operations that had a major effect on our operations. Refer to NOTE 14 - DISCONTINUED OPERATIONS for further discussion of our adoption of ASU 2014-08.
Foreign Currency
Our financial statements are prepared with the U.S. dollar as the reporting currency. The functional currency of the Company’s Australian subsidiaries is the Australian Dollar. The functional currency of all other international subsidiaries is the U.S. dollar. The financial statements of international subsidiaries are translated into U.S. dollars using the exchange rate at each balance sheet date for assets and liabilities and a weighted average exchange rate for each period for revenues, expenses, gains and losses. Where the local currency is the functional currency, translation adjustments are recorded as Accumulated other comprehensive loss. Where the U.S. dollar is the functional currency, translation adjustments are recorded in the Statements of Consolidated Operations. Income taxes generally are not provided for foreign currency translation adjustments.
Earnings Per Share
We present both basic and diluted earnings per share amounts. Basic earnings per share amounts are calculated by dividing Net Income (Loss) Attributable to Cliffs Shareholders less any paid or declared but unpaid dividends on our depositary shares by the weighted average number of common shares outstanding during the period presented. Diluted earnings per share amounts are calculated by dividing Net Income (Loss) Attributable to Cliffs Shareholders by the weighted average number of common shares, common share equivalents under stock plans using the treasury stock method and the number of common shares that would be issued under an assumed conversion of our outstanding depositary shares, each representing a 1/40th interest in a share of our Series A Mandatory Convertible Preferred Stock, Class A, under the if-converted method. Our outstanding depositary shares are convertible into common shares based on the volume weighted average of closing prices of our common shares over the 20 consecutive trading day period ending on the third day immediately preceding the end of the reporting period. Common share equivalents are excluded from EPS computations in the periods in which they have an anti-dilutive effect. See NOTE 19 - EARNINGS PER SHARE for further information.
Recent Accounting Pronouncements
Issued and Not Effective
In August 2014, the FASB issued ASU 2014-15, Disclosure of Uncertainties About an Entity's Ability to Continue as a Going Concern. ASU 2014-15 will explicitly require management to assess an entity's ability to continue as a going concern, and to provide related footnote disclosure in certain circumstances. ASU 2014-15 is intended to define management’s responsibility to evaluate whether there is substantial doubt about an entity’s ability to continue as a going concern and to provide related footnote disclosures. Specifically, ASU 2014-15 provides a definition of the term "substantial doubt" and requires an assessment for a period of one year after the date that the financial statements are issued (or available to be issued). It also requires certain disclosures when substantial doubt is alleviated as a result of consideration of management’s plans and requires an express statement and other disclosures when substantial doubt is not alleviated. The new standard will be effective for all entities in the first annual period ending after December 15, 2016 and for annual periods and interim periods thereafter. Earlier adoption is permitted. We are currently evaluating the impact the adoption of the guidance will have on the Statements of Consolidated Financial Position, Statements of Consolidated Operations or Statements of Consolidated Cash Flows.
In June 2014, the FASB issued ASU 2014-09, Revenue from Contracts with Customers. The new revenue guidance broadly replaces the revenue guidance provided throughout the Codification. The core principle of the revenue guidance is that an entity should recognize revenue to depict the transfer of promised goods or services to customers in an amount that reflects the consideration to which the entity expects to be entitled in exchange for those goods or services. To achieve that core principle, an entity should apply the following steps: (1) identify the contract(s) with a customer, (2) identify the performance obligations in the contract, (3) determine the transaction price, (4) allocate the transaction price to the performance obligations in the contract, and (5) recognize revenue when (or as) the entity satisfies a performance obligation. The new revenue guidance also requires the capitalization of certain contract acquisition costs. Reporting entities must provide new disclosures providing qualitative and quantitative information on the nature, amount, timing, and uncertainty of revenue and cash flows arising from contracts with customers. New disclosures also include qualitative and quantitative information on significant judgments, changes in judgments, and contract acquisition assets. The update is effective for annual periods and interim periods within those annual periods beginning after December 15, 2016 and may be adopted either retrospectively or retrospectively with the cumulative effect. Earlier adoption is not permitted. We are still evaluating the impact of the updated guidance on the Statements of Consolidated Financial Position, Statements of Consolidated Operations or Statements of Consolidated Cash Flows.
NOTE 2 - SEGMENT REPORTING
Our Company’s operations are organized and managed according to product category and geographic location: U.S. Iron Ore, Asia Pacific Iron Ore, North American Coal and Eastern Canadian Iron Ore. The U.S. Iron Ore segment is comprised of our interests in five U.S. mines that provide iron ore to the integrated steel industry. The Asia Pacific Iron Ore segment is located in Western Australia and provides iron ore to the seaborne market for Asian steel producers. The North American Coal segment as of December 31, 2014 is comprised of our two low-volatile metallurgical coal operations that provide metallurgical coal primarily to the integrated steel industry. Effective December 31, 2014, we sold our CLCC assets, which consisted of two high-volatile metallurgical coal mines and one thermal coal mine. As such, the results below include the CLCC results through the day of the sale completion. The Eastern Canadian Iron Ore segment is comprised of two Eastern Canadian mines that primarily provided iron ore to the seaborne market for Asian steel producers. Refer to NOTE 21 - SUBSEQUENT EVENTS for further discussion of our Bloom Lake mine, which is in the Eastern Canadian Iron Ore segment. There were no intersegment revenues in 2014 or 2012. Inter-segment revenues for 2013 were eliminated in consolidation.
We have historically evaluated segment performance based on sales margin, defined as revenues less cost of goods sold, and operating expenses identifiable to each segment. Additionally, beginning in the third quarter of 2014, concurrent with the change in control on July 29, 2014, management began to evaluate segment performance based on EBITDA, defined as Net Income (Loss) before interest, income taxes, depreciation, depletion and amortization, and Adjusted EBITDA, defined as EBITDA excluding certain items such as impairment charges, impacts of permanently idled, closed or sold facilities, foreign currency remeasurement, severance and other costs associated with the acceleration of vesting and payout of outstanding equity grants due to the majority change in our Board of Directors, litigation judgments and intersegment corporate allocations of SG&A costs. Management uses and believes that investors benefit from referring to these measures in evaluating operating and financial results, as well as in planning, forecasting and analyzing future periods as these financial measures approximate the cash flows associated with the operational earnings.
The following tables present a summary of our reportable segments for the years ended December 31, 2014, 2013 and 2012, including a reconciliation of segment sales margin to Income (Loss) from Continuing Operations Before Income Taxes and Equity Income (Loss) from Ventures and a reconciliation of Net Income (Loss) to EBITDA and Adjusted EBITDA:
|
| | | | | | | | | | | | | | | | | |
| (In Millions) |
| 2014 | | 2013 | | 2012 |
Revenues from product sales and services: | | | | | | | | | | | |
U.S. Iron Ore | $ | 2,506.5 |
| | 54% | | $ | 2,667.9 |
| | 47% | | $ | 2,723.3 |
| | 46% |
Asia Pacific Iron Ore | 866.7 |
| | 19% | | 1,224.3 |
| | 22% | | 1,259.3 |
| | 22% |
North American Coal | 687.1 |
| | 15% | | 821.9 |
| | 14% | | 881.1 |
| | 15% |
Eastern Canadian Iron Ore | 563.4 |
| | 12% | | 978.7 |
| | 17% | | 1,008.9 |
| | 17% |
Other (including inter-segment revenue eliminations) | — |
| | —% | | (1.4 | ) | | —% | | 0.1 |
| | —% |
Total revenues from product sales and services | $ | 4,623.7 |
| | 100% | | $ | 5,691.4 |
| | 100% | | $ | 5,872.7 |
| | 100% |
| | | | | | | | | | | |
Sales margin: | | | | | | | | | | | |
U.S. Iron Ore | $ | 710.4 |
| | | | $ | 901.9 |
| | | | $ | 976.2 |
| | |
Asia Pacific Iron Ore | 121.7 |
| | | | 367.1 |
| | | | 311.0 |
| | |
North American Coal | (135.8 | ) | | | | (14.5 | ) | | | | (1.8 | ) | | |
Eastern Canadian Iron Ore | (244.9 | ) | | | | (103.3 | ) | | | | (121.4 | ) | | |
Other (including inter-segment sales margin eliminations) | — |
| | | | (1.9 | ) | | | | 8.1 |
| | |
Sales margin | 451.4 |
| | | | 1,149.3 |
| | | | 1,172.1 |
| | |
Other operating income (expense) | (9,896.7 | ) | | | | (478.3 | ) | | | | (1,480.9 | ) | | |
Other income (expense) | (158.4 | ) | | | | (181.7 | ) | | | | (193.0 | ) | | |
Income (loss) from continuing operations before income taxes and equity income (loss) from ventures | $ | (9,603.7 | ) | | | | $ | 489.3 |
| | | | $ | (501.8 | ) | | |
|
| | | | | | | | | | | |
| (In Millions) |
| 2014 | | 2013 | | 2012 |
| | | | | |
Net Income (Loss) | $ | (8,311.6 | ) | | $ | 361.8 |
| | $ | (1,126.6 | ) |
Less: | | | | | |
Interest expense, net | (185.2 | ) | | (179.1 | ) | | (195.6 | ) |
Income tax benefit (expense) | 1,302.0 |
| | (55.1 | ) | | (255.9 | ) |
Depreciation, depletion and amortization | (504.0 | ) | | (593.3 | ) | | (525.8 | ) |
EBITDA | $ | (8,924.4 | ) | | $ | 1,189.3 |
| | $ | (149.3 | ) |
Less: | | | | | |
Impairment of goodwill and other long-lived assets | $ | (9,029.9 | ) | | $ | (250.8 | ) | | $ | (1,049.9 | ) |
Impairment of equity method investment | — |
| | — |
| | (365.4 | ) |
Loss on sale of Cliffs Logan County Coal | (419.6 | ) | | — |
| | — |
|
Wabush mine impact | (158.7 | ) | | (72.7 | ) | | (30.1 | ) |
Bloom Lake mine impact | (137.9 | ) | | 46.5 |
| | 6.4 |
|
Foreign exchange remeasurement | 30.7 |
| | 64.0 |
| | (3.2 | ) |
Proxy contest and change in control costs in SG&A | (26.6 | ) | | — |
| | — |
|
Litigation judgment | (96.3 | ) | | (9.6 | ) | | — |
|
Severance in SG&A | (15.8 | ) | | (16.4 | ) | | — |
|
Total Adjusted EBITDA | $ | 929.7 |
| | $ | 1,428.3 |
| | $ | 1,292.9 |
|
| | | | | |
EBITDA: | | | | | |
U.S. Iron Ore | $ | 805.6 |
| | $ | 1,000.1 |
| | $ | 1,045.3 |
|
Asia Pacific Iron Ore | (369.8 | ) | | 500.4 |
| | 387.3 |
|
North American Coal | (1,326.8 | ) | | 129.5 |
| | 74.0 |
|
Eastern Canadian Iron Ore | (7,673.9 | ) | | (192.8 | ) | | (1,103.3 | ) |
Other | (359.5 | ) | | (247.9 | ) | | (552.6 | ) |
Total EBITDA | $ | (8,924.4 | ) | | $ | 1,189.3 |
| | $ | (149.3 | ) |
| | | | | |
Adjusted EBITDA: | | | | | |
U.S. Iron Ore | $ | 831.2 |
| | $ | 1,030.8 |
| | $ | 1,085.6 |
|
Asia Pacific Iron Ore | 264.6 |
| | 525.7 |
| | 402.1 |
|
North American Coal | (28.5 | ) | | 154.0 |
| | 106.7 |
|
Eastern Canadian Iron Ore | — |
| | — |
| | — |
|
Other | (137.6 | ) | | (282.2 | ) | | (301.5 | ) |
Total Adjusted EBITDA | $ | 929.7 |
| | $ | 1,428.3 |
| | $ | 1,292.9 |
|
|
| | | | | | | | | | | |
| (In Millions) |
| 2014 | | 2013 | | 2012 |
Depreciation, depletion and amortization: | | | | | |
U.S. Iron Ore | $ | 107.4 |
| | $ | 120.3 |
| | $ | 100.9 |
|
Asia Pacific Iron Ore | 145.9 |
| | 153.7 |
| | 151.9 |
|
North American Coal | 106.9 |
| | 128.9 |
| | 98.2 |
|
Eastern Canadian Iron Ore | 135.6 |
| | 178.5 |
| | 160.2 |
|
Other | 8.2 |
| | 11.9 |
| | 14.6 |
|
Total depreciation, depletion and amortization | $ | 504.0 |
| | $ | 593.3 |
| | $ | 525.8 |
|
| | | | | |
Capital additions1: | | | | | |
U.S. Iron Ore | $ | 48.4 |
| | $ | 53.3 |
| | $ | 168.8 |
|
Asia Pacific Iron Ore | 10.8 |
| | 13.0 |
| | 87.7 |
|
North American Coal | 28.8 |
| | 55.0 |
| | 144.1 |
|
Eastern Canadian Iron Ore | 141.2 |
| | 625.5 |
| | 865.2 |
|
Other | 6.3 |
| | 5.5 |
| | 69.5 |
|
Total capital additions | $ | 235.5 |
| | $ | 752.3 |
| | $ | 1,335.3 |
|
1 Includes capital lease additions and non-cash accruals. Refer to NOTE 17 - CASH FLOW INFORMATION.
A summary of assets by segment is as follows:
|
| | | | | | | | | | | |
| (In Millions) |
| December 31,
2014 | | December 31, 2013 | | December 31, 2012 |
Assets: | | | | | |
U.S. Iron Ore | $ | 1,598.3 |
| | $ | 1,671.6 |
| | $ | 1,735.1 |
|
Asia Pacific Iron Ore | 274.6 |
| | 1,078.4 |
| | 1,506.3 |
|
North American Coal | 274.2 |
| | 1,841.8 |
| | 1,877.8 |
|
Eastern Canadian Iron Ore | 305.8 |
| | 7,915.5 |
| | 7,605.1 |
|
Other | 164.3 |
| | 455.6 |
| | 570.9 |
|
Total segment assets | 2,617.2 |
| | 12,962.9 |
| | 13,295.2 |
|
Corporate | 546.8 |
| | 159.0 |
| | 279.7 |
|
Total assets | $ | 3,164.0 |
| | $ | 13,121.9 |
| | $ | 13,574.9 |
|
Included in the consolidated financial statements are the following amounts relating to geographic location:
|
| | | | | | | | | | | |
| (In Millions) |
| 2014 | | 2013 | | 2012 |
Revenue | | | | | |
United States | $ | 2,139.4 |
| | $ | 1,857.6 |
| | $ | 2,108.5 |
|
China | 1,049.0 |
| | 1,909.4 |
| | 2,008.2 |
|
Canada | 439.1 |
| | 871.2 |
| | 728.1 |
|
Other countries | 996.2 |
| | 1,053.2 |
| | 1,027.9 |
|
Total revenue | $ | 4,623.7 |
| | $ | 5,691.4 |
| | $ | 5,872.7 |
|
Property, Plant and Equipment, Net | | | | | |
United States | $ | 1,093.7 |
| | $ | 2,721.6 |
| | $ | 2,795.3 |
|
Australia | 72.4 |
| | 751.0 |
| | 1,042.4 |
|
Canada | 248.8 |
| | 7,680.8 |
| | 7,369.6 |
|
Total Property, Plant and Equipment, Net | $ | 1,414.9 |
| | $ | 11,153.4 |
| | $ | 11,207.3 |
|
Concentrations in Revenue
In 2014, two customers accounted for more than 10 percent of our consolidated product revenue. In 2013 and 2012, one customer in each year individually accounted for more than 10 percent of our consolidated product revenue. Total revenue from these customers accounted for more than 10 percent of our consolidated product revenues and represents approximately $1.6 billion, $1.0 billion and $0.9 billion of our total consolidated product revenue in 2014, 2013 and 2012, respectively, and is attributable to our U.S. Iron Ore, North American Coal and Eastern Canadian Iron Ore business segments.
The following table represents the percentage of our total revenue contributed by each category of products and services in 2014, 2013, and 2012:
|
| | | | | | | | | |
| | 2014 | | 2013 | | 2012 |
Revenue Category | | | | | | |
Iron ore | | 78 | % | | 80 | % | | 81 | % |
Coal | | 12 | % | | 13 | % | | 13 | % |
Freight and venture partners’ cost reimbursements | | 10 | % | | 7 | % | | 6 | % |
Total revenue | | 100 | % | | 100 | % | | 100 | % |
NOTE 3 - INVENTORIES
The following table presents the detail of our Inventories in the Statements of Consolidated Financial Position as of December 31, 2014 and 2013:
|
| | | | | | | | | | | | | | | | | | | | | | | |
| (In Millions) |
| December 31, 2014 | | December 31, 2013 |
Segment | Finished Goods | | Work-in Process | | Total Inventory | | Finished Goods | | Work-in Process | | Total Inventory |
U.S. Iron Ore | $ | 132.1 |
| | $ | 13.5 |
| | $ | 145.6 |
| | $ | 92.1 |
| | $ | 13.0 |
| | $ | 105.1 |
|
Asia Pacific Iron Ore | 26.4 |
| | 88.1 |
| | 114.5 |
| | 39.7 |
| | 50.6 |
| | 90.3 |
|
North American Coal | 33.1 |
| | 17.2 |
| | 50.3 |
| | 59.4 |
| | 23.2 |
| | 82.6 |
|
Eastern Canadian Iron Ore | 16.3 |
| | — |
| | 16.3 |
| | 65.3 |
| | 48.1 |
| | 113.4 |
|
Total | $ | 207.9 |
| | $ | 118.8 |
| | $ | 326.7 |
| | $ | 256.5 |
| | $ | 134.9 |
| | $ | 391.4 |
|
U.S. Iron Ore
The excess of current cost over LIFO cost of iron ore inventories was $119.0 million and $115.3 million at December 31, 2014 and 2013, respectively. As of December 31, 2014, the product inventory balance for U.S. Iron Ore increased, resulting in a LIFO increment in 2014. The effect of the inventory build was an increase in Inventories of $44.8 million in the Statements of Consolidated Financial Position for the year ended December 31, 2014. As of December 31, 2013, the product inventory balance for U.S. Iron Ore declined, resulting in liquidation of a LIFO layer in 2013. The effect of the inventory reduction was a decrease in Cost of goods sold and operating expenses of $7.4 million in the Statements of Consolidated Operations for the year ended December 31, 2013.
North American Coal
We recorded LCM inventory charges of $44.5 million, $11.1 million and $24.4 million in Cost of goods sold and operating expenses in the Statements of Consolidated Operations for the years ended December 31, 2014, 2013 and 2012, respectively, for our North American Coal operations. The charges in 2014 were a result of market pricing declines. The charges in 2013 and 2012 were a result of market pricing declines and costs associated with operational and geological issues.
Eastern Canadian Iron Ore
We recorded LCM inventory charges of $38.9 million in Cost of goods sold and operating expenses in the Statements of Consolidated Operations for the year ended December 31, 2014, for our Eastern Canadian Iron Ore operations. During 2014, we recorded $10.4 million and $17.5 million of LCM inventory charges related to work-in process inventory and finished goods inventory, respectively, for Bloom Lake. Additionally, we recorded $4.9 million and $6.1 million of LCM inventory charges related to work-in process inventory and finished goods inventory, respectively, for Wabush. The charges at Eastern Canadian Iron Ore were primarily a result of declines in Platts 62 percent Fe fines spot pricing and the increased cost of production. At the end of March 2014, we idled our Wabush Scully mine in Newfoundland and Labrador and began to implement the permanent closure plan for the mine. In December 2014, iron ore production at the Bloom Lake mine was suspended and the Bloom Lake mine was placed in ‘‘care-and-maintenance’’ mode.
For the year ended December 31, 2013, the LCM concentrate and pellet inventory charges recorded were $13.2 million and $11.1 million, respectively, which were recorded in Cost of goods sold and operating expenses in the Statements of Consolidated Operations for our Eastern Canadian Iron Ore operations. Additionally, we recorded unsaleable inventory impairment charges of $10.6 million and $7.9 million, respectively, relating to Wabush pellets and concentrate inventory. Both of these charges were recorded in Cost of goods sold and operating expenses during 2013 and included in the Statements of Consolidated Operations for the year ended December 31, 2013 for our Eastern Canadian Iron Ore operations.
No LCM inventory adjustments were recorded for the year ended December 31, 2012 within the Eastern Canadian Iron Ore operating segment results.
NOTE 4 - PROPERTY, PLANT AND EQUIPMENT
The following table indicates the value of each of the major classes of our consolidated depreciable assets as of December 31, 2014 and 2013:
|
| | | | | | | |
| (In Millions) |
| December 31, |
| 2014 | | 2013 |
Land rights and mineral rights | $ | 590.2 |
| | $ | 7,819.6 |
|
Office and information technology | 75.5 |
| | 125.7 |
|
Buildings | 65.6 |
| | 255.2 |
|
Mining equipment | 732.6 |
| | 1,819.3 |
|
Processing equipment | 567.4 |
| | 2,148.6 |
|
Electric power facilities | 48.8 |
| | 114.3 |
|
Land improvements | 25.5 |
| | 69.3 |
|
Other | 60.8 |
| | 227.6 |
|
Construction in-progress | 51.3 |
| | 991.3 |
|
| 2,217.7 |
| | 13,570.9 |
|
Allowance for depreciation and depletion | (802.8 | ) | | (2,417.5 | ) |
| $ | 1,414.9 |
| | $ | 11,153.4 |
|
We recorded depreciation expense of $320.6 million, $366.9 million and $293.5 million in the Statements of Consolidated Operations for the years ended December 31, 2014, 2013 and 2012, respectively.
At December 31, 2014, there was no accumulated amount of capitalized interest included within construction-in-progress. At December 31, 2013, $31.4 million of capitalized interest was included within construction in-progress, of which $17.4 million was capitalized during 2013.
During the second half of 2014, due to lower than previously expected profits as a result of decreased iron ore pricing expectations and increased costs, we determined that indicators of impairment with respect to certain of our long-lived assets or asset groups existed. Our asset groups generally consist of the assets and liabilities of one or more mines, preparation plants and associated reserves for which the lowest level of identifiable cash flows largely are independent of cash flows of other mines, preparation plants and associated reserves.
As a result of these assessments during 2014, we determined that the future cash flows associated with our Eastern Canadian Iron Ore, Asia Pacific Iron Ore, North American Coal and Ferroalloys asset groups were not sufficient to support the recoverability of the carrying value of these productive assets. Accordingly, during 2014, an other long-lived asset impairment charge of $8,839.0 million was recorded as Impairment of goodwill and other long-lived assets in the Statements of Consolidated Operations related to property, plant and equipment. The fair value estimates were calculated using income and market approaches. Refer to NOTE 6 - FAIR VALUE OF FINANCIAL INSTRUMENTS for further discussion of these impairments and related fair value estimates.
During the fourth quarter of 2013, we experienced higher than expected production costs and operational inefficiencies at our Wabush operations within our Eastern Canadian Iron Ore operating segment that resulted in continued declines in our profitability of that business, which represented an asset group for purposes of testing our long-lived assets for recoverability. Upon completion of an impairment analysis, it was determined the fair value was less than the carrying value of the asset group, which resulted in an other long-lived asset impairment charge of tangible property, plant and equipment of $140.1 million as Impairment of goodwill and other long-lived assets in the Statements of Consolidated Operations for the year ended December 31, 2013. The fair value estimate was calculated using a market approach.
The net book value of the land rights and mineral rights as of December 31, 2014 and 2013 is as follows:
|
| | | | | | | |
| (In Millions) |
| December 31, |
| 2014 | | 2013 |
Land rights | $ | 31.9 |
| | $ | 46.3 |
|
Mineral rights: |
| |
|
Cost | $ | 558.3 |
| | $ | 7,773.3 |
|
Depletion | (101.3 | ) | | (942.6 | ) |
Net mineral rights | $ | 457.0 |
| | $ | 6,830.7 |
|
Accumulated depletion relating to mineral rights, which was recorded using the unit-of-production method, is included in Cost of goods sold and operating expenses. We recorded depletion expense of $173.0 million, $206.5 million and $209.8 million in the Statements of Consolidated Operations for the years ended December 31, 2014, 2013 and 2012, respectively. As discussed above, during 2014 we performed impairment assessments with respect to certain of our long-lived assets or asset groups. As a result of these assessments, we recorded an other long-lived asset impairment charge related to mineral rights of $5,772.7 million associated with our Eastern Canadian Iron Ore, Asia Pacific Iron Ore, North American Coal and Ferroalloys asset groups.
NOTE 5 - DEBT AND CREDIT FACILITIES
The following represents a summary of our long-term debt as of December 31, 2014 and 2013:
|
| | | | | | | | | | | | | | | |
($ in Millions) | |
December 31, 2014 | |
Debt Instrument | | Type | | Annual Effective Interest Rate | | Final Maturity | | Total Principal Amount | | Total Debt | |
$700 Million 4.875% 2021 Senior Notes | | Fixed | | 4.88% | | 2021 | | $ | 690.0 |
| | $ | 689.5 |
| (1) |
$1.3 Billion Senior Notes: | | | | | | | | | | | |
$500 Million 4.80% 2020 Senior Notes | | Fixed | | 4.83% | | 2020 | | 490.0 |
| | 489.4 |
| (2) |
$800 Million 6.25% 2040 Senior Notes | | Fixed | | 6.34% | | 2040 | | 800.0 |
| | 790.5 |
| (3) |
$400 Million 5.90% 2020 Senior Notes | | Fixed | | 5.98% | | 2020 | | 395.0 |
| | 393.7 |
| (4) |
$500 Million 3.95% 2018 Senior Notes | | Fixed | | 5.17% | | 2018 | | 480.0 |
| | 477.4 |
| (5) |
$1.125 Billion Credit Facility: | | | | | | | | | | | |
Revolving Credit Agreement | | Variable | | 2.94% | | 2017 | | 1,125.0 |
| | — |
| (6) |
Equipment Loans | | Fixed | | Various | | 2020 | | 164.8 |
| | 140.8 |
| |
Fair Value Adjustment to Interest Rate Hedge | | | | | | | | | | 2.8 |
| |
Total debt | | | | | | | | $ | 4,144.8 |
| | $ | 2,984.1 |
| |
Less current portion | | | |
| | | | | | 21.8 |
| |
Long-term debt | | | | | | | | | | $ | 2,962.3 |
| |
|
| | | | | | | | | | | | | | | |
($ in Millions) | |
December 31, 2013 | |
Debt Instrument | | Type | | Annual Effective Interest Rate | | Final Maturity | | Total Face Amount | | Total Debt | |
$700 Million 4.875% 2021 Senior Notes | | Fixed | | 4.88% | | 2021 | | $ | 700.0 |
| | $ | 699.4 |
| (1) |
$1.3 Billion Senior Notes: | | | | | | | | | | | |
$500 Million 4.80% 2020 Senior Notes | | Fixed | | 4.83% | | 2020 | | 500.0 |
| | 499.2 |
| (2) |
$800 Million 6.25% 2040 Senior Notes | | Fixed | | 6.34% | | 2040 | | 800.0 |
| | 790.4 |
| (3) |
$400 Million 5.90% 2020 Senior Notes | | Fixed | | 5.98% | | 2020 | | 400.0 |
| | 398.4 |
| (4) |
$500 Million 3.95% 2018 Senior Notes | | Fixed | | 4.14% | | 2018 | | 500.0 |
| | 496.5 |
| (5) |
$1.75 Billion Credit Facility: | | | | | | | | | | | |
Revolving Loan | | Variable | | 1.64% | | 2017 | | 1,750.0 |
| | — |
| (6) |
Equipment Loans | | Fixed | | Various | | 2020 | | 164.8 |
| | 161.7 |
| |
Fair Value Adjustment to Interest Rate Hedge | | | | | | | | | | (2.1 | ) | |
Total debt | | | | | | | | $ | 4,814.8 |
| | $ | 3,043.5 |
| |
Less current portion | | | | | | | | | | 20.9 |
| |
Long-term debt | | | | | | | | | | $ | 3,022.6 |
| |
| |
(1) | During the fourth quarter of 2014, we purchased $10.0 million of outstanding 4.875 percent senior notes that were trading at a discount of 40.5 percent which resulted in a gain on the extinguishment of debt of $4.1 million. As of December 31, 2014, the $700.0 million 4.875 percent senior notes were recorded at a par value of $690.0 million less unamortized discounts of $0.5 million, based on an imputed interest rate of 4.88 percent. As of December 31, 2013, the $700.0 million 4.875 percent senior notes were recorded at a par value of $700.0 million less unamortized discounts of $0.6 million, based on an imputed interest rate of 4.88 percent. |
| |
(2) | During the fourth quarter of 2014, we purchased $10.0 million of outstanding 4.80 percent senior notes that were trading at a discount of 40.25 percent which resulted in a gain on the extinguishment of debt of $4.0 million. As of December 31, 2014, the $500.0 million 4.80 percent senior notes were recorded at a par value of $490.0 million less unamortized discounts of $0.6 million, based on an imputed interest rate of 4.83 percent. As of December 31, 2013, the $500.0 million 4.80 percent senior notes were recorded at a par value of $500.0 million less unamortized discounts of $0.8 million, based on an imputed interest rate of 4.83 percent. |
| |
(3) | As of December 31, 2014 and December 31, 2013, the $800.0 million 6.25 percent senior notes were recorded at par value of $800.0 million less unamortized discounts of $9.5 million and $9.6 million, respectively, based on an imputed interest rate of 6.34 percent. |
| |
(4) | During the fourth quarter of 2014, we purchased $5.0 million of outstanding 5.90 percent senior notes that were trading at a discount of 38.125 percent which resulted in a gain on the extinguishment of debt of $1.9 million. As of December 31, 2014, the $400.0 million 5.90 percent senior notes were recorded at a par value of $395.0 million less unamortized discounts of $1.3 million, based on an imputed interest rate of 5.98 percent. As of December 31, 2013, the $400.0 million 5.90 percent senior notes were recorded at a par value of $400.0 million less unamortized discounts of $1.6 million, based on an imputed interest rate of 5.98 percent. |
| |
(5) | During the fourth quarter of 2014, we purchased $20.0 million of outstanding 3.95 percent senior notes that were trading at a discount of 30.875 percent which resulted in a gain on the extinguishment of debt of $6.2 million. As of December 31, 2014, the $500.0 million 3.95 percent senior notes were recorded at a par value of $480.0 million less unamortized discounts of $2.6 million, based on an imputed interest rate of 5.17 percent. As of December 31, 2013, the $500.0 million 3.95 percent senior notes were recorded at a par value of $500.0 million less unamortized discounts of $3.5 million, based on an imputed interest rate of 4.14 percent. |
| |
(6) | As of December 31, 2014 and 2013, no revolving loans were drawn under the credit facility. We had total availability of $1.125 billion and $1.75 billion on our credit facility as of December 31, 2014 and 2013, respectively. Additionally, as of December 31, 2014 and December 31, 2013, the principal amount of letter of credit obligations totaled $149.5 million and $8.4 million, respectively, thereby reducing available borrowing capacity to $1.0 billion and $1.7 billion for each period, respectively. |
Credit Facility
On October 24, 2014, we amended the revolving credit agreement (Amendment No 5.) to effect the following:
| |
• | Reduces the size of the existing facility from $1.25 billion to $1.125 billion. |
| |
• | Grants a valid and perfected first-priority (subject to certain permitted liens) security interest in certain property and assets of the Company and certain of its subsidiaries, subject to customary exclusions all specified in a security agreement. |
| |
• | With effect as of September 30, 2014, removes the maximum balance sheet leverage ratio of debt to capitalization of less than 45 percent, which was a covenant introduced in June 2014, and replaces that covenant with a maximum leverage ratio covenant of secured debt to EBITDA that is not to exceed 3.5 times. |
| |
• | Retains the minimum interest coverage ratio requirement of 3.5 times, and was subsequently reduced to 2.0 times upon completion of certain collateral actions within 60 days of the execution of the amendment. The collateral requirements were satisfied as of December 23, 2014. |
| |
• | Subjects restricted payments (including the $200 million share repurchase, which was approved in September 2014) and current dividend structure to a $400 million liquidity test. |
| |
• | Adds limitations regarding acquisitions, investments (including investments in non-wholly owned subsidiaries and joint ventures) and subsidiary debt. |
| |
• | Eliminates the accounts receivable securitization facility. |
| |
• | Terminates the ability to have foreign borrowers under the revolving credit agreement. |
On September 9, 2014, we amended the revolving credit agreement (Amendment No. 4) to effect the following:
| |
• | Permitting a one-time exemption of up to $200 million in share repurchases (consummated in a single transaction or series of related transactions), effective until December 31, 2015. We are not obligated to make any purchases and the program may be suspended or discontinued at any time. |
| |
• | Reducing the size of the existing unsecured facility from $1.75 billion to $1.25 billion. |
| |
• | Adding restrictions on the granting of certain pledges and guarantees. |
| |
• | Adding an obligation to enter into a security agreement, on or before June 30, 2015, to grant security interests to secure obligations under the revolving credit agreement on U.S. receivables and inventory, other than receivables and related property subject to certain existing receivable securitization or other facilities, a pledge of 65 percent of the stock of all material, wholly-owned first-tier foreign subsidiaries and a pledge of all of the stock of all material U.S. subsidiaries, in each case, subject to certain limitations. |
All terms of Amendment No. 3 as of June 30, 2014, as discussed below, remained in place and were not changed by Amendment No. 4 as of September 9, 2014.
On June 30, 2014, we amended the revolving credit agreement (Amendment No. 3) to effect the following:
| |
• | Replacing the current maximum leverage covenant ratio of debt to earnings of less than 3.5 times with a maximum balance sheet leverage ratio of debt to capitalization of less than 45 percent. |
| |
• | Resetting the minimum interest coverage ratio from 2.5 to 1.0 to the ratio of 3.5 to 1.0. |
| |
• | Amending the definition of EBITDA to include certain cash charges related to the Company’s Wabush mine and other cash restructuring charges and the definition of net worth to exclude up to $1.0 billion in non-cash impairment charges. |
| |
• | Modifying the covenants restricting certain investments and acquisitions, the incurrence of certain indebtedness and liens, and the amount of dividends that may be declared or paid and shares that may be repurchased. |
On January 22, 2015, we further amended the revolving credit agreement. Refer to NOTE 21 - SUBSEQUENT EVENTS for further information regarding Amendment No. 6.
As of December 31, 2014 and 2013, we were in compliance with all applicable financial covenants related to the revolving credit agreement.
$500 Million Senior Notes — 2012 Offering
On December 6, 2012, we completed a $500 million public offering of senior notes at 3.95 percent due January 15, 2018. Interest is fixed and is payable on January 15 and July 15 of each year, beginning on July 15, 2013 until maturity. The senior notes are unsecured obligations and rank equally in right of payment with all our other existing and future unsecured and unsubordinated indebtedness. There are no subsidiary guarantees of the interest and principal amounts. A portion of the net proceeds from the senior notes offering were used on December 28, 2012 to repay $270.0 million and $55.0 million outstanding private placement senior notes in the aggregate and also for the repayment of a portion of the borrowings outstanding under the term loan and the revolving credit facility.
The senior notes may be redeemed any time at our option not less than 30 days nor more than 60 days after prior notice is sent to the holders of the applicable series of notes. The senior notes are redeemable at a redemption price equal to the greater of (1) 100 percent of the principal amount of the notes to be redeemed or (2) the sum of the present values of the remaining scheduled payments of principal and interest on the notes to be redeemed, discounted to the redemption date on a semi-annual basis at the treasury rate plus 50 basis points with respect to the 2018 senior notes, plus, in each case, accrued and unpaid interest to the date of redemption.
In addition, if a change of control triggering event occurs with respect to the senior notes, as defined in the agreement, we will be required to offer to purchase the notes of the applicable series at a purchase price equal to 101 percent of the principal amount, plus accrued and unpaid interest, if any, to the date of purchase.
The terms of the senior notes contain certain customary covenants; however, there are no financial covenants.
Interest Rate Adjustment Based on Rating Events
The interest rate payable on the $500.0 million 3.95 percent senior notes may be subject to adjustments from time to time if either Moody's or S&P or, in either case, any Substitute Rating Agency thereof downgrades (or subsequently upgrades) the debt rating assigned to the senior notes. In no event shall (1) the interest rate for the senior notes be reduced to below the interest rate payable on the senior notes on the date of the initial issuance of senior notes or (2) the total increase in the interest rate on the senior notes exceed 2.00 percent above the interest rate payable on the senior notes on the date of the initial issuance of senior notes. During 2014, the interest rate payable on the $500.0 million 3.95 percent senior notes was increased from 3.95 percent ultimately to 5.70 percent based on Substitute Rating Agency downgrades throughout the year.
$1 Billion Senior Notes — 2011 Offering
On March 23, 2011 and April 1, 2011, respectively, we completed a $1 billion public offering of senior notes consisting of two tranches: a 10-year tranche of $700 million aggregate principal amount at 4.88 percent senior notes due April 1, 2021, and a 30-year tranche of $300 million aggregate principal amount at 6.25 percent senior notes due October 1, 2040, of which $500 million aggregate principal amount previously was issued during September 2010. Interest is fixed and is payable on April 1 and October 1 of each year, beginning on October 1, 2011, for both series of senior notes until maturity. The senior notes are unsecured obligations and rank equally in right of payment with all our other existing and future unsecured and unsubordinated indebtedness. There are no subsidiary guarantees of the interest and principal amounts. The net proceeds from the senior notes offering were used to fund a portion of the acquisition of Consolidated Thompson and to pay the related fees and expenses.
The senior notes may be redeemed any time at our option not less than 30 days nor more than 60 days after prior notice is sent to the holders of the applicable series of notes. The senior notes are redeemable at a redemption price equal to the greater of (1) 100 percent of the principal amount of the notes to be redeemed or (2) the sum of the present values of the remaining scheduled payments of principal and interest on the notes to be redeemed, discounted to the redemption date on a semi-annual basis at the treasury rate plus 25 basis points with respect to the 2021 senior notes and 40 basis points with respect to the 2040 senior notes, plus, in each case, accrued and unpaid interest to the date of redemption. However, if the 2021 senior notes are redeemed on or after the date that is three months prior to their maturity date, the 2021 senior notes will be redeemed at a redemption price equal to 100 percent of the principal amount of the notes to be redeemed plus accrued and unpaid interest to the date of redemption.
In addition, if a change of control triggering event occurs with respect to the senior notes, as defined in the agreement, we will be required to offer to purchase the notes of the applicable series at a purchase price equal to 101 percent of the principal amount, plus accrued and unpaid interest, if any, to the date of purchase.
The terms of the senior notes contain certain customary covenants; however, there are no financial covenants.
$1 Billion Senior Notes — 2010 Offering
On September 20, 2010, we completed a $1 billion public offering of senior notes consisting of two tranches: a 10-year tranche of $500 million aggregate principal amount at 4.80 percent due October 1, 2020, and a 30-year tranche of $500 million aggregate principal amount at 6.25 percent due October 1, 2040. Interest is fixed and is payable on April 1 and October 1 of each year, beginning on April 1, 2011, for both series of senior notes until maturity. The senior notes are unsecured obligations and rank equally in right of payment with all of our other existing and future senior unsecured and unsubordinated indebtedness. There are no subsidiary guarantees of the interest and principal amounts.
A portion of the net proceeds from the senior notes offering was used on September 22, 2010 to repay $350 million outstanding under our credit facility. A portion of the net proceeds was also used for general corporate purposes, including funding of capital expenditures and were used to fund a portion of the acquisition of Consolidated Thompson and related expenses.
The senior notes may be redeemed any time at our option not less than 30 days nor more than 60 days after prior notice is sent to the holders of the applicable series of notes. The senior notes are redeemable at a redemption price equal to the greater of (1) 100 percent of the principal amount of the notes to be redeemed or (2) the sum of the present values of the remaining scheduled payments of principal and interest on the notes to be redeemed, discounted to the redemption date on a semi-annual basis at the treasury rate plus 35 basis points with respect to the 2020 senior notes and 40 basis points with respect to the 2040 senior notes, plus, in each case, accrued and unpaid interest to the date of redemption. In addition, if a change of control triggering event occurs with respect to the notes, we will be required to offer to purchase the notes at a purchase price equal to 101 percent of the principal amount, plus accrued and unpaid interest to the date of purchase.
The terms of the senior notes contain certain customary covenants; however, there are no financial covenants.
$400 Million Senior Notes Offering — 2010 Offering
On March 17, 2010, we completed a $400 million public offering of senior notes due March 15, 2020. Interest at a fixed rate of 5.90 percent is payable on March 15 and September 15 of each year, beginning on September 15, 2010, until maturity on March 15, 2020. The senior notes are unsecured obligations and rank equally in right of payment with all of our other existing and future senior unsecured and unsubordinated indebtedness. There are no subsidiary guarantees of the interest and principal amounts.
A portion of the net proceeds from the senior notes offering was used on March 31, 2010 to repay our $200 million term loan under our credit facility, as well as to repay on May 27, 2010 our share of Amapá’s remaining debt outstanding of $100.8 million. In addition, we used the remainder of the net proceeds to help fund the acquisitions of Spider and CLCC during the third quarter of 2010.
The senior notes may be redeemed any time at our option not less than 30 days nor more than 60 days after prior notice is sent to the holders of the applicable series of notes. The senior notes are redeemable at a redemption price equal to the greater of (1) 100 percent of the principal amount of the notes to be redeemed or (2) the sum of the present values of the remaining scheduled payments of principal and interest on the notes to be redeemed, discounted to the redemption date on a semi-annual basis, plus accrued and unpaid interest to the date of redemption. In addition, if a change of control triggering event occurs, we will be required to offer to purchase the notes at a purchase price equal to 101 percent of the principal amount, plus accrued and unpaid interest to the date of purchase.
The terms of the senior notes contain certain customary covenants; however, there are no financial covenants.
Equipment Loans
During the second half of 2013, we entered into $164.8 million of seven-year installment equipment loans with various interest rates. The loans are secured by equipment from our Eastern Canadian Iron Ore operations as well as a parent guarantee. Proceeds from the borrowings were used for general corporate purposes.
Short-Term Facilities
Asia Pacific Iron Ore maintains a bank contingent instrument and cash advance facility. The facility, which is renewable annually at the bank’s discretion, provides A$3.0 million ($2.5 million) at December 31, 2014 in credit for contingent instruments, such as performance bonds, and the ability to request a cash advance facility to be provided at the discretion of the bank. The facility limit was reduced from A$30.0 million to A$3.0 million during the fourth quarter of 2014. At December 31, 2013, the facility provided A$30.0 million ($26.8 million) in credit for contingent instruments. As of December 31, 2014, the outstanding bank guarantees under the facility totaled A$1.5 million ($1.2 million), thereby reducing borrowing capacity to A$1.5 million ($1.3 million). As of December 31, 2013, the outstanding bank guarantees under the facility totaled A$23.0 million ($20.5 million), thereby reducing borrowing capacity to A$7.0 million ($6.3 million). We have provided a guarantee of the facility, along with certain of our Australian subsidiaries. The terms of the short-term facility contain certain customary covenants; however, there are no financial covenants.
Letters of Credit
We have outstanding letters of credit provided for under the amended revolving credit agreement which totaled $149.5 million and $8.4 million as of December 31, 2014 and December 31, 2013, respectively. Additionally, we issued standby letters of credit with certain financial institutions in addition to the letters of credit provided for under the revolving credit agreement of $48.0 million as of December 31, 2013.
Debt Maturities
The following represents a summary of our maturities of debt instruments, excluding borrowings on the amended revolving credit agreement, based on the principal amounts outstanding at December 31, 2014:
|
| | | |
| (In Millions) |
| Maturities of Debt |
2015 | $ | 21.8 |
|
2016 | 22.7 |
|
2017 | 23.6 |
|
2018 | 504.6 |
|
2019 | 25.5 |
|
2020 and thereafter | 2,397.6 |
|
Total maturities of debt | $ | 2,995.8 |
|
NOTE 6 - FAIR VALUE OF FINANCIAL INSTRUMENTS
The following represents the assets and liabilities of the Company measured at fair value at December 31, 2014 and 2013:
|
| | | | | | | | | | | | | | | |
| (In Millions) |
| December 31, 2014 |
Description | Quoted Prices in Active Markets for Identical Assets/Liabilities (Level 1) | | Significant Other Observable Inputs (Level 2) | | Significant Unobservable Inputs (Level 3) | | Total |
Assets: | | | | | | | |
Derivative assets | — |
| | — |
| | 63.2 |
| | 63.2 |
|
Available-for-sale marketable securities | 4.3 |
| | — |
| | — |
| | 4.3 |
|
Total | $ | 4.3 |
| | $ | — |
| | $ | 63.2 |
| | $ | 67.5 |
|
Liabilities: |
| |
| |
| |
|
Derivative liabilities | $ | — |
| | $ | — |
| | $ | 11.8 |
| | $ | 11.8 |
|
Foreign exchange contracts | — |
| | 31.5 |
| | — |
| | 31.5 |
|
Total | $ | — |
| | $ | 31.5 |
| | $ | 11.8 |
| | $ | 43.3 |
|
|
| | | | | | | | | | | | | | | |
| (In Millions) |
| December 31, 2013 |
Description | Quoted Prices in Active Markets for Identical Assets/Liabilities (Level 1) | | Significant Other Observable Inputs (Level 2) | | Significant Unobservable Inputs (Level 3) | | Total |
Assets: | | | | | | | |
Cash equivalents | $ | 85.0 |
| | $ | — |
| | $ | — |
| | $ | 85.0 |
|
Derivative assets | — |
| | — |
| | 58.9 |
| | 58.9 |
|
Available-for-sale marketable securities | 21.4 |
| | — |
| | — |
| | 21.4 |
|
Foreign exchange contracts | — |
| | 0.3 |
| | — |
| | 0.3 |
|
Total | $ | 106.4 |
| | $ | 0.3 |
| | $ | 58.9 |
| | $ | 165.6 |
|
Liabilities: |
| |
| |
| |
|
Derivative liabilities | $ | — |
| | $ | 2.1 |
| | $ | 10.3 |
| | $ | 12.4 |
|
Foreign exchange contracts | — |
| | 26.9 |
| | — |
| | 26.9 |
|
Total | $ | — |
| | $ | 29.0 |
| | $ | 10.3 |
| | $ | 39.3 |
|
Financial assets classified in Level 1 at December 31, 2014 include available-for-sale marketable securities. Financial assets classified in Level 1 at December 31, 2013 include money market funds and available-for-sale marketable securities. The valuation of these instruments is based upon unadjusted quoted prices for identical assets in active markets.
The valuation of financial assets and liabilities classified in Level 2 is determined using a market approach based upon quoted prices for similar assets and liabilities in active markets, or other inputs that are observable. Level 2 securities primarily include derivative financial instruments valued using financial models that use as their basis readily observable market parameters. At December 31, 2014, such derivative financial instruments included our existing foreign currency exchange contracts. At December 31, 2013, such derivative financial instruments included our existing foreign currency exchange contracts and interest rate swaps. The fair value of the foreign currency exchange contracts
is based on forward market prices and represents the estimated amount we would receive or pay to terminate these agreements at the reporting date, taking into account creditworthiness, nonperformance risk and liquidity risks associated with current market conditions.
The derivative assets classified within Level 3 at December 31, 2014 and December 31, 2013 included a freestanding derivative instrument related to certain supply agreements with one of our U.S. Iron Ore customers. The agreements include provisions for supplemental revenue or refunds based on the customer’s annual steel pricing at the time the product is consumed in the customer’s blast furnaces. We account for this provision as a derivative instrument at the time of sale and adjust this provision to fair value as an adjustment to Product revenues each reporting period until the product is consumed and the amounts are settled. The fair value of the instrument is determined using a market approach based on an estimate of the annual realized price of hot-rolled steel at the steelmaker’s facilities, and takes into consideration current market conditions and nonperformance risk.
The Level 3 derivative assets and liabilities at December 31, 2014 and December 31, 2013 also consisted of derivatives related to certain provisional pricing arrangements with our U.S. Iron Ore, Asia Pacific Iron Ore and Eastern Canadian Iron Ore customers. These provisional pricing arrangements specify provisional price calculations, where the pricing mechanisms generally are based on market pricing, with the final revenue rate to be based on market inputs at a specified point in time in the future, per the terms of the supply agreements. The difference between the provisionally agreed-upon price and the estimated final revenue rate is characterized as a derivative and is required to be accounted for separately once the revenue has been recognized. The derivative instrument is adjusted to fair value through Product revenues each reporting period based upon current market data and forward-looking estimates provided by management until the final revenue rate is determined.
The following table illustrates information about quantitative inputs and assumptions for the derivative assets and derivative liabilities categorized in Level 3 of the fair value hierarchy:
|
| | | | | | | | | | | | |
Qualitative/Quantitative Information About Level 3 Fair Value Measurements |
($ in millions) | | Fair Value at | | Balance Sheet Location | | Valuation Technique | | Unobservable Input | | Range or Point Estimate (Weighted Average) |
| 12/31/2014 |
Provisional Pricing Arrangements | | $ | 11.8 |
| | Other current liabilities | | Market Approach | | Management's Estimate of 62% Fe | | $72 |
Customer Supply Agreement | | $ | 63.2 |
| | Other current assets | | Market Approach | | Hot-Rolled Steel Estimate | | $590 - $640 ($610) |
The significant unobservable input used in the fair value measurement of the reporting entity’s provisional pricing arrangements is management’s estimate of 62 percent Fe fines spot price based upon current market data, including historical seasonality and forward-looking estimates determined by management. Significant increases or decreases in this input would result in a significantly higher or lower fair value measurement, respectively.
The significant unobservable input used in the fair value measurement of the reporting entity’s customer supply agreements is the future hot-rolled steel price that is estimated based on current market data, analysts' projections, projections provided by the customer and forward-looking estimates determined by management. Significant increases or decreases in this input would result in a significantly higher or lower fair value measurement, respectively.
We recognize any transfers between levels as of the beginning of the reporting period, including both transfers into and out of levels. There were no transfers between Level 1 and Level 2 of the fair value hierarchy during the years ended December 31, 2014 and 2013. The following tables represent a reconciliation of the changes in fair value of financial instruments measured at fair value on a recurring basis using significant unobservable inputs (Level 3) for the years ended December 31, 2014 and 2013.
|
| | | | | | | | | | | | | | | |
| (In Millions) |
| Derivative Assets (Level 3) | | Derivative Liabilities (Level 3) |
| Year Ended
December 31, | | Year Ended
December 31, |
| 2014 | | 2013 | | 2014 | | 2013 |
Beginning balance - January 1 | $ | 58.9 |
| | $ | 62.4 |
| | $ | (10.3 | ) | | $ | (11.3 | ) |
Total gains (losses) | | | | | | | |
Included in earnings | 187.8 |
| | 152.3 |
| | (11.8 | ) | | (10.3 | ) |
Settlements | (183.5 | ) | | (155.8 | ) | | 10.3 |
| | 11.3 |
|
Transfers into Level 3 | — |
| | — |
| | — |
| | — |
|
Transfers out of Level 3 | — |
| | — |
| | — |
| | — |
|
Ending balance - December 31 | $ | 63.2 |
| | $ | 58.9 |
| | $ | (11.8 | ) | | $ | (10.3 | ) |
Total gains (losses) for the period included in earnings attributable to the change in unrealized gains (losses) on assets still held at the reporting date | $ | 187.8 |
| | $ | 152.3 |
| | $ | (11.8 | ) | | $ | (10.3 | ) |
Gains and losses included in earnings are reported in Product revenues in the Statements of Consolidated Operations for the years ended December 31, 2014 and 2013.
The carrying amount for certain financial instruments (e.g. Accounts receivable, net, Accounts payable and Accrued expenses) approximate fair value and, therefore, have been excluded from the table below. A summary of the carrying amount and fair value of other financial instruments at December 31, 2014 and 2013 were as follows:
|
| | | | | | | | | | | | | | | | | |
| | | (In Millions) |
| | | December 31, 2014 | | December 31, 2013 |
| Classification | | Carrying Value | | Fair Value | | Carrying Value | | Fair Value |
Long-term debt: | | | | | | | | | |
Senior notes—$700 million | Level 2 | | 689.5 |
| | 367.3 |
| | 699.4 |
| | 718.2 |
|
Senior notes—$1.3 billion | Level 2 | | 1,279.9 |
| | 704.0 |
| | 1,289.6 |
| | 1,404.9 |
|
Senior notes—$400 million | Level 2 | | 393.7 |
| | 228.1 |
| | 398.4 |
| | 432.1 |
|
Senior notes—$500 million | Level 2 | | 477.4 |
| | 312.0 |
| | 496.5 |
| | 523.8 |
|
Revolving loan | Level 2 | | — |
| | — |
| | — |
| | — |
|
Equipment Loan Facilities | Level 2 | | 119.0 |
| | 119.0 |
| | 140.8 |
| | 140.8 |
|
Fair Value Adjustment to Interest Rate Hedge | Level 2 | | 2.8 |
| | 2.8 |
| | (2.1 | ) | | (2.1 | ) |
Total long-term debt | | | $ | 2,962.3 |
| | $ | 1,733.2 |
| | $ | 3,022.6 |
| | $ | 3,217.7 |
|
The fair value of long-term debt was determined using quoted market prices or discounted cash flows based upon current borrowing rates. The revolving loan and equipment loan facilities are variable rate interest and approximate fair value. See NOTE 5 - DEBT AND CREDIT FACILITIES for further information.
Items Measured at Fair Value on a Non-Recurring Basis
The following tables present information about the impairment charges on both financial and nonfinancial assets that were measured on a fair value basis at December 31, 2014 and December 31, 2013. The table also indicates the fair value hierarchy of the valuation techniques used to determine such fair value.
|
| | | | | | | | | | | | | | | | | | | | |
| | (In Millions) |
| | Year Ended December 31, 2014 |
Description | | Quoted Prices in Active Markets for Identical Assets/ Liabilities (Level 1) | | Significant Other Observable Inputs (Level 2) | | Significant Unobservable Inputs (Level 3) | | Total | | Total Losses |
Assets: | | | | | | | | | | |
Goodwill impairment -
Asia Pacific Iron Ore reporting unit | | $ | — |
| | $ | — |
| | $ | — |
| | $ | — |
| | $ | 73.5 |
|
Other long-lived assets -
Property, plant and equipment and Mineral rights: | | | | | | | | | | |
Asia Pacific Iron Ore reporting unit | | — |
| | — |
| | 72.4 |
| | 72.4 |
| | 526.5 |
|
North American Coal reporting unit | | | | | | | | | | |
CLCC thermal asset group | | — |
| | — |
| | 62.6 |
| | 62.6 |
| | 195.5 |
|
Pinnacle asset group | | — |
| | — |
| | 30.7 |
| | 30.7 |
| | 394.5 |
|
Oak Grove asset group | | — |
| | — |
| | 23.4 |
| | 23.4 |
| | 267.5 |
|
Eastern Canadian Iron Ore reporting unit | | | | | | | | | | |
Bloom Lake asset group | | — |
| | — |
| | 187.9 |
| | 187.9 |
| | 7,043.7 |
|
Wabush asset group | | — |
| | — |
| | 42.7 |
| | 42.7 |
| | 132.6 |
|
Ferroalloys reporting unit | | — |
| | — |
| | 12.2 |
| | 12.2 |
| | 259.5 |
|
Other reporting units | | — |
| | — |
| | — |
| | — |
| | 19.2 |
|
Other long-lived assets -
Intangibles and other long-term assets: | | | | | | | | | | |
Asia Pacific Iron Ore reporting unit | | — |
| | — |
| | 7.0 |
| | 7.0 |
| | 24.2 |
|
Eastern Canadian Iron Ore reporting unit | | | | | | | | | | |
Bloom Lake asset group | | — |
| | — |
| | — |
| | — |
| | 56.2 |
|
Wabush asset group | | — |
| | — |
| | — |
| | — |
| | 36.7 |
|
Ferroalloys reporting unit | | — |
| | — |
| | — |
| | — |
| | 0.3 |
|
Investment in ventures
impairment - Global Exploration | | — |
| | — |
| | — |
| | — |
| | 9.2 |
|
| | $ | — |
| | $ | — |
| | $ | 438.9 |
| | $ | 438.9 |
| | $ | 9,039.1 |
|
Financial Assets
During the third quarter of 2014, an impairment charge of $9.2 million to investment in ventures was recorded within our Global Exploration operating segment as a decision was made to abandon the investment during the period.
Non-Financial Assets
During the third and fourth quarter of 2014, we identified factors that indicated the carrying values of the asset groups in the chart above may not be recoverable primarily due to long-term price forecasts as part of management’s long-range planning process. Updated estimates of long-term prices for all products, specifically the Platts 62 percent Fe fines spot price, which particularly effects Eastern Canadian Iron Ore and Asia Pacific Iron Ore business segments because their contracts correlate heavily to world market spot pricing, and the benchmark price for premium low-volatile hard coking coal were lower than prior estimates. These estimates were updated based upon current market conditions,
macro-economic factors influencing the balance of supply and demand for our products and expectations for future cost and capital expenditure requirements. Additionally, a new CEO, Lourenco Goncalves, was appointed by the Board of Directors in early August 2014 and subsequently identified as the CODM in accordance with ASC 280, Segment Reporting. The new CODM views Eastern Canadian Iron Ore, Asia Pacific Iron Ore, North American Coal and Ferroalloys as non-core assets and has communicated plans to evaluate the business units for a change in strategy including possible divestiture. These factors, among other considerations utilized in the individual impairment assessments, indicate that the carrying value of the respective asset groups in the chart above and Asia Pacific Iron Ore goodwill may not be recoverable.
During the third quarter of 2014, a goodwill impairment charge of $73.5 million was recorded for our Asia Pacific Iron Ore reporting segment. Based on our review of the fair value hierarchy, the inputs used in these fair value measurements were considered Level 3 inputs.
We also recorded impairment charges to property, plant and equipment, mineral rights, intangible assets and other long-term assets during the second half of 2014 related to our Wabush operation and Bloom Lake operation within our Eastern Canadian Iron Ore operating segment, our Asia Pacific Iron Ore operating segment and our CLCC thermal operation, Oak Grove operation and Pinnacle operation within our North American Coal operating segment, along with impairments charged to reporting units within our Other reportable segments. A detailed break out of the impairment charges is shown in the chart above. The recorded impairment charges reduce the related assets to their estimated fair value as we determined that the future cash flows associated with these operations were not sufficient to support the recoverability of the carrying value of these assets. Fair value was determined based on management's best estimate within a range of fair values, which is considered a Level 3 input, and resulted in an asset impairment charge of $8,956.4 million. The Level 3 inputs used to determine fair value included models developed and market inputs obtained by management which provided a range of fair value estimates of property, plant and equipment. Management’s models include internally developed long-term future cash flow estimates, capital expenditure and cost estimates, market inputs to determine long-term pricing assumptions, discount rates, and foreign exchange rates.
|
| | | | | | | | | | | | | | | | | | | | |
| | (In Millions) |
| | Year Ended December 31, 2013 |
Description | | Quoted Prices in Active Markets for Identical Assets/ Liabilities (Level 1) | | Significant Other Observable Inputs (Level 2) | | Significant Unobservable Inputs (Level 3) | | Total | | Total Losses |
Assets: | | | | | | | | | | |
Goodwill impairment -
Ferroalloys reporting unit | | $ | — |
| | $ | — |
| | $ | — |
| | $ | — |
| | $ | 80.9 |
|
Other long-lived assets -
Property, plant and equipment | | — |
| | — |
| | 46.3 |
| | 46.3 |
| | 155.4 |
|
Other long-lived assets -
Intangibles and long-term deposits | | — |
| | — |
| | 1.6 |
| | 1.6 |
| | 14.5 |
|
Investment in ventures impairment - Amapá | | — |
| | — |
| | — |
| | — |
| | 67.6 |
|
Total | | $ | — |
| | $ | — |
| | $ | 47.9 |
| | $ | 47.9 |
| | $ | 318.4 |
|
Financial Assets
In light of the March 28, 2013 collapse of the Santana port shiploader and subsequent evaluation of the effect that this event had on the carrying value of our investment in Amapá as of June 30, 2013, we recorded an impairment charge of $67.6 million in the second quarter of 2013. The sale of Amapá was completed in the fourth quarter of 2013.
Non-Financial Assets
During the fourth quarter of 2013, a goodwill impairment charge of $80.9 million was recorded for our Cliffs Chromite Ontario and Cliffs Chromite Far North reporting units within our Ferroalloys operating segment. The impairment charge was primarily a result of the decision to indefinitely suspend the Chromite Project and to not allocate additional capital for the project given the uncertain timeline and risks associated with the development of necessary infrastructure to bring the project online. Based on our review of the fair value hierarchy, the inputs used in these fair value measurements were considered Level 3 inputs.
We also recorded an impairment charges to property, plant and equipment during 2013 related to our Wabush operation within our Eastern Canadian Iron Ore operating segment, our Cliffs Chromite Ontario and Cliffs Chromite Far North reporting units within our Other reportable segments and certain mineral lands at our Asia Pacific Iron Ore operating segment to reduce the related assets to their estimated fair value as we determined that the cash flows associated with these operations were not sufficient to support the recoverability of the carrying value of these assets. Fair value was determined based on management's estimate of liquidation value, which is considered a Level 3 input, and resulted in a charge of $155.4 million.
NOTE 7 - PENSIONS AND OTHER POSTRETIREMENT BENEFITS
We offer defined benefit pension plans, defined contribution pension plans and other postretirement benefit plans, primarily consisting of retiree healthcare benefits, to most employees in North America as part of a total compensation and benefits program. We do not have employee retirement benefit obligations at our Asia Pacific Iron Ore operations or our Bloom Lake mine operations within our Eastern Canadian Iron Ore segment. The defined benefit pension plans largely are noncontributory and benefits generally are based on employees’ years of service and average earnings for a defined period prior to retirement or a minimum formula.
The labor agreements we have with the USW at our U.S. Iron Ore operations cover approximately 2,200 USW-represented employees at our Empire and Tilden mines in Michigan and our United Taconite and Hibbing mines in Minnesota, or 40.9 percent of our total workforce. The 2012 USW agreement sets temporary monthly postretirement OPEB caps for participants who retire prior to January 1, 2015. These premium maximums will expire at the end of the contract period and revert to increasing premiums based on the terms of the 2004 bargaining agreement. The agreements also provide for an OPEB cap that will limit the amount of contributions that we have to make toward medical insurance coverage for each retiree and spouse of a retiree per calendar year after it goes into effect. The amount of the annual OPEB cap will be based upon the costs we incurred in 2014. The OPEB cap applies to employees who retire on or after January 1, 2015 and will not apply to surviving spouses. In addition, the agreements renewed the lump sum special payments for certain employees retiring in the near future.
In addition, we currently provide various levels of retirement health care and OPEB to most full-time employees who meet certain length of service and age requirements (a portion of which is pursuant to collective bargaining agreements). Most plans require retiree contributions and have deductibles, co-pay requirements and benefit limits. Most bargaining unit plans require retiree contributions and co-pays for major medical and prescription drug coverage. There is an annual limit on our cost for medical coverage under the U.S. salaried plans. The annual limit applies to each covered participant and equals $7,000 for coverage prior to age 65 and $3,000 for coverage after age 65, with the retiree’s participation adjusted based on the age at which the retiree’s benefits commence. Beginning in 2015, Cliffs is changing the delivery of the post-65 salaried retiree medical benefit program from an employer sponsored plan to the combination of an employer subsidy plan and an individual supplemental Medicare insurance plan purchased through a Medicare exchange. This allows the program to take full advantage of available government subsidies and more efficient pricing in the Medicare market. For participants at our Northshore operation, the annual limit ranges from $4,020 to $4,500 for coverage prior to age 65, and equals $2,000 for coverage after age 65. Covered participants pay an amount for coverage equal to the excess of (i) the average cost of coverage for all covered participants, over (ii) the participant’s individual limit, but in no event will the participant’s cost be less than 15.0 percent of the average cost of coverage for all covered participants. For Northshore participants, the minimum participant cost is a fixed dollar amount. We do not provide OPEB for most U.S. salaried employees hired after January 1, 1993. Retiree healthcare coverage is provided through programs administered by insurance companies whose charges are based on benefits paid.
Our North American Coal segment is required under an agreement with the UMWA to contribute to the UMWA 1974 Pension Trust based principally on hours worked by UMWA-represented employees. This agreement covers approximately 800 UMWA-represented employees at our Pinnacle Complex in West Virginia and our Oak Grove mine in Alabama, or 15.2 percent of our total workforce. The multi-employer pension trust provides pension benefits to eligible retirees through a defined benefit plan. The UMWA 1993 Benefit Plan is a defined contribution plan that was created as
the result of negotiations for the NBCWA of 1993. The plan provides healthcare insurance to orphan UMWA retirees who are not eligible to participate in the UMWA Combined Benefit Fund or the 1992 Benefit Fund or whose last employer signed the 1993 or later NBCWA and who subsequently goes out of business. Contributions to the trust were at a rate of $8.16 per hour worked 2014 and at a rate of $8.10 per hour worked for both 2013 and 2012. These amounted to $13.8 million in 2014 and $14.9 million in both 2013 and 2012, respectively. Our Pinnacle and Oak Grove mines are signatories to labor agreements with the UMWA, making them participants in the UMWA 1974 Pension Plan (the "1974 PP"). As of the most recent estimate, Pinnacle and Oak Grove's combined share of this underfunded liability was estimated to be approximately $330 million. If Pinnacle or Oak Grove were to withdraw from the 1974 PP or if a mass withdrawal were to occur, we would become obligated to satisfy our withdrawal liability to the 1974 PP.
In December 2003, The Medicare Prescription Drug, Improvement, and Modernization Act of 2003 was enacted. This act introduced a prescription drug benefit under Medicare Part D as well as a federal subsidy to sponsors of retiree healthcare benefit plans that provide a benefit that at least actuarially is equivalent to Medicare Part D. Our measures of the accumulated postretirement benefit obligation and net periodic postretirement benefit cost as of December 31, 2004 and for periods thereafter reflect amounts associated with the subsidy. We elected to adopt the retroactive transition method for recognizing the cost reduction in 2004.
The shut-down of the Wabush Scully mine on October 31, 2014 and the idling at Bloom Lake as of December 31, 2014 affected employees of both the Wabush Scully mine and Pointe Noire locations, triggering early retirement benefits for those hourly and salaried plan participants who were eligible, and termination of benefits of other participants who were not eligible. Curtailment gains related to these events totaled $7.9 million and were fully recognized in net periodic benefit cost in 2014.
The following table summarizes the annual expense recognized related to the retirement plans for 2014, 2013 and 2012:
|
| | | | | | | | | | | |
| (In Millions) |
| 2014 | | 2013 | | 2012 |
Defined benefit pension plans | $ | 31.3 |
| | $ | 52.1 |
| | $ | 55.2 |
|
Defined contribution pension plans | 6.3 |
| | 6.8 |
| | 6.7 |
|
Other postretirement benefits | (0.7 | ) | | 17.4 |
| | 28.1 |
|
Total | $ | 36.9 |
| | $ | 76.3 |
| | $ | 90.0 |
|
The following tables and information provide additional disclosures for our consolidated plans.
Obligations and Funded Status
The following tables and information provide additional disclosures for the December 31, 2014 and 2013:
|
| | | | | | | | | | | | | | | |
| (In Millions) |
| Pension Benefits | | Other Benefits |
Change in benefit obligations: | 2014 | | 2013 | | 2014 | | 2013 |
Benefit obligations — beginning of year | $ | 1,118.0 |
| | $ | 1,244.3 |
| | $ | 356.2 |
| | $ | 459.8 |
|
Service cost (excluding expenses) | 30.8 |
| | 38.9 |
| | 6.7 |
| | 12.3 |
|
Interest cost | 49.7 |
| | 45.9 |
| | 16.2 |
| | 17.3 |
|
Plan amendments | — |
| | 0.8 |
| | (0.9 | ) | | — |
|
Actuarial (gain) loss | 141.6 |
| | (121.8 | ) | | 51.9 |
| | (103.3 | ) |
Benefits paid | (87.0 | ) | | (72.9 | ) | | (27.4 | ) | | (28.0 | ) |
Participant contributions | — |
| | — |
| | 4.8 |
| | 5.6 |
|
Federal subsidy on benefits paid | — |
| | — |
| | 0.9 |
| | 0.5 |
|
Exchange rate gain | (18.2 | ) | | (17.2 | ) | | (3.7 | ) | | (8.0 | ) |
Curtailment gain | (10.9 | ) | | — |
| | (8.8 | ) | | — |
|
Special termination benefits | 3.4 |
| | — |
| | — |
| | — |
|
Benefit obligations — end of year | $ | 1,227.4 |
| | $ | 1,118.0 |
| | $ | 395.9 |
| | $ | 356.2 |
|
| | | | | | | |
Change in plan assets: | | | | | | | |
Fair value of plan assets — beginning of year | $ | 915.3 |
| | $ | 838.7 |
| | $ | 251.8 |
| | $ | 237.0 |
|
Actual return on plan assets | 78.7 |
| | 109.5 |
| | 31.9 |
| | 11.0 |
|
Participant contributions | — |
| | — |
| | 0.8 |
| | 1.8 |
|
Employer contributions | 60.5 |
| | 53.7 |
| | 6.9 |
| | 20.7 |
|
Benefits paid | (87.0 | ) | | (72.9 | ) | | (22.1 | ) | | (18.7 | ) |
Exchange rate loss | (17.9 | ) | | (13.7 | ) | | — |
| | — |
|
Fair value of plan assets — end of year | $ | 949.6 |
| | $ | 915.3 |
| | $ | 269.3 |
| | $ | 251.8 |
|
| | | | | | | |
Funded status at December 31: | | | | | | | |
Fair value of plan assets | $ | 949.6 |
| | $ | 915.3 |
| | $ | 269.3 |
| | $ | 251.8 |
|
Benefit obligations | (1,227.4 | ) | | (1,118.0 | ) | | (395.9 | ) | | (356.2 | ) |
Funded status (plan assets less benefit obligations) | $ | (277.8 | ) | | $ | (202.7 | ) | | $ | (126.6 | ) | | $ | (104.4 | ) |
Amount recognized at December 31 | $ | (277.8 | ) | | $ | (202.7 | ) | | $ | (126.6 | ) | | $ | (104.4 | ) |
| | | | | | | |
Amounts recognized in Statements of Financial Position: | | | | | | | |
Current liabilities | $ | (2.4 | ) | | $ | (5.2 | ) | | $ | (6.8 | ) | | $ | (7.9 | ) |
Noncurrent liabilities | (275.4 | ) | | (197.5 | ) | | (119.8 | ) | | (96.5 | ) |
Net amount recognized | $ | (277.8 | ) | | $ | (202.7 | ) | | $ | (126.6 | ) | | $ | (104.4 | ) |
| | | | | | | |
Amounts recognized in accumulated other comprehensive income: | | | | | | | |
Net actuarial loss | $ | 341.5 |
| | $ | 230.6 |
| | $ | 97.1 |
| | $ | 67.0 |
|
Prior service cost | 10.6 |
| | 14.9 |
| | (42.9 | ) | | (45.4 | ) |
Net amount recognized | $ | 352.1 |
| | $ | 245.5 |
| | $ | 54.2 |
| | $ | 21.6 |
|
| | | | | | | |
The estimated amounts that will be amortized from accumulated other comprehensive income into net periodic benefit cost in 2015: | | | | | | | |
Net actuarial loss | $ | 22.3 |
| | | | $ | 6.3 |
| | |
Prior service cost | 2.4 |
| | | | (3.7 | ) | | |
Net amount recognized | $ | 24.7 |
| | | | $ | 2.6 |
| | |
|
| | | | | | | | | | | | | | | | | | | | | | | | | | | | | | | |
| (In Millions) |
| 2014 |
| Pension Plans | | Other Benefits |
| Salaried | | Hourly | | Mining | | SERP | | Total | | Salaried | | Hourly | | Total |
Fair value of plan assets | $ | 366.4 |
| | $ | 576.6 |
| | $ | 6.6 |
| | $ | — |
| | $ | 949.6 |
| | $ | — |
| | $ | 269.3 |
| | $ | 269.3 |
|
Benefit obligation | (471.4 | ) | | (739.2 | ) | | (9.2 | ) | | (7.6 | ) | | (1,227.4 | ) | | (54.0 | ) | | (341.9 | ) | | (395.9 | ) |
Funded status | $ | (105.0 | ) | | $ | (162.6 | ) | | $ | (2.6 | ) | | $ | (7.6 | ) | | $ | (277.8 | ) | | $ | (54.0 | ) | | $ | (72.6 | ) | | $ | (126.6 | ) |
| | | | | | | | | | | | | | | |
| 2013 |
| Pension Plans | | Other Benefits |
| Salaried | | Hourly | | Mining | | SERP | | Total | | Salaried | | Hourly | | Total |
Fair value of plan assets | $ | 357.4 |
| | $ | 552.7 |
| | $ | 5.2 |
| | $ | — |
| | $ | 915.3 |
| | $ | — |
| | $ | 251.8 |
| | $ | 251.8 |
|
Benefit obligation | (427.2 | ) | | (674.8 | ) | | (6.8 | ) | | (9.2 | ) | | (1,118.0 | ) | | (53.6 | ) | | (302.6 | ) | | (356.2 | ) |
Funded status | $ | (69.8 | ) | | $ | (122.1 | ) | | $ | (1.6 | ) | | $ | (9.2 | ) | | $ | (202.7 | ) | | $ | (53.6 | ) | | $ | (50.8 | ) | | $ | (104.4 | ) |
The accumulated benefit obligation for all defined benefit pension plans was $1,204.4 million and $1,091.4 million at December 31, 2014 and 2013, respectively. The increase in the accumulated benefit obligation primarily is a result of a decrease in the discount rates and adoption of the updated RP-2014 mortality tables.
Components of Net Periodic Benefit Cost
|
| | | | | | | | | | | | | | | | | | | | | | | |
| (In Millions) |
| Pension Benefits | | Other Benefits |
| 2014 | | 2013 | | 2012 | | 2014 | | 2013 | | 2012 |
Service cost | $ | 30.8 |
| | $ | 38.9 |
| | $ | 32.0 |
| | $ | 6.7 |
| | $ | 12.3 |
| | $ | 14.7 |
|
Interest cost | 49.7 |
| | 45.9 |
| | 48.4 |
| | 16.2 |
| | 17.3 |
| | 20.6 |
|
Expected return on plan assets | (72.3 | ) | | (65.6 | ) | | (59.5 | ) | | (17.1 | ) | | (20.1 | ) | | (17.7 | ) |
Amortization: |
| |
| |
| |
| |
| |
|
Net asset | — |
| | — |
| | — |
| | — |
| | — |
| | (3.0 | ) |
Prior service costs (credits) | 2.7 |
| | 3.0 |
| | 3.9 |
| | (3.6 | ) | | (3.6 | ) | | 1.9 |
|
Net actuarial loss | 14.1 |
| | 29.9 |
| | 30.4 |
| | 5.0 |
| | 11.5 |
| | 11.6 |
|
Curtailments and settlements | 2.9 |
| | — |
| | — |
| | (7.9 | ) | | — |
| | — |
|
Special termination benefits | 3.4 |
| | — |
| | — |
| | — |
| | — |
| | — |
|
Net periodic benefit cost | $ | 31.3 |
| | $ | 52.1 |
| | $ | 55.2 |
| | $ | (0.7 | ) | | $ | 17.4 |
| | $ | 28.1 |
|
Curtailment effects | — |
| | — |
| | — |
| | (0.8 | ) | | — |
| | — |
|
Current year actuarial (gain)/loss | 121.8 |
| | (168.8 | ) | | 53.1 |
| | 36.9 |
| | (95.2 | ) | | 3.2 |
|
Amortization of net loss | (15.5 | ) | | (29.9 | ) | | (30.4 | ) | | (5.0 | ) | | (11.5 | ) | | (11.6 | ) |
Current year prior service (credit) cost | (1.5 | ) | | 0.8 |
| | 2.8 |
| | (0.9 | ) | | — |
| | (58.3 | ) |
Amortization of prior service (cost) credit | (2.7 | ) | | (3.0 | ) | | (3.9 | ) | | 3.6 |
| | 3.6 |
| | (1.9 | ) |
Amortization of transition asset | — |
| | — |
| | — |
| | — |
| | — |
| | 3.0 |
|
Total recognized in other comprehensive income | $ | 102.1 |
| | $ | (200.9 | ) | | $ | 21.6 |
| | $ | 33.8 |
| | $ | (103.1 | ) | | $ | (65.6 | ) |
Total recognized in net periodic cost and other comprehensive income | $ | 133.4 |
| | $ | (148.8 | ) | | $ | 76.8 |
| | $ | 33.1 |
| | $ | (85.7 | ) | | $ | (37.5 | ) |
Additional Information
|
| | | | | | | | | | | | | | | | | | | | | | | |
| (In Millions) |
| Pension Benefits | | Other Benefits |
| 2014 | | 2013 | | 2012 | | 2014 | | 2013 | | 2012 |
Effect of change in mine ownership & noncontrolling interest | $ | 51.4 |
| | $ | 46.5 |
| | $ | 54.8 |
| | $ | 5.9 |
| | $ | 4.8 |
| | $ | 8.6 |
|
Actual return on plan assets | 78.7 |
| | 109.5 |
| | 92.5 |
| | 31.9 |
| | 11.0 |
| | 26.1 |
|
Assumptions
For our U.S. pension and other postretirement benefit plans, we used a discount rate as of December 31, 2014 of 3.83 percent, compared with a discount rate of 4.57 percent as of December 31, 2013. The U.S. discount rates are determined by matching the projected cash flows used to determine the PBO and APBO to a projected yield curve of 715 Aa graded bonds in the 10th to 90th percentiles. These bonds are either noncallable or callable with make-whole provisions. The duration matching produced rates ranging from 3.72 percent to 3.92 percent for our plans. Based upon these results, we selected a December 31, 2014 discount rate of 3.83 percent for our plans. This methodology is consistent with the calculation of the prior-year discount rate.
On December 31, 2014, we adopted the RP-2014 mortality tables projected generationally using scale MP-2014 with blue collar and white collar adjustments made for certain hourly and salaried groups, to determine the expected life of our plan participants, replacing the IRS 2014 prescribed mortality tables for our U.S. plans. The adoption of the new tables resulted in increases to our U.S. plan projected benefit obligations totaling approximately $30.0 million or 4 percent percent for the pension plans and $20 million or 7 percent for the OPEB plans.
For our Canadian plans, we used a discount rate as of December 31, 2014 of 3.75 percent for the pension plans and the other postretirement benefit plans. Similar to the U.S. plans, the Canadian discount rates are determined by matching the projected cash flows used to determine the PBO and APBO to a projected yield curve of 285 corporate bonds in the 10th to 90th percentiles. The corporate bonds are either Aa graded, or (for maturities of 10 or more years) A or Aaa graded with an appropriate credit spread adjustment. These bonds are either noncallable or callable with make whole provisions. This methodology is consistent with the calculation of the prior-year discount rate.
On December 31, 2014, we adopted the 2014 Private Sector Canadian Pensioners’ Mortality Table for the hourly plans and the 2014 Canadian Pensioners’ Mortality Table for the salaried plans, where both tables were projected generationally using scale CPM-B, replacing the UP 1994 table with full projection. The adoption of the new tables resulted in increases to our Canadian plan projected benefit obligations totaling approximately $12 million or 5 percent for the pension plans and $3 million or 5 percent for the OPEB plans.
Weighted-average assumptions used to determine benefit obligations at December 31 were:
|
| | | | | | | |
| Pension Benefits | | Other Benefits |
| 2014 | | 2013 | | 2014 | | 2013 |
U.S. plan discount rate | 3.83% | | 4.57% | | 3.83% | | 4.57% |
Canadian plan discount rate | 3.75 | | 4.50 | | 3.75 | | 4.75 |
U.S. salaried rate of compensation increase | 3.00 | | 4.00 | | 3.00 | | 4.00 |
Canadian rate of compensation increase | 3.00 | | 4.00 | | N/A | | N/A |
Hourly rate of compensation increase (ultimate) | 2.50 | | 3.00 | | N/A | | N/A |
U.S. expected return on plan assets | 8.25 | | 8.25 | | 7.00 | | 7.00 |
Canadian expected return on plan assets | 7.25 | | 7.25 | | N/A | | N/A |
Weighted-average assumptions used to determine net benefit cost for the years 2014, 2013 and 2012 were:
|
| | | | | | | | | | | | |
| Pension Benefits | | Other Benefits | |
| 2014 | | 2013 | | 2012 | | 2014 | | 2013 | | 2012 | |
U.S. plan discount rate | 4.57 | % | 3.70 | % | 4.28 | % | 4.57 | % | 3.70 | % | 4.28/3.51 | % 1 |
Canadian plan discount rate | 4.50 | | 3.75 | | 4.00 | | 4.75 | | 4.00 | | 4.25 | |
U.S. expected return on plan assets | 8.25 | | 8.25 | | 8.25 | | 7.00 | | 8.25 | | 8.25 | |
Canadian expected return on plan assets | 7.25 | | 7.25 | | 7.25 | | N/A | | N/A | | N/A | |
U.S. salaried rate of compensation increase | 4.00 | | 4.00 | | 4.00 | | 4.00 | | 4.00 | | 4.00 | |
U.S. hourly rate of compensation increase | 3.00 | | 4.00 | | 4.00 | | 4.00 | | 4.00 | | 4.00 | |
Canadian rate of compensation increase | 4.00 | | 4.00 | | 4.00 | | 4.00 | | 4.00 | | 4.00 | |
| |
1 | 4.28 percent for the Salaried Plan. For the Hourly Plan, 4.28 percent from January 1, 2012 through October 31, 2012, and 3.51 percent from November 1, 2012 through December 31, 2012. |
Assumed health care cost trend rates at December 31 were:
|
| | | | |
| 2014 | | 2013 | |
U.S. plan health care cost trend rate assumed for next year | 7.00 | % | 7.25 | % |
Canadian plan health care cost trend rate assumed for next year | 4.25 | | 4.00 | |
Ultimate health care cost trend rate | 5.00 | | 5.00 | |
U.S. plan year that the ultimate rate is reached | 2023 | | 2023 | |
Canadian plan year that the ultimate rate is reached | 2018 | | 2018 | |
Assumed health care cost trend rates have a significant effect on the amounts reported for the health care plans. A change of one percentage point in assumed health care cost trend rates would have the following effects:
|
| | | | | | | |
| (In Millions) |
| Increase | | Decrease |
Effect on total of service and interest cost | $ | 3.4 |
| | $ | (2.7 | ) |
Effect on postretirement benefit obligation | 49.6 |
| | (39.9 | ) |
Plan Assets
Our financial objectives with respect to our pension and VEBA plan assets are to fully fund the actuarial accrued liability for each of the plans, to maximize investment returns within reasonable and prudent levels of risk, and to maintain sufficient liquidity to meet benefit obligations on a timely basis.
Our investment objective is to outperform the expected ROA assumption used in the plans’ actuarial reports over a full market cycle, which is considered a period during which the U.S. economy experiences the effects of both an upturn and a downturn in the level of economic activity. In general, these periods tend to last between three and five years. The expected ROA takes into account historical returns and estimated future long-term returns based on capital market assumptions applied to the asset allocation strategy. The expected return is net of investment expenses paid by the plans.
The asset allocation strategy is determined through a detailed analysis of assets and liabilities by plan, which defines the overall risk that is acceptable with regard to the expected level and variability of portfolio returns, surplus (assets compared to liabilities), contributions and pension expense.
The asset allocation review process involves simulating the effect of financial market performance for various asset allocation scenarios and factoring in the current funded status and likely future funded status levels by taking into account expected growth or decline in the contributions over time. The modeling is then adjusted by simulating unexpected changes in inflation and interest rates. The process also includes quantifying the effect of investment performance and
simulated changes to future levels of contributions, determining the appropriate asset mix with the highest likelihood of meeting financial objectives and regularly reviewing our asset allocation strategy.
The asset allocation strategy varies by plan. The following table reflects the actual asset allocations for pension and VEBA plan assets as of December 31, 2014 and 2013, as well as the 2015 weighted average target asset allocations as of December 31, 2014. Equity investments include securities in large-cap, mid-cap and small-cap companies located in the U.S. and worldwide. Fixed income investments primarily include corporate bonds and government debt securities. Alternative investments include hedge funds, private equity, structured credit and real estate.
|
| | | | | | | | | | | | | | | | | |
| Pension Assets | | VEBA Assets |
Asset Category | 2015 Target Allocation | | Percentage of Plan Assets at December 31, | | 2015 Target Allocation | | Percentage of Plan Assets at December 31, |
2014 | | 2013 | | 2014 | | 2013 |
Equity securities | 48.2 | % | | 48.6 | % | | 51.5 | % | | 8.0 | % | | 8.6 | % | | 10.4 | % |
Fixed income | 28.4 | % | | 29.0 | % | | 26.7 | % | | 80.1 | % | | 79.3 | % | | 66.6 | % |
Hedge funds | 6.1 | % | | 6.2 | % | | 6.3 | % | | 4.2 | % | | 4.3 | % | | 9.8 | % |
Private equity | 5.5 | % | | 3.3 | % | | 3.2 | % | | 2.6 | % | | 2.3 | % | | 2.4 | % |
Structured credit | 5.9 | % | | 6.9 | % | | 6.7 | % | | 2.1 | % | | 2.3 | % | | 5.4 | % |
Real estate | 5.9 | % | | 5.3 | % | | 4.5 | % | | 3.0 | % | | 3.2 | % | | 5.3 | % |
Cash | — | % | | 0.7 | % | | 1.1 | % | | — | % | | — | % | | 0.1 | % |
Total | 100.0 | % | | 100.0 | % | | 100.0 | % | | 100.0 | % | | 100.0 | % | | 100.0 | % |
Pension
The fair values of our pension plan assets at December 31, 2014 and 2013 by asset category are as follows:
|
| | | | | | | | | | | | | | | |
| (In Millions) |
| December 31, 2014 |
Asset Category | Quoted Prices in Active Markets for Identical Assets/Liabilities (Level 1) | | Significant Other Observable Inputs (Level 2) | | Significant Unobservable Inputs (Level 3) | | Total |
Equity securities: | | | | | | | |
U.S. large-cap | $ | 248.5 |
| | $ | — |
| | $ | — |
| | $ | 248.5 |
|
U.S. small/mid-cap | 55.8 |
| | — |
| | — |
| | 55.8 |
|
International | 157.4 |
| | — |
| | — |
| | 157.4 |
|
Fixed income | 243.7 |
| | 31.8 |
| | — |
| | 275.5 |
|
Hedge funds | — |
| | — |
| | 59.2 |
| | 59.2 |
|
Private equity | — |
| | — |
| | 31.2 |
| | 31.2 |
|
Structured credit | — |
| | — |
| | 65.4 |
| | 65.4 |
|
Real estate | — |
| | — |
| | 50.0 |
| | 50.0 |
|
Cash | 6.6 |
| | — |
| | — |
| | 6.6 |
|
Total | $ | 712.0 |
| | $ | 31.8 |
| | $ | 205.8 |
| | $ | 949.6 |
|
|
| | | | | | | | | | | | | | | |
| (In Millions) |
| December 31, 2013 |
Asset Category | Quoted Prices in Active Markets for Identical Assets/Liabilities (Level 1) | | Significant Other Observable Inputs (Level 2) | | Significant Unobservable Inputs (Level 3) | | Total |
Equity securities: | | | | | | | |
U.S. large-cap | $ | 261.5 |
| | $ | — |
| | $ | — |
| | $ | 261.5 |
|
U.S. small/mid-cap | 60.8 |
| | — |
| | — |
| | 60.8 |
|
International | 149.3 |
| | — |
| | — |
| | 149.3 |
|
Fixed income | 214.8 |
| | 30.1 |
| | — |
| | 244.9 |
|
Hedge funds | — |
| | — |
| | 57.6 |
| | 57.6 |
|
Private equity | — |
| | — |
| | 29.1 |
| | 29.1 |
|
Structured credit | — |
| | — |
| | 61.0 |
| | 61.0 |
|
Real estate | — |
| | — |
| | 40.9 |
| | 40.9 |
|
Cash | 10.2 |
| | — |
| | — |
| | 10.2 |
|
Total | $ | 696.6 |
| | $ | 30.1 |
| | $ | 188.6 |
| | $ | 915.3 |
|
Following is a description of the inputs and valuation methodologies used to measure the fair value of our plan assets.
Equity Securities
Equity securities classified as Level 1 investments include U.S. large-, small- and mid-cap investments and international equity. These investments are comprised of securities listed on an exchange, market or automated quotation system for which quotations are readily available. The valuation of these securities is determined using a market approach, and is based upon unadjusted quoted prices for identical assets in active markets.
Fixed Income
Fixed income securities classified as Level 1 investments include bonds and government debt securities. These investments are comprised of securities listed on an exchange, market or automated quotation system for which quotations are readily available. The valuation of these securities is determined using a market approach, and is based upon unadjusted quoted prices for identical assets in active markets. Also included in Fixed Income is a portfolio of U.S. Treasury STRIPS, which are zero-coupon bearing fixed income securities backed by the full faith and credit of the U.S. government. The securities sell at a discount to par because there are no incremental coupon payments. STRIPS are not issued directly by the Treasury, but rather are created by a financial institution, government securities broker or government securities dealer. Liquidity on the issue varies depending on various market conditions; however, in general the STRIPS market is slightly less liquid than that of the U.S. Treasury Bond market. The STRIPS are priced daily through a bond pricing vendor and are classified as Level 2.
Hedge Funds
Hedge funds are alternative investments comprised of direct or indirect investment in offshore hedge funds of funds with an investment objective to achieve an attractive risk-adjusted return with moderate volatility and moderate directional market exposure over a full market cycle. The valuation techniques used to measure fair value attempt to maximize the use of observable inputs and minimize the use of unobservable inputs. Considerable judgment is required to interpret the factors used to develop estimates of fair value. Valuations of the underlying investment funds are obtained and reviewed. The securities that are valued by the funds are interests in the investment funds and not the underlying holdings of such investment funds. Thus, the inputs used to value the investments in each of the underlying funds may differ from the inputs used to value the underlying holdings of such funds.
In determining the fair value of a security, the fund managers may consider any information that is deemed relevant, which may include one or more of the following factors regarding the portfolio security, if appropriate: type of security or asset; cost at the date of purchase; size of holding; last trade price; most recent valuation; fundamental analytical data relating to the investment in the security; nature and duration of any restriction on the disposition of the security; evaluation of the factors that influence the market in which the security is purchased or sold; financial statements of the issuer; discount from market value of unrestricted securities of the same class at the time of purchase; special reports prepared by analysts; information as to any transactions or offers with respect to the security; existence of merger proposals or tender offers affecting the security; price and extent of public trading in similar securities of the issuer or
compatible companies and other relevant matters; changes in interest rates; observations from financial institutions; domestic or foreign government actions or pronouncements; other recent events; existence of shelf registration for restricted securities; existence of any undertaking to register the security; and other acceptable methods of valuing portfolio securities.
Hedge fund investments in the SEI Special Situations Fund are valued quarterly and recorded on a one-month lag. For alternative investment values reported on a lag, current market information is reviewed for any material changes in values at the reporting date. Share repurchases for the SEI Special Situations Fund are considered semi-annually subject to notice of 95 days.
Private Equity Funds
Private equity funds are alternative investments that represent direct or indirect investments in partnerships, venture funds or a diversified pool of private investment vehicles (fund of funds).
Investment commitments are made in private equity funds of funds based on an asset allocation strategy, and capital calls are made over the life of the funds to fund the commitments. As of December 31, 2014, remaining commitments total $55.5 million for both our pension and other benefits. Of this amount, an additional $45.0 million commitment was executed during the third quarter of 2014 in order to bring the portfolio in line with the target allocation for this asset category. Committed amounts are funded from plan assets when capital calls are made. Investment commitments are not pre-funded in reserve accounts. Refer to the valuation methodologies for equity securities above for further information.
The valuation of investments in private equity funds of funds initially is performed by the underlying fund managers. In determining the fair value, the fund managers may consider any information that is deemed relevant, which may include: type of security or asset; cost at the date of purchase; size of holding; last trade price; most recent valuation; fundamental analytical data relating to the investment in the security; nature and duration of any restriction on the disposition of the security; evaluation of the factors that influence the market in which the security is purchased or sold; financial statements of the issuer; discount from market value of unrestricted securities of the same class at the time of purchase; special reports prepared by analysts; information as to any transactions or offers with respect to the security; existence of merger proposals or tender offers affecting the security; price and extent of public trading in similar securities of the issuer or compatible companies and other relevant matters; changes in interest rates; observations from financial institutions; domestic or foreign government actions or pronouncements; other recent events; existence of shelf registration for restricted securities; existence of any undertaking to register the security; and other acceptable methods of valuing portfolio securities.
The valuations are obtained from the underlying fund managers, and the valuation methodology and process is reviewed for consistent application and adherence to policies. Considerable judgment is required to interpret the factors used to develop estimates of fair value.
Private equity investments are valued quarterly and recorded on a one-quarter lag. For alternative investment values reported on a lag, current market information is reviewed for any material changes in values at the reporting date. Capital distributions for the funds do not occur on a regular frequency. Liquidation of these investments would require sale of the partnership interest.
Structured Credit
Structured credit investments are alternative investments comprised of collateralized debt obligations and other structured credit investments that are priced based on valuations provided by independent, third-party pricing agents, if available. Such values generally reflect the last reported sales price if the security is actively traded. The third-party pricing agents may also value structured credit investments at an evaluated bid price by employing methodologies that utilize actual market transactions, broker-supplied valuations, or other methodologies designed to identify the market value of such securities. Such methodologies generally consider such factors as security prices, yields, maturities, call features, ratings and developments relating to specific securities in arriving at valuations. Securities listed on a securities exchange, market or automated quotation system for which quotations are readily available are valued at the last quoted sale price on the primary exchange or market on which they are traded. Debt obligations with remaining maturities of 60 days or less may be valued at amortized cost, which approximates fair value.
Structured credit investments are valued monthly and recorded on a one-month lag. For alternative investment values reported on a lag, current market information is reviewed for any material changes in values at the reporting date. Redemption requests are considered quarterly subject to notice of 90 days.
Real Estate
The real estate portfolio for the pension plans is an alternative investment comprised of three funds with strategic categories of real estate investments. All real estate holdings are appraised externally at least annually, and appraisals are conducted by reputable, independent appraisal firms that are members of the Appraisal Institute. All external appraisals are performed in accordance with the Uniform Standards of Professional Appraisal Practices. The property valuations and assumptions of each property are reviewed quarterly by the investment advisor and values are adjusted if there has been a significant change in circumstances relating to the property since the last external appraisal. The valuation methodology utilized in determining the fair value is consistent with the best practices prevailing within the real estate appraisal and real estate investment management industries, including the Real Estate Information Standards, and standards promulgated by the National Council of Real Estate Investment Fiduciaries, the National Association of Real Estate Investment Fiduciaries, and the National Association of Real Estate Managers. In addition, the investment advisor may cause additional appraisals to be performed. Two of the funds’ fair values are updated monthly, and there is no lag in reported values. Redemption requests for these two funds are considered on a quarterly basis, subject to notice of 45 days.
Effective October 1, 2009, one of the real estate funds began an orderly wind-down. The decision to wind down the fund primarily was driven by real estate market factors that adversely affected the availability of new investor capital. Third-party appraisals of this fund’s assets were eliminated; however, internal valuation updates for all assets and liabilities of the fund are prepared quarterly. The fund’s asset values are recorded on a one-quarter lag, and current market information is reviewed for any material changes in values at the reporting date. As of December 31, 2014, the fund was largely unwound with no further material distributions expected.
During 2011, a new real estate fund of funds investment was added for the Empire, Tilden, Hibbing and United Taconite VEBA plans as a result of the asset allocation review process. This fund invests in pooled investment vehicles that in turn invest in commercial real estate properties. Valuations are performed quarterly and financial statements are prepared on a semi-annual basis, with annual audited statements. Asset values for this fund are reported with a one-quarter lag and current market information is reviewed for any material changes in values at the reporting date. In most cases, values are based on valuations reported by underlying fund managers or other independent third-party sources, but the fund has discretion to use other valuation methods, subject to compliance with ERISA. Valuations are typically estimates only and subject to upward or downward revision based on each underlying fund’s annual audit. Withdrawals are permitted on the last business day of each quarter subject to a 65-day prior written notice.
The following represents the effect of fair value measurements using significant unobservable inputs (Level 3) on changes in plan assets for the years ended December 31, 2014 and 2013:
|
| | | | | | | | | | | | | | | | | | | |
| (In Millions) |
| Year Ended December 31, 2014 |
| Hedge Funds | | Private Equity Funds | | Structured Credit Fund | | Real Estate | | Total |
Beginning balance — January 1, 2014 | $ | 57.6 |
| | $ | 29.1 |
| | $ | 61.0 |
| | $ | 40.9 |
| | $ | 188.6 |
|
Actual return on plan assets: |
| |
| |
| |
| | |
Relating to assets still held at the reporting date | 3.1 |
| | 3.2 |
| | 4.4 |
| | 5.2 |
| | 15.9 |
|
Relating to assets sold during the period | (1.5 | ) | | 3.0 |
| | — |
| | — |
| | 1.5 |
|
Purchases | — |
| | 1.4 |
| | — |
| | 5.4 |
| | 6.8 |
|
Sales | — |
| | (5.5 | ) | | — |
| | (1.5 | ) | | (7.0 | ) |
Ending balance — December 31, 2014 | $ | 59.2 |
| | $ | 31.2 |
| | $ | 65.4 |
| | $ | 50.0 |
| | $ | 205.8 |
|
|
| | | | | | | | | | | | | | | | | | | |
| (In Millions) |
| Year Ended December 31, 2013 |
| Hedge Funds | | Private Equity Funds | | Structured Credit Fund | | Real Estate | | Total |
Beginning balance — January 1, 2013 | $ | 85.6 |
| | $ | 29.3 |
| | $ | 56.2 |
| | $ | 29.4 |
| | $ | 200.5 |
|
Actual return on plan assets: |
| |
| |
| |
| | |
Relating to assets still held at the reporting date | 4.5 |
| | (2.1 | ) | | 33.5 |
| | 5.1 |
| | 41.0 |
|
Relating to assets sold during the period | (1.2 | ) | | 5.2 |
| | (28.7 | ) | | (0.4 | ) | | (25.1 | ) |
Purchases | 66.0 |
| | 14.7 |
| | 27.5 |
| | 36.8 |
| | 145.0 |
|
Sales | (97.3 | ) | | (18.0 | ) | | (27.5 | ) | | (30.0 | ) | | (172.8 | ) |
Ending balance — December 31, 2013 | $ | 57.6 |
| | $ | 29.1 |
| | $ | 61.0 |
| | $ | 40.9 |
| | $ | 188.6 |
|
VEBA
Assets for other benefits include VEBA trusts pursuant to bargaining agreements that are available to fund retired employees’ life insurance obligations and medical benefits. The fair values of our other benefit plan assets at December 31, 2014 and 2013 by asset category are as follows:
|
| | | | | | | | | | | | | | | |
| (In Millions) |
| December 31, 2014 |
Asset Category | Quoted Prices in Active Markets for Identical Assets/Liabilities (Level 1) | | Significant Other Observable Inputs (Level 2) | | Significant Unobservable Inputs (Level 3) | | Total |
Equity securities: | | | | | | | |
U.S. large-cap | $ | 11.6 |
| | $ | — |
| | $ | — |
| | $ | 11.6 |
|
U.S. small/mid-cap | 2.9 |
| | — |
| | — |
| | 2.9 |
|
International | 8.6 |
| | — |
| | — |
| | 8.6 |
|
Fixed income | 174.5 |
| | 39.1 |
| | — |
| | 213.6 |
|
Hedge funds | — |
| | — |
| | 11.5 |
| | 11.5 |
|
Private equity | — |
| | — |
| | 6.2 |
| | 6.2 |
|
Structured credit | — |
| | — |
| | 6.1 |
| | 6.1 |
|
Real estate | — |
| | — |
| | 8.7 |
| | 8.7 |
|
Cash | 0.1 |
| | — |
| | — |
| | 0.1 |
|
Total | $ | 197.7 |
| | $ | 39.1 |
| | $ | 32.5 |
| | $ | 269.3 |
|
|
| | | | | | | | | | | | | | | |
| (In Millions) |
| December 31, 2013 |
Asset Category | Quoted Prices in Active
Markets for Identical
Assets/Liabilities
(Level 1) | | Significant Other
Observable
Inputs
(Level 2) | | Significant
Unobservable
Inputs
(Level 3) | | Total |
Equity securities: |
| |
| |
| |
|
U.S. large-cap | $ | 15.7 |
| | $ | — |
| | $ | — |
| | $ | 15.7 |
|
U.S. small/mid-cap | 2.7 |
| | — |
| | — |
| | 2.7 |
|
International | 7.8 |
| | — |
| | — |
| | 7.8 |
|
Fixed income | 134.4 |
| | 33.7 |
| | — |
| | 168.1 |
|
Hedge funds | — |
| | — |
| | 24.6 |
| | 24.6 |
|
Private equity | — |
| | — |
| | 6.0 |
| | 6.0 |
|
Structured credit | — |
| | — |
| | 13.5 |
| | 13.5 |
|
Real estate | — |
| | — |
| | 13.2 |
| | 13.2 |
|
Cash | 0.2 |
| | — |
| | — |
| | 0.2 |
|
Total | $ | 160.8 |
| | $ | 33.7 |
| | $ | 57.3 |
| | $ | 251.8 |
|
Refer to the pension asset discussion above for further information regarding the inputs and valuation methodologies used to measure the fair value of each respective category of plan assets.
The following represents the effect of fair value measurements using significant unobservable inputs (Level 3) on changes in plan assets for the year ended December 31, 2014 and 2013:
|
| | | | | | | | | | | | | | | | | | | |
| (In Millions) |
| Year Ended December 31, 2014 |
| Hedge Funds | | Private Equity Funds | | Structured Credit Fund | | Real Estate | | Total |
Beginning balance — January 1, 2014 | $ | 24.6 |
| | $ | 6.0 |
| | $ | 13.5 |
| | $ | 13.2 |
| | $ | 57.3 |
|
Actual return on plan assets: |
| |
| |
| |
| | |
Relating to assets still held at the reporting date | 0.5 |
| | 1.0 |
| | 0.4 |
| | 0.9 |
| | 2.8 |
|
Relating to assets sold during the period | 0.6 |
| | 0.4 |
| | 0.4 |
| | 0.5 |
| | 1.9 |
|
Purchases | — |
| | 0.1 |
| | — |
| | — |
| | 0.1 |
|
Sales | (14.2 | ) | | (1.3 | ) | | (8.2 | ) | | (5.9 | ) | | (29.6 | ) |
Ending balance — December 31, 2014 | $ | 11.5 |
| | $ | 6.2 |
| | $ | 6.1 |
| | $ | 8.7 |
| | $ | 32.5 |
|
|
| | | | | | | | | | | | | | | | | | | |
| (In Millions) |
| Year Ended December 31, 2013 |
| Hedge Funds | | Private Equity Funds | | Structured Credit Fund | | Real Estate | | Total |
Beginning balance — January 1, 2014 | $ | 23.2 |
| | $ | 6.2 |
| | $ | 12.5 |
| | $ | 15.9 |
| | $ | 57.8 |
|
Actual return on plan assets: |
| |
| |
| |
| | |
Relating to assets still held at the reporting date | 2.1 |
| | 0.2 |
| | 2.4 |
| | 2.8 |
| | 7.5 |
|
Relating to assets sold during the period | (0.7 | ) | | 0.4 |
| | (1.4 | ) | | (0.7 | ) | | (2.4 | ) |
Purchases | 22.5 |
| | 0.3 |
| | 11.0 |
| | 14.2 |
| | 48.0 |
|
Sales | (22.5 | ) | | (1.1 | ) | | (11 | ) | | (19.0 | ) | | (53.6 | ) |
Ending balance — December 31, 2014 | $ | 24.6 |
| | $ | 6.0 |
| | $ | 13.5 |
| | $ | 13.2 |
| | $ | 57.3 |
|
Contributions
Annual contributions to the pension plans are made within income tax deductibility restrictions in accordance with statutory regulations. In the event of plan termination, the plan sponsors could be required to fund additional shutdown and early retirement obligations that are not included in the pension obligations. The Company currently has no intention to shutdown, terminate or withdraw from any of its employee benefit plans.
|
| | | | | | | | | | | | | | | | |
| | (In Millions) |
| | Pension Benefits | | Other Benefits |
Company Contributions | | VEBA | | Direct Payments | | Total |
2013 | | $ | 53.7 |
| | $ | 14.6 |
| | $ | 10.9 |
| | $ | 25.5 |
|
2014 | | 60.5 |
| | — |
| | 7.3 |
| | 7.3 |
|
2015 (Expected)* | | 36.8 |
| | — |
| | 6.8 |
| | 6.8 |
|
| |
* | Pursuant to the bargaining agreement, benefits can be paid from VEBA trusts that are at least 70 percent funded (all VEBA trusts are over 70 percent funded at December 31, 2014). Funding obligations have been suspended as Hibbing's, UTAC's, Tilden's and Empire's share of the value of their respective trust assets have reached 90 percent of their obligation. |
VEBA plans are not subject to minimum regulatory funding requirements. Amounts contributed are pursuant to bargaining agreements.
Contributions by participants to the other benefit plans were $4.8 million for the year ended December 31, 2014 and $5.6 million for the year ended December 31, 2013.
Estimated Cost for 2015
For 2015, we estimate net periodic benefit cost as follows:
|
| | | |
| (In Millions) |
Defined benefit pension plans | $ | 23.6 |
|
Other postretirement benefits | 6.0 |
|
Total | $ | 29.6 |
|
Estimated Future Benefit Payments
|
| | | | | | | | | | | | | | | |
| (In Millions) |
| Pension Benefits | | Other Benefits |
Gross Company Benefits | | Less Medicare Subsidy | | Net Company Payments |
2015 | $ | 89.3 |
| | $ | 23.1 |
| | $ | 0.9 |
| | $ | 22.2 |
|
2016 | 77.7 |
| | 23.0 |
| | 1.0 |
| | 22.0 |
|
2017 | 78.1 |
| | 23.2 |
| | 1.1 |
| | 22.1 |
|
2018 | 79.3 |
| | 23.3 |
| | 1.3 |
| | 22.0 |
|
2019 | 78.6 |
| | 22.9 |
| | 1.4 |
| | 21.5 |
|
2020-2024 | 402.4 |
| | 110.7 |
| | 8.6 |
| | 102.1 |
|
Other Potential Benefit Obligations
While the foregoing reflects our obligation, our total exposure in the event of non-performance is potentially greater. Following is a summary comparison of the total obligation:
|
| | | | | | | |
| (In Millions) |
| December 31, 2014 |
| Defined Benefit Pensions | | Other Benefits |
Fair value of plan assets | $ | 949.6 |
| | $ | 269.3 |
|
Benefit obligation | (1,227.4 | ) | | (395.9 | ) |
Underfunded status of plan | $ | (277.8 | ) | | $ | (126.6 | ) |
Additional shutdown and early retirement benefits | $ | (26.7 | ) | | $ | 40.5 |
|
NOTE 8 - STOCK COMPENSATION PLANS
At December 31, 2014, we have two share-based compensation plans, which are described below. The compensation cost that has been charged against income for those plans was $23.7 million, $21.1 million and $20.6 million in 2014, 2013 and 2012, respectively, which primarily was recorded in Selling, general and administrative expenses in the Statements of Consolidated Operations. The total income tax benefit recognized in the Statements of Consolidated Operations for share-based compensation arrangements was $8.3 million, $7.4 million and $7.2 million for 2014, 2013 and 2012, respectively.
Employees’ Plans
The 2012 Equity Plan was approved by our Board of Directors on March 13, 2012 and our shareholders approved it on May 8, 2012, effective as of March 13, 2012. The 2012 Equity Plan replaced the ICE Plan. The maximum number of shares that may be issued under the 2012 Equity Plan is 6.0 million common shares. On February 10, 2014, upon recommendation by the Compensation and Organization Committee, Cliffs’ Board of Directors approved and adopted, subject to the approval of Cliffs' shareholders at the 2014 Annual Meeting, the 2012 Amended Equity Plan. The principal reason for amending and restating the 2012 Equity Plan was to increase the number of common shares available for issuance by 5.0 million common shares. This amended plan was approved by Cliffs' shareholders at the 2014 Annual Meeting held on July 29, 2014.
The Compensation and Organization Committee of the Board of Directors approved grants under the 2012 Equity Plan and the 2012 Amended Equity Plan to certain officers and employees for the 2014 to 2016 performance period. Shares granted under the awards during 2014 consisted of 0.8 million performance shares based on TSR, 0.5 million restricted share units, 0.3 million stock options and 0.4 million performance-based restricted stock units, each of which may, or may not, convert into shares based on our shares achieving and maintaining certain milestones above an absolute threshold during the performance period.
At our July 29, 2014 Annual Meeting, the shareholders voted on the election of eleven directors. Thirteen persons were nominated for election to the eleven board positions. On August 6, 2014, the Company received the final report of the inspector of election that confirmed the election of six new directors to our Board of Directors. Such an event constituted a change in control pursuant to our incentive equity plans. As a result of such change in the majority of our directors and pursuant to the terms of the various plans and applicable award agreements, all of the outstanding and unvested equity incentives awarded to participants prior to October 2013 became vested. Accordingly, this resulted in recognizing $11.7 million of additional equity-based compensation expense in the accompanying financial statements, representing the remaining unrecognized compensation expense of the awards. For any equity grants awarded after September 2013, the vesting of all such grants will accelerate and pay out in cash only following a participant's qualifying termination of employment associated with the change in control and if the common shares are not substituted with a replacement award. This potential liability for additional double-trigger payments for share-based compensation in cash will expire entirely in two years.
For the outstanding 2012 Equity Plan and 2012 Amended Equity Plan awards that were issued subsequent to October 2013, each performance share, if earned, entitles the holder to receive common shares or cash within a range between a threshold and maximum number of our common shares, with the actual number of common shares earned dependent upon whether the Company achieves certain objectives and performance goals as established by the Compensation and Organization Committee. The performance share or unit grants vest over a period of three years and are intended to be paid out in common shares or cash in certain circumstances. Performance for the 2014 to 2016 performance periods is measured only on the basis of relative TSR for the period and measured against the constituents of the S&P Metals and Mining ETF Index on the last day of trading of the performance period. The final payouts for the 2014 to 2016 performance period will vary from zero to 200 percent of the original grant. For the outstanding performance-based restricted stock units, the award may be earned and settled based upon certain VWAP performance for the Company’s common shares, (Threshold VWAP, Target VWAP, or Maximum VWAP) for any period of ninety (90) consecutive calendar days during a performance period commencing August 7, 2014 and ending December 31, 2017 (the “Performance Period”). The stock options vest in equal thirds on each of December 31, 2015, December 31, 2016 and December 31, 2017 subject to continued employment through each vesting date, and are exercisable cumulatively at a strike price of $13.83 after each vesting date and expire on November 17, 2021. The restricted share units are subject to continued employment, are retention based, will vest at the end of the respective performance period, and are payable in common shares or cash in certain circumstances at a time determined by the Committee at its discretion.
Following is a summary of our performance share award agreements currently outstanding:
|
| | | | | | | | | | | | |
Performance
Share
Plan Year | Performance Shares Granted | | Estimated Forfeitures | | Expected to Vest | | Grant Date | | Performance Period |
2014 | 400,000 |
| | 40,911 |
| | 359,089 |
| | November 17, 2014 | | 8/7/2014 - 12/31/2017 |
2014 | 283,530 |
| | 24,380 |
| | 259,150 |
| | July 29, 2014 | | 1/1/2014 - 12/31/2016 |
2014 | 124,630 |
| | 21,098 |
| | 103,532 |
| | May 12, 2014 | | 1/1/2014 - 12/31/2016 |
2014 | 385,585 |
| | 120,299 |
| | 265,286 |
| | February 10, 2014 | | 1/1/2014 - 12/31/2016 |
Nonemployee Directors
At our 2014 annual meeting, the shareholders approved the Directors' Plan which became effective December 1, 2014. The Directors’ Plan authorizes us to issue up to 300,000 common shares from time to time to nonemployee Directors. Under the Share Ownership Guidelines in effect for 2014 ("Guidelines"), a Director is required by the end of five years from date of election to hold common shares with a market value of at least $250,000. The Directors’ Plan offers the nonemployee Director the opportunity to defer all or a portion of the awards granted.
The 2008 Directors’ Plan in effect for most of 2014 provided for an Annual Equity Grant ("Equity Grant") to be awarded at our annual meeting each year to all nonemployee Directors elected or re-elected by the shareholders and a pro-rata amount was awarded to new directors upon their appointment. The value of the Equity Grant was payable in restricted shares with a three-year vesting period from the date of grant. The closing market price of our common shares on October 16, 2014 was divided into the number of common shares remaining available for issuance under the 2008 Directors' Plan to determine the number of restricted shares awarded as the Equity Grant. In 2014, nonemployee Directors each received Equity Grants valued at $85,000 which was bifurcated into two tranches since the 2008 Director's Plan did not have a sufficient number of shares available for issuance. The first tranche of the 2014 Equity Grant was granted under the 2008 Directors' Plan on October 16, 2014 and valued at $42,500. The second tranche was granted under the Directors' Plan on December 2, 2014 and valued at $42,500.
For the last three years, Equity Grant shares have been awarded to elected or re-elected nonemployee Directors as follows:
|
| | | | | | | | | |
Year of Grant | | Unrestricted Equity Grant Shares | | Restricted Equity Grant Shares | | Deferred Equity Grant Shares |
2012 | | 1,498 |
| | 8,988 |
| | 2,996 |
|
2013 | | 3,985 |
| | 31,506 |
| | 7,970 |
|
2014 | | — |
| | 73,635 |
| | — |
|
Other Information
The following table summarizes the share-based compensation expense that we recorded for continuing operations in 2014, 2013 and 2012:
|
| | | | | | | | | | | |
| (In Millions, except per share amounts) |
| 2014 | | 2013 | | 2012 |
Cost of goods sold and operating expenses | $ | 7.8 |
| | $ | 6.3 |
| | $ | 4.0 |
|
Selling, general and administrative expenses | 15.9 |
| | 14.8 |
| | 16.6 |
|
Reduction of operating income from continuing operations before income taxes and equity income (loss) from ventures | 23.7 |
| | 21.1 |
| | 20.6 |
|
Income tax benefit | (8.3 | ) | | (7.4 | ) | | (7.2 | ) |
Reduction of net income attributable to Cliffs shareholders | $ | 15.4 |
| | $ | 13.7 |
| | $ | 13.4 |
|
Reduction of earnings per share attributable to Cliffs shareholders: |
| |
| |
|
Basic | $ | 0.10 |
| | $ | 0.09 |
| | $ | 0.09 |
|
Diluted | $ | 0.10 |
| | $ | 0.08 |
| | $ | 0.09 |
|
Determination of Fair Value
The fair value of each grant is estimated on the date of grant using a Monte Carlo simulation to forecast relative TSR performance. A correlation matrix of historic and projected stock prices was developed for both the Company and our predetermined peer group of mining and metals companies. The fair value assumes that performance goals will be achieved.
The expected term of the grant represents the time from the grant date to the end of the service period for each of the three plan-year agreements. We estimate the volatility of our common shares and that of the peer group of mining and metals companies using daily price intervals for all companies. The risk-free interest rate is the rate at the grant date on zero-coupon government bonds, with a term commensurate with the remaining life of the performance period.
The following assumptions were utilized to estimate the fair value for the 2014 performance share grants:
|
| | | | | | | | | | | | | | | | | | |
Grant Date | | Grant Date Market Price | | Average Expected Term (Years) | | Expected Volatility | | Risk-Free Interest Rate | | Dividend Yield | | Fair Value | | Fair Value (Percent of Grant Date Market Price) |
February 10, 2014 | | $ | 20.58 |
| | 2.89 | | 54.0% | | 0.54% | | 2.92% | | $ | 22.21 |
| | 107.92% |
May 12, 2014 | | $ | 17.54 |
| | 2.61 | | 54.0% | | 0.54% | | 2.92% | | $ | 18.93 |
| | 107.92% |
July 29, 2014 | | $ | 17.62 |
| | 2.42 | | 51.3% | | 0.83% | | 3.40% | | $ | 19.02 |
| | 107.92% |
November 17, 2014 | | $ | 10.85 |
| | 3.12 | | 52.9% | | 1.18% | | 4.30% | | $ | 10.61 |
| | 97.79% |
The fair value of the restricted share units is determined based on the closing price of our common shares on the grant date. The restricted share units granted under either the 2012 Equity Plan or the 2012 Amended Equity Plan generally vest over a period of three years.
Restricted share units, restricted stock awards, deferred stock allocation and performance share activity under our long-term equity plans and Directors’ Plans are as follows:
|
| | | | | | | | |
| 2014 | | 2013 | | 2012 |
| Shares | | Shares | | Shares |
Stock options: | | | | | |
Outstanding at beginning of year | — |
| | — |
| | — |
|
Granted during the year | 250,000 |
| | — |
| | — |
|
Vested | — |
| | — |
| | — |
|
Forfeited/canceled | — |
| | — |
| | — |
|
Outstanding at end of year | 250,000 |
| | — |
| | — |
|
Restricted awards: | | | | | |
Outstanding and restricted at beginning of year | 586,084 |
| | 393,787 |
| | 425,166 |
|
Granted during the year | 531,030 |
| | 396,844 |
| | 151,869 |
|
Vested | (423,822 | ) | | (118,973 | ) | | (161,741 | ) |
Forfeited/canceled | (170,116 | ) | | (85,574 | ) | | (21,507 | ) |
Outstanding and restricted at end of year | 523,176 |
| | 586,084 |
| | 393,787 |
|
Performance shares: |
| |
| |
|
Outstanding at beginning of year | 1,040,453 |
| | 772,484 |
| | 877,435 |
|
Granted during the year 1 | 1,233,685 |
| | 806,271 |
| | 501,346 |
|
Issued 2 | (796,624 | ) | | (289,054 | ) | | (574,518 | ) |
Forfeited/canceled | (405,138 | ) | | (249,248 | ) | | (31,779 | ) |
Outstanding at end of year | 1,072,376 |
| | 1,040,453 |
| | 772,484 |
|
Vested or expected to vest as of December 31, 2014 | 1,723,728 |
| | | | |
Directors’ retainer and voluntary shares: |
| |
| |
|
Outstanding at beginning of year | 7,329 |
| | 2,880 |
| | 2,611 |
|
Granted during the year | 2,281 |
| | 8,136 |
| | 1,823 |
|
Forfeited/canceled | — |
| | (1,521 | ) | | — |
|
Vested | (9,610 | ) | | (2,166 | ) | | (1,554 | ) |
Outstanding at end of year | — |
| | 7,329 |
| | 2,880 |
|
Reserved for future grants or awards at end of year: | | | | | |
Employee plans | 6,222,434 |
| | | | |
Directors’ plans | 225,955 |
| | | | |
Total | 6,448,389 |
| | | | |
| |
1 | The shares granted in 2013 and 2012 include 54,051 shares and 191,506 shares, respectively, related to the 23% and 50% payouts associated with the prior-year pool as actual payout exceeded target. |
| |
2 | For the year ended December 31, 2014, the shares vesting on December 31, 2013 were valued as of February 10, 2014, and the shares vesting due to the change in a majority of our Board of Directors that triggered the acceleration of vesting and payout of outstanding equity grants under our equity plans on August 6, 2014, were valued as of that date. |
| |
| For the years ended December 31, 2013 and December 31, 2012, the shares vested on December 31, 2012 and December 31, 2011, respectively, and were valued on February 21, 2013 and February 13, 2012, respectively. |
A summary of our outstanding share-based awards as of December 31, 2014 is shown below:
|
| | | | | | |
| Shares | | Weighted Average Grant Date Fair Value |
Outstanding, beginning of year | 1,633,866 |
| |
| $40.20 |
|
Granted | 2,016,996 |
| |
| $16.67 |
|
Vested | (1,230,056 | ) | |
| $38.48 |
|
Forfeited/expired | (575,254 | ) | |
| $24.76 |
|
Outstanding, end of year | 1,845,552 |
| |
| $16.55 |
|
The total compensation cost related to outstanding awards not yet recognized is $18.3 million at December 31, 2014. The weighted average remaining period for the awards outstanding at December 31, 2014 is approximately 2.5 years.
NOTE 9 - INCOME TAXES
Income (Loss) from Continuing Operations Before Income Taxes and Equity Income (Loss) from Ventures includes the following components:
|
| | | | | | | | | | | | |
| | (In Millions) |
| | 2014 | | 2013 | | 2012 |
United States | | $ | (1,884.2 | ) | | $ | 837.7 |
| | $ | 838.6 |
|
Foreign | | (7,719.5 | ) | | (348.4 | ) | | (1,340.4 | ) |
| | $ | (9,603.7 | ) | | $ | 489.3 |
| | $ | (501.8 | ) |
The components of the provision (benefit) for income taxes on continuing operations consist of the following:
|
| | | | | | | | | | | | |
| | (In Millions) |
| | 2014 | | 2013 | | 2012 |
Current provision (benefit): | | | | | | |
United States federal | | $ | (159.9 | ) | | $ | 101.3 |
| | $ | 71.1 |
|
United States state & local | | (0.6 | ) | | 4.0 |
| | 7.6 |
|
Foreign | | 17.2 |
| | 87.9 |
| | 50.2 |
|
| | (143.3 | ) | | 193.2 |
| | 128.9 |
|
Deferred provision (benefit): | | | | | | |
United States federal | | (258.9 | ) | | 23.3 |
| | 221.2 |
|
United States state & local | | (43.0 | ) | | 3.0 |
| | 1.4 |
|
Foreign | | (856.8 | ) | | (164.4 | ) | | (95.6 | ) |
| | (1,158.7 | ) | | (138.1 | ) | | 127.0 |
|
Total provision on income (loss) from continuing operations | | $ | (1,302.0 | ) | | $ | 55.1 |
| | $ | 255.9 |
|
Reconciliation of our income tax attributable to continuing operations computed at the U.S. federal statutory rate is as follows:
|
| | | | | | | | | | | | | | | | | | | | | |
| | (In Millions) |
| | 2014 | | 2013 | | 2012 |
Tax at U.S. statutory rate of 35 percent | | $ | (3,361.3 | ) | | 35.0 | % | | $ | 171.3 |
| | 35.0 | % | | $ | (175.6 | ) | | 35.0 | % |
Increase (decrease) due to: | | | | | | | | | | | | |
Foreign exchange remeasurement | | (4.1 | ) | | — |
| | (2.6 | ) | | (0.5 | ) | | 62.3 |
| | (12.4 | ) |
Non-taxable income related to noncontrolling interests | | 290.1 |
| | (3.0 | ) | | (1.5 | ) | | (0.3 | ) | | 61.0 |
| | (12.0 | ) |
Impact of tax law change | | 13.0 |
| | (0.1 | ) | | — |
| | — |
| | (357.1 | ) | | 71.2 |
|
Percentage depletion in excess of cost depletion | | (87.9 | ) | | 0.9 |
| | (97.6 | ) | | (19.9 | ) | | (109.1 | ) | | 21.7 |
|
Impact of foreign operations | | 592.0 |
| | (6.2 | ) | | (10.2 | ) | | (2.1 | ) | | 65.2 |
| | (13.0 | ) |
Income not subject to tax | | (46.5 | ) | | 0.5 |
| | (106.6 | ) | | (21.8 | ) | | (108.0 | ) | | 21.5 |
|
Goodwill impairment | | 22.7 |
| | (0.2 | ) | | 20.5 |
| | 4.2 |
| | 202.2 |
| | (40.3 | ) |
State taxes, net | | (43.6 | ) | | 0.5 |
| | 5.6 |
| | 1.1 |
| | 7.3 |
| | (1.5 | ) |
Settlement of financial guaranty | | (343.3 | ) | | 3.6 |
| | — |
| | — |
| | — |
| | — |
|
Manufacturer’s deduction | | — |
| | — |
| | (7.9 | ) | | (1.6 | ) | | (4.7 | ) | | 0.9 |
|
Valuation allowance | | 1,660.6 |
| | (17.3 | ) | | 73.0 |
| | 14.9 |
| | 634.5 |
| | (126.5 | ) |
Tax uncertainties | | 0.2 |
| | — |
| | 19.6 |
| | 5.3 |
| | (14.8 | ) | | 2.9 |
|
Prior year adjustment in current year | | (10.4 | ) | | 0.1 |
| | (11.4 | ) | | (3.6 | ) | | (5.7 | ) | | 1.1 |
|
Other items — net | | 16.5 |
| | (0.2 | ) | | 2.9 |
| | 0.6 |
| | (1.6 | ) | | 0.4 |
|
Income tax (benefit) expense | | $ | (1,302.0 | ) | | 13.6 | % | | $ | 55.1 |
| | 11.3 | % | | $ | 255.9 |
| | (51.0 | )% |
The components of income taxes for other than continuing operations consisted of the following:
|
| | | | | | | | | | | | |
| | (In Millions) |
| | 2014 | | 2013 | | 2012 |
Other comprehensive (income) loss: | | | | | | |
Pension/OPEB liability | | $ | 39.8 |
| | $ | 100.0 |
| | $ | 13.8 |
|
Mark-to-market adjustments | | 3.6 |
| | 2.0 |
| | 1.7 |
|
Other | | (1.1 | ) | | (12.4 | ) | | 2.6 |
|
Total | | $ | 42.3 |
| | $ | 89.6 |
| | $ | 18.1 |
|
| | | | | | |
Paid in capital — acquisition of noncontrolling interest | | $ | — |
| | $ | 102.1 |
| | $ | — |
|
Paid in capital — stock based compensation | | $ | (4.8 | ) | | $ | 3.5 |
| | $ | (12.8 | ) |
Discontinued Operations | | $ | — |
| | $ | (2.0 | ) | | $ | 10.4 |
|
Significant components of our deferred tax assets and liabilities as of December 31, 2014 and 2013 are as follows:
|
| | | | | | | | |
| | (In Millions) |
| | 2014 | | 2013 |
Deferred tax assets: | | | | |
Pensions | | $ | 108.3 |
| | $ | 88.4 |
|
MRRT starting base allowance | | — |
| | 300.3 |
|
Postretirement benefits other than pensions | | 63.0 |
| | 58.0 |
|
Alternative minimum tax credit carryforwards | | 267.7 |
| | 299.2 |
|
Investments in ventures | | 6.0 |
| | — |
|
Asset retirement obligations | | 48.9 |
| | 61.7 |
|
Operating loss carryforwards | | 1,083.5 |
| | 524.4 |
|
Product inventories | | 32.3 |
| | 16.4 |
|
Property, plant and equipment and mineral rights | | 901.6 |
| | 56.0 |
|
State and local | | 41.9 |
| | — |
|
Lease liabilities | | 14.1 |
| | 31.9 |
|
Other liabilities | | 153.6 |
| | 138.3 |
|
Total deferred tax assets before valuation allowance | | 2,720.9 |
| | 1,574.6 |
|
Deferred tax asset valuation allowance | | (2,224.5 | ) | | (864.1 | ) |
Net deferred tax assets | | 496.4 |
| | 710.5 |
|
Deferred tax liabilities: | |
| |
|
Property, plant and equipment and mineral rights | | (20.0 | ) | | (1,400.8 | ) |
Investment in ventures | | (198.0 | ) | | (196.4 | ) |
Intangible assets | | (7.3 | ) | | (33.5 | ) |
Income tax uncertainties | | (49.5 | ) | | (48.5 | ) |
Product inventories | | (16.6 | ) | | (12.8 | ) |
Other assets | | (80.2 | ) | | (93.0 | ) |
Total deferred tax liabilities | | (371.6 | ) | | (1,785.0 | ) |
Net deferred tax assets (liabilities) | | $ | 124.8 |
| | $ | (1,074.5 | ) |
The deferred tax amounts are classified in the Statements of Consolidated Financial Position as current or long-term consistently with the underlying asset or liability that generates the basis difference between financial reporting and tax. Following is a summary:
|
| | | | | | | | |
| | (In Millions) |
| | 2014 | | 2013 |
Deferred tax assets: | | | | |
United States | | $ | 165.9 |
| | $ | 7.2 |
|
Foreign | | | | |
Current | | 2.2 |
| | 29.4 |
|
Long-term | | 12.0 |
| | 41.5 |
|
Total deferred tax assets | | 180.1 |
| | 78.1 |
|
Deferred tax liabilities: | | | | |
United States | | — |
| | 175.3 |
|
Foreign | | | | |
Current | | 4.0 |
| | 6.1 |
|
Long-term | | 51.3 |
| | 971.2 |
|
Total deferred tax liabilities | | 55.3 |
| | 1,152.6 |
|
Net deferred tax assets (liabilities) | | $ | 124.8 |
| | $ | (1,074.5 | ) |
At December 31, 2014 and 2013, we had $267.7 million and $299.2 million, respectively, of gross deferred tax assets related to U.S. alternative minimum tax credits that can be carried forward indefinitely.
We had gross domestic (including states) and foreign net operating loss carryforwards of $1.9 billion, and $6.0 billion, respectively, at December 31, 2014. We had gross state and foreign net operating loss carryforwards at December 31, 2013 of $157.9 million and $3.5 billion, respectively. The U.S. Federal net operating losses will begin to expire in 2035 and state net operating losses will begin to expire in 2019. The foreign net operating losses will begin to expire in 2015. We had foreign tax credit carryforwards of $5.8 million at December 31, 2014 and December 31, 2013. The foreign tax credit carryforwards will begin to expire in 2020. Additionally, there is a net operating loss carryforward of $540.7 million for Alternative Minimum Tax. No benefit has been recorded in the financials for this attribute as ASC 740 does not allow for the recording of deferred taxes under alternative taxing systems. However, the future economic realizable benefit for this attribute is expected to be approximately $108.1 million.
We recorded a $1,361.0 million net increase in the valuation allowance of certain deferred tax assets where management believes that realization of the related deferred tax assets is not more likely than not. Of this amount, a $18.2 million increase relates to ordinary losses of certain state operations for which future utilization is currently uncertain, a $291.0 million decrease relates to the reversal of our valuation allowance on MRRT tax credits due to the repeal of the MRRT legislation, and a $28.6 million decrease relates to the change in available Alternative Minimum Tax credits after carryback of current year losses. A $1,273.2 million increase relates to foreign deferred tax assets that management has determined it is more likely than not that the assets will not be realized. A $402.5 million increase relates to U.S. regular tax net operating losses where it has been determined that the full benefit of these losses will not be realized as we are perpetual Alternative Minimum taxpayers.
At December 31, 2014, we had no cumulative undistributed earnings of foreign subsidiaries included in consolidated retained earnings. At December 31, 2013, cumulative undistributed earnings of foreign subsidiaries included in consolidated retained earnings amounted to $1.2 billion. The change in undistributed earnings resulted from transactions executed during 2014 which triggered the realization of losses with respect to the value in our investment in Cliffs Quebec Iron Mines. Accordingly, no provision has been made for U.S. deferred taxes related to future repatriation of earnings.
A reconciliation of the beginning and ending amount of unrecognized tax benefits is as follows:
|
| | | | | | | | | | | | |
| | (In Millions) |
| | 2014 | | 2013 | | 2012 |
Unrecognized tax benefits balance as of January 1 | | $ | 74.4 |
| | $ | 55.5 |
| | $ | 102.1 |
|
Increases for tax positions in prior years | | 3.4 |
| | 13.6 |
| | 2.7 |
|
Increases for tax positions in current year | | 2.5 |
| | 5.3 |
| | 11.1 |
|
Increase due to foreign exchange | | (0.2 | ) | | — |
| | — |
|
Settlements | | (0.5 | ) | | — |
| | (60.4 | ) |
Lapses in statutes of limitations | | (3.7 | ) | | — |
| | — |
|
Other | | (1.2 | ) | | — |
| | — |
|
Unrecognized tax benefits balance as of December 31 | | $ | 74.7 |
| | $ | 74.4 |
| | $ | 55.5 |
|
At December 31, 2014 and 2013, we had $74.7 million and $74.4 million, respectively, of unrecognized tax benefits recorded. Of this amount, $25.2 million and $25.9 million were recorded in Other liabilities and $49.5 million and $48.5 million were recorded as Other non-current assets in the Statements of Consolidated Financial Position for both years. If the $74.7 million were recognized, the full amount would impact the effective tax rate. We do not expect that the amount of unrecognized tax benefits will change significantly within the next twelve months. At December 31, 2014 and 2013, we had $2.1 million and $1.2 million, respectively, of accrued interest and penalties related to the unrecognized tax benefits recorded in Other liabilities in the Statements of Consolidated Financial Position.
On July 18, 2013, the FASB issued Accounting Standards Update No. 2013-11. Presentation of an Unrecognized Tax Benefit When a Net Operating Loss Carryforward, a Similar Tax Loss, or a Tax Credit Carryforward Exists (ASU 2013-11). ASU 2013-11 requires the netting of unrecognized tax benefits against a deferred tax asset for a loss or other carryforward that would apply in settlement of the uncertain tax positions except where the deferred tax asset or other carryforward are not available for use. The adoption of the pronouncement does not have an impact in the presentation of our financial statement.
Tax years that remain subject to examination are years 2010 and forward for the U.S., 2006 and forward for Canada, and 2007 and forward for Australia.
NOTE 10 - LEASE OBLIGATIONS
We lease certain mining, production and other equipment under operating and capital leases. The leases are for varying lengths, generally at market interest rates and contain purchase and/or renewal options at the end of the terms. Our operating lease expense was $20.6 million, $29.5 million and $25.8 million for the years ended December 31, 2014, 2013 and 2012, respectively. Capital lease assets were $92.7 million and $404.0 million at December 31, 2014 and 2013, respectively. The value of the capital lease assets in 2014 have decreased due to several factors including impairment charges of $140.4 million on our Asia Pacific Iron Ore, North American Coal and Eastern Canadian Iron Ore operations. Other factors involved are the announced exiting out of Eastern Canadian Iron Ore, additions/deletions of assets, depreciation, etc. Corresponding accumulated amortization of capital leases included in respective allowances for depreciation were $18.1 million and $198.5 million at December 31, 2014 and 2013, respectively.
Future minimum payments under capital leases and non-cancellable operating leases at December 31, 2014 are as follows:
|
| | | | | | | |
| (In Millions) |
| Capital Leases | | Operating Leases |
2015 | $ | 84.8 |
| | $ | 12.0 |
|
2016 | 34.1 |
| | 9.3 |
|
2017 | 26.9 |
| | 8.4 |
|
2018 | 20.4 |
| | 6.8 |
|
2019 | 11.4 |
| | 4.8 |
|
2020 and thereafter | 21.0 |
| | 9.9 |
|
Total minimum lease payments | $ | 198.6 |
| | $ | 51.2 |
|
Amounts representing interest | 31.3 |
| | |
Present value of net minimum lease payments | $ | 167.3 |
| (1) | |
| |
(1) | The total is comprised of $74.5 million and $92.8 million classified as Current portion of capital leases and Other liabilities, respectively, in the Statements of Unaudited Condensed Consolidated Financial Position at December 31, 2014. |
NOTE 11 - ENVIRONMENTAL AND MINE CLOSURE OBLIGATIONS
We had environmental and mine closure liabilities of $261.2 million and $321.0 million at December 31, 2014 and 2013, respectively. Payments in 2014 and 2013 were $3.1 million and $8.2 million, respectively. The following is a summary of the obligations as of December 31, 2014 and 2013:
|
| | | | | | | |
| (In Millions) |
| December 31, |
| 2014 | | 2013 |
Environmental | $ | 5.5 |
| | $ | 8.4 |
|
Mine closure | | | |
LTVSMC | 22.9 |
| | 22.0 |
|
Operating mines: | | | |
U.S. Iron Ore | 120.9 |
| | 152.2 |
|
Asia Pacific Iron Ore | 21.5 |
| | 25.5 |
|
North American Coal | 33.9 |
| | 34.7 |
|
Eastern Canadian Iron Ore | 56.5 |
| | 78.2 |
|
Total mine closure | 255.7 |
| | 312.6 |
|
Total environmental and mine closure obligations | 261.2 |
| | 321.0 |
|
Less current portion | 5.2 |
| | 11.3 |
|
Long-term environmental and mine closure obligations | $ | 256.0 |
| | $ | 309.7 |
|
Environmental
Our mining and exploration activities are subject to various laws and regulations governing the protection of the environment. We conduct our operations to protect the public health and environment and believe our operations are in compliance with applicable laws and regulations in all material respects. Our environmental liabilities of $5.5 million and $8.4 million at December 31, 2014 and 2013, respectively, including obligations for known environmental remediation exposures at various active and closed mining operations and other sites, have been recognized based on the estimated cost of investigation and remediation at each site. If the cost only can be estimated as a range of possible amounts with no specific amount being more likely, the minimum of the range is accrued. Future expenditures are not discounted unless the amount and timing of the cash disbursements readily are known. Potential insurance recoveries have not been reflected. Additional environmental obligations could be incurred, the extent of which cannot be assessed.
As discussed in further detail below, the environmental liability recorded at December 31, 2014 and 2013 primarily is comprised of remediation obligations related to the Rio Tinto mine site in Nevada where we are named as a potentially responsible party.
The Rio Tinto Mine Site
The Rio Tinto Mine Site is a historic underground copper mine located near Mountain City, Nevada, where tailings were placed in Mill Creek; a tributary to the Owyhee River. Site investigation and remediation work is being conducted in accordance with a Consent Order dated September 14, 2001 between the NDEP and the Rio Tinto Working Group composed of the Company, Atlantic Richfield Company, Teck Cominco American Incorporated and E. I. duPont de Nemours and Company. The Consent Order provides for technical review by the U.S. Department of the Interior Bureau of Indian Affairs, the U.S. Fish and Wildlife Service, U.S. Department of Agriculture Forest Service, the NDEP and the Shoshone-Paiute Tribe of the Duck Valley Reservation (collectively, "Rio Tinto Trustees"). In recognition of the potential for an NRD claim, the parties actively pursued a global settlement that would include the EPA and encompass both the remedial action and the NRD issues.
The NDEP published a Record of Decision for the Rio Tinto Mine, which was signed on February 14, 2012 by the NDEP and the EPA. On September 27, 2012, the agencies subsequently issued a proposed Consent Decree, which was lodged with the U.S. District Court for the District of Nevada and opened for 30-day public comment on October 4, 2012. The Consent Decree was subsequently finalized on May 20, 2013. Under the terms of the Consent Decree, the Rio Tinto Working Group has agreed to pay over $29.0 million in cleanup costs and natural resource damages to the site and surrounding area. The Company's share of the total settlement cost, which includes remedial action, insurance and other oversight costs is $12.2 million, of which we have a remaining environmental liability of $2.5 million and $5.3
million in the Statements of Consolidated Financial Position as of December 31, 2014 and 2013, respectively, related to this issue.
Under the terms of the Consent Decree, the Rio Tinto Working Group will be responsible for removing mine tailings from Mill Creek, improving the creek to support redband trout and improving water quality in Mill Creek and the East Fork Owyhee River. Previous cleanup projects included filling in old mine shafts, grading and covering leach pads and tailings, and building diversion ditches. NDEP will oversee the cleanup, with input from EPA and monitoring from the nearby Shoshone-Paiute Tribes of Duck Valley.
Mine Closure
Our mine closure obligations of $255.7 million and $312.6 million at December 31, 2014 and 2013, respectively, include our five consolidated U.S. operating iron ore mines, our Asia Pacific operating iron ore mine, our two operating North American coal mines, our two Eastern Canadian iron ore mines and a closed operation formerly operating as LTVSMC. Additionally, included in the December 31, 2013 mine closure obligation are the mine closure obligations related to the three mines at our CLCC operations. The CLCC assets were sold during the fourth quarter of 2014. As disclosed, at the end of March 2014, we idled our Wabush Scully mine in Newfoundland and Labrador and in the fourth quarter we began to implement the permanent closure plan for the mine. Additionally, we disclosed in November 2014 that we were pursuing exit options for our Bloom Lake mine and as disclosed in January 2015, active production at Bloom Lake mine has completely ceased and the mine has transitioned to "care-and-maintenance" mode.
Management periodically performs an assessment of the obligation to determine the adequacy of the liability in relation to the closure activities still required at the LTVSMC site. The LTVSMC closure liability was $22.9 million and $22.0 million at December 31, 2014 and 2013, respectively. MPCA is presently working on an NPDES permit reissuance for this facility that could modify the closure liability, but the scale of that change will not be understood until the permit has been drafted and issued.
The accrued closure obligation for our active mining operations provides for contractual and legal obligations associated with the eventual closure of the mining operations. We performed a detailed assessment of our asset retirement obligations related to our active mining locations most recently in 2014, except for Bloom Lake, in accordance with our accounting policy, which requires us to perform an in-depth evaluation of the liability every three years in addition to routine annual assessments. The most recent assessment for Bloom Lake was performed in 2012.
For the assessments performed, we determined the obligations based on detailed estimates adjusted for factors that a market participant would consider (i.e., inflation, overhead and profit) and then discounted the obligation using the current credit-adjusted risk-free interest rate based on the corresponding life of mine. The estimate also incorporates incremental increases in the closure cost estimates and changes in estimates of mine lives. The closure date for each location was determined based on the exhaustion date of the remaining iron ore reserves. The accretion of the liability and amortization of the related asset is recognized over the estimated mine lives for each location.
The following represents a roll forward of our asset retirement obligation liability related to our active mining locations for the years ended December 31, 2014 and 2013:
|
| | | | | | | |
| (In Millions) |
| December 31, |
| 2014 | | 2013 |
Asset retirement obligation at beginning of period | $ | 290.6 |
| | $ | 231.1 |
|
Accretion expense | 14.5 |
| | 18.1 |
|
Exchange rate changes | (2.4 | ) | | (3.4 | ) |
Revision in estimated cash flows | (65.2 | ) | | 44.8 |
|
Disposal of CLCC Assets | (4.7 | ) | | $ | — |
|
Asset retirement obligation at end of period | $ | 232.8 |
| | $ | 290.6 |
|
The revisions in estimated cash flows recorded during the year ended December 31, 2014 relate primarily to a downward revision of estimated asset retirement costs for one of our U.S. Iron Ore mines associated with required storm water management systems. The mine life was extended during 2014, effectively converting certain asset retirement costs to capital costs over the remaining life-of-mine. The reduction in estimated cash flows was also attributable to the mine life for one of the Eastern Canadian Iron Ore mines being shortened by seven years along with a decrease in the inflation rate causing additional downward revisions in estimated cash flows recorded during the year ended December 31, 2014.
For the year ended December 31, 2013, the revisions in estimated cash flows recorded during the year primarily included estimated asset retirement costs for one of our U.S. Iron Ore mines associated with required storm water management systems expected to be implemented subsequent to the closure of the mine, as described above.
NOTE 12 - GOODWILL AND OTHER INTANGIBLE ASSETS AND LIABILITIES
Goodwill
Goodwill represents the excess purchase price paid over the fair value of the net assets of acquired companies and is not subject to amortization. We assign goodwill arising from acquired companies to the reporting units that are expected to benefit from the synergies of the acquisition. Our reporting units are either at the operating segment level or a component one level below our operating segments that constitutes a business for which management generally reviews production and financial results of that component. Decisions often are made as to capital expenditures, investments and production plans at the component level as part of the ongoing management of the related operating segment. We have determined that our Asia Pacific Iron Ore and Ferroalloys operating segments constitute separate reporting units, that CQIM and Wabush within our Eastern Canadian Iron Ore operating segment constitute reporting units and that Northshore within our U.S. Iron Ore operating segment constitutes a reporting unit. Goodwill is allocated among and evaluated for impairment at the reporting unit level in the fourth quarter of each year or as circumstances occur that potentially indicate that the carrying amount of these assets may exceed their fair value.
During the third quarter of 2014, a goodwill impairment charge of $73.5 million was recorded for our Asia Pacific Iron Ore reporting segment. The impairment charge was a result of downward long-term pricing estimates as determined through management's long-range planning process.
During the fourth quarter of 2013, upon performing our annual goodwill impairment test, a goodwill impairment charge of $80.9 million was recorded for our Cliffs Chromite Ontario and Cliffs Chromite Far North reporting units within our Ferroalloys operating segment. The impairment charge was primarily a result of the decision made in the fourth quarter of 2013 to indefinitely suspend the Chromite Project and to not allocate additional capital for the project given the uncertain timeline and risks associated with the development of necessary infrastructure to bring the project online.
Refer to NOTE 6 - FAIR VALUE OF FINANCIAL INSTRUMENTS for further information.
The following table summarizes changes in the carrying amount of goodwill allocated by operating segment for the years ended December 31, 2014 and December 31, 2013:
|
| | | | | | | | | | | | | | | | | | | | | | | | | | | | | | | | | | | | | | | |
| (In Millions) |
| December 31, 2014 | | December 31, 2013 |
| U.S. Iron Ore | | Eastern Canadian Iron Ore | | Asia Pacific
Iron Ore | | Other | | Total | | U.S. Iron Ore | | Eastern Canadian Iron Ore | | Asia Pacific Iron Ore | | Other | | Total |
Beginning Balance | $ | 2.0 |
| | $ | — |
| | $ | 72.5 |
| | $ | — |
| | $ | 74.5 |
| | $ | 2.0 |
| | $ | — |
| | $ | 84.5 |
| | $ | 80.9 |
| | $ | 167.4 |
|
Arising in business combinations | — |
| | — |
| | — |
| | — |
| | — |
| | — |
| | — |
| | — |
| | — |
| | — |
|
Impairment | — |
| | — |
| | (73.5 | ) | | — |
| | (73.5 | ) | | — |
| | — |
| | — |
| | (80.9 | ) | | (80.9 | ) |
Impact of foreign currency translation | — |
| | — |
| | 1.0 |
| | — |
| | 1.0 |
| | — |
| | — |
| | (12.0 | ) | | — |
| | (12.0 | ) |
Ending Balance | $ | 2.0 |
| | $ | — |
| | $ | — |
| | $ | — |
| | $ | 2.0 |
| | $ | 2.0 |
| | $ | — |
| | $ | 72.5 |
| | $ | — |
| | $ | 74.5 |
|
Accumulated Goodwill Impairment Loss | $ | — |
| | $ | (1,000.0 | ) | | $ | (73.5 | ) | | $ | (80.9 | ) | | $ | (1,154.4 | ) | | $ | — |
| | $ | (1,000.0 | ) | | $ | — |
| | $ | (80.9 | ) | | $ | (1,080.9 | ) |
Other Intangible Assets and Liabilities
Following is a summary of intangible assets and liabilities as of December 31, 2014 and December 31, 2013:
|
| | | | | | | | | | | | | | | | | | | | | | | | | |
| | | (In Millions) |
| | | December 31, 2014 | | December 31, 2013 |
| Classification | | Gross Carrying Amount | | Accumulated Amortization | | Net Carrying Amount | | Gross Carrying Amount | | Accumulated Amortization | | Net Carrying Amount |
Definite-lived intangible assets: | | | | | | | | | | | | | |
Permits | Other non-current assets | | $ | 79.2 |
| | $ | (16.5 | ) | | $ | 62.7 |
| | $ | 127.4 |
| | $ | (35.9 | ) | | $ | 91.5 |
|
Utility contracts | Other non-current assets | | — |
| | — |
| | — |
| | 54.7 |
| | (53.1 | ) | | 1.6 |
|
Leases | Other non-current assets | | — |
| | — |
| | — |
| | 2.4 |
| | (0.1 | ) | | 2.3 |
|
Total intangible assets | | | $ | 79.2 |
| | $ | (16.5 | ) | | $ | 62.7 |
| | $ | 184.5 |
| | $ | (89.1 | ) | | $ | 95.4 |
|
Below-market sales contracts | Other current liabilities | | $ | (23.0 | ) | | $ | — |
| | $ | (23.0 | ) | | $ | (23.0 | ) | | $ | — |
| | $ | (23.0 | ) |
Below-market sales contracts | Other liabilities | | (205.9 | ) | | 182.8 |
| | (23.1 | ) | | (205.9 | ) | | 159.7 |
| | (46.2 | ) |
Total below-market sales contracts | | | $ | (228.9 | ) | | $ | 182.8 |
| | $ | (46.1 | ) | | $ | (228.9 | ) | | $ | 159.7 |
| | $ | (69.2 | ) |
Amortization expense relating to intangible assets was $10.4 million, $19.9 million and $22.5 million for the years ended December 31, 2014, 2013 and 2012, and is recognized in Cost of goods sold and operating expenses in the Statements of Consolidated Operations. During the year ended December 31, 2014, an impairment charge of $15.5 million was recorded related to the permits intangible asset and is recognized in Impairment of goodwill and other long-lived assets in the Statements of Consolidated Operations. Additionally, during 2013, an impairment charge of $9.5 million was recorded related to the utility contracts intangible asset and was recognized in Impairment of goodwill and other long-lived assets. There was no impairment charge recorded for definite-lived intangible assets in 2012. The estimated amortization expense relating to intangible assets for each of the five succeeding years is as follows:
|
| | | |
| (In Millions) |
| Amount |
Year Ending December 31 |
|
2015 | 4.1 |
|
2016 | 4.2 |
|
2017 | 4.0 |
|
2018 | 3.8 |
|
2019 | 3.5 |
|
Total | $ | 19.6 |
|
The below-market sales contract is classified as a liability and recognized over the term of the underlying contract, which has a remaining life of approximately two years and expires December 31, 2016. For the years ended December 31, 2014, 2013 and 2012, we recognized $23.1 million, $45.9 million and $46.3 million, respectively, in Product revenues related to below-market sales contracts. The following amounts are estimated to be recognized in Product revenues for each of the two succeeding fiscal years:
|
| | | |
| (In Millions) |
| Amount |
Year Ending December 31 | |
2015 | 23.0 |
|
2016 | 23.1 |
|
Total | $ | 46.1 |
|
NOTE 13 - DERIVATIVE INSTRUMENTS AND HEDGING ACTIVITIES
The following table presents the fair value of our derivative instruments and the classification of each in the Statements of Consolidated Financial Position as of December 31, 2014 and December 31, 2013:
|
| | | | | | | | | | | | | | | | | | | | | | | |
| (In Millions) |
| Derivative Assets | | Derivative Liabilities |
| December 31, 2014 | | December 31, 2013 | | December 31, 2014 | | December 31, 2013 |
Derivative Instrument | Balance Sheet Location | | Fair Value | | Balance Sheet Location | | Fair Value | | Balance Sheet Location | | Fair Value | | Balance Sheet Location | | Fair Value |
Derivatives designated as hedging instruments under ASC 815: | | | | | | | | | | | | | | | |
Interest-Rate Swaps | | | $ | — |
| | | | $ | — |
| | Other current liabilities | | $ | — |
| | | | $ | 2.1 |
|
Foreign Exchange Contracts | Other current assets | | — |
| | Other current assets | | 0.3 |
| | Other current liabilities | | 21.6 |
| | Other current liabilities | | 25.8 |
|
Total derivatives designated as hedging instruments under ASC 815 | | | $ | — |
| | | | $ | 0.3 |
| | | | $ | 21.6 |
| | | | $ | 27.9 |
|
Derivatives not designated as hedging instruments under ASC 815: | | | | | | | | | | | | | | | |
Foreign Exchange Contracts | | | $ | — |
| | | | $ | — |
| | Other current liabilities | | $ | 9.9 |
| | Other current liabilities | | $ | 1.1 |
|
Customer Supply Agreements | Other current assets | | 63.2 |
| | Other current assets | | 55.8 |
| | | | — |
| | | | — |
|
Provisional Pricing Arrangements | Other current assets | | — |
| | Other current assets | | 3.1 |
| | Other current liabilities | | 11.8 |
| | Other current liabilities | | 10.3 |
|
Total derivatives not designated as hedging instruments under ASC 815: | | | $ | 63.2 |
| | | | $ | 58.9 |
| | | | $ | 21.7 |
| | | | $ | 11.4 |
|
Total derivatives | | | $ | 63.2 |
| | | | $ | 59.2 |
| | | | $ | 43.3 |
| | | | $ | 39.3 |
|
Derivatives Designated as Hedging Instruments
Cash Flow Hedges
Australian and Canadian Dollar Foreign Exchange Contracts
We are subject to changes in foreign currency exchange rates as a result of our operations in Australia and Canada. With respect to Australia, foreign exchange risk arises from our exposure to fluctuations in foreign currency exchange rates because the functional currency of our Asia Pacific operations is the Australian dollar. Our Asia Pacific operations receive funds in U.S. currency for their iron ore sales. The functional currency of our Canadian operations is the U.S. dollar; however, the production costs for these operations primarily are incurred in the Canadian dollar.
We use foreign currency exchange contracts to hedge our foreign currency exposure for a portion of our U.S. dollar sales receipts in our Australian functional currency entities and our entities with Canadian dollar operating costs. For our Australian operations, U.S. dollars are converted to Australian dollars at the currency exchange rate in effect during the period the transaction occurred. For our Canadian operations, U.S. dollars are converted to Canadian dollars at the exchange rate in effect for the period the operating costs are incurred. The primary objective for the use of these instruments is to reduce exposure to changes in currency exchange rates and to protect against undue adverse movement in these exchange rates. If the instruments qualify for hedge accounting treatment, they are tested for effectiveness at inception and at least once each reporting period. If and when any of our contracts that had qualified for hedge accounting treatment are determined not to be highly effective as hedges, the underlying hedged transaction is no longer likely to occur, or the derivative is terminated, hedge accounting is discontinued.
As of December 31, 2014, we had outstanding Australian foreign currency exchange contracts with notional amounts of $220.0 million in the form of forward contracts with varying maturity dates ranging from January 2015 to October 2015. We had no Canadian foreign currency exchange contracts that were considered cash flow hedges and that qualified for hedge accounting treatment at December 31, 2014, as during the fourth quarter of 2014 the Canadian foreign currency exchange contracts were de-designated. The de-designation of the Canadian hedge contracts is discussed below. This compares with outstanding Australian and Canadian foreign currency exchange contracts with a notional amount of $323.0 million and $285.9 million, respectively, as of December 31, 2013.
Changes in fair value of highly effective hedges are recorded as a component of Accumulated other comprehensive loss in the Statements of Consolidated Financial Position. Any ineffectiveness is recognized immediately in income. As of December 31, 2014 and 2013, there was no material ineffectiveness recorded for foreign exchange contracts that were classified as cash flow hedges. However, Canadian hedge contracts related to the Bloom Lake operations were deemed ineffective during the fourth quarter of 2014 and no longer qualified for hedge accounting treatment. The Canadian hedge contracts de-designated in the fourth quarter of 2014 were all that remained of the Canadian hedge contracts. Canadian hedge contracts associated with the Wabush and Ferroalloys operations were deemed ineffective during the fourth quarter of 2013 and no longer qualified for hedge accounting treatment. All of the hedges designated in the fourth quarter of 2013 settled and were no longer outstanding by June 30, 2014. The de-designated hedges are discussed within the Derivatives Not Designated as Hedging Instruments section of this footnote. Amounts recorded as a component of Accumulated other comprehensive loss are reclassified into earnings in the same period the forecasted transactions affect earnings. Of the amounts remaining in Accumulated other comprehensive loss related to Australian hedge contracts, we estimate that losses of $15.1 million (net of tax), respectively, will be reclassified into earnings within the next 12 months. No amounts remain in Accumulated other comprehensive loss related to Canadian hedge contracts.
Interest Rate Risk Management
Interest rate risk is managed using a portfolio of variable-rate and fixed-rate debt composed of short-term and long-term instruments, such as U.S. treasury lock agreements and variable-to-fixed interest rate swaps. From time to time, these instruments, which are derivative instruments, are entered into to facilitate the maintenance of the desired ratio of variable-rate to fixed-rate debt.
In the second quarter of 2012, we entered into U.S. treasury lock agreements with a notional value of $200.0 million to hedge the exposure to the possible rise in the interest rate prior to the issuance of the five-year senior notes due 2018 discussed in NOTE 5 - DEBT AND CREDIT FACILITIES. These derivative instruments were designated and qualified as cash flow hedges. The U.S. treasury locks were settled in the fourth quarter of 2012 upon the issuance of $500.0 million principal amount of the senior notes due 2018 for a cumulative after-tax loss of $1.3 million, which was recorded in Accumulated other comprehensive loss and is being amortized to Other non-operating income (expense) over the life of the senior notes due 2018. Approximately $0.1 million net of tax was recognized in earnings in both 2013 and 2014 and approximately $0.1 million net of tax is expected to be recognized in earnings in 2015.
The following summarizes the effect of our derivatives designated as cash flow hedging instruments, net of tax in Accumulated other comprehensive loss in the Statements of Consolidated Operations for the years ended December 31, 2014, 2013 and 2012:
|
| | | | | | | | | | | | | | | | | | | | | | | | | |
| (In Millions) |
Derivatives in Cash Flow | Amount of Gain (Loss) Recognized in OCI on Derivative | | Location of Gain (Loss) Reclassified from Accumulated OCI into Earnings | | Amount of Gain (Loss) Reclassified from Accumulated OCI into Earnings |
Hedging Relationships | (Effective Portion) | | (Effective Portion) | | (Effective Portion) |
| Year Ended
December 31, | | | | Year Ended
December 31, |
| 2014 | | 2013 | | 2012 | | | | 2014 | | 2013 | | 2012 |
Australian Dollar Foreign Exchange Contracts (hedge designation) | $ | (13.9 | ) | | $ | (34.7 | ) | | $ | 20.2 |
| | Product revenues | | $ | (13.2 | ) | | $ | (11.9 | ) | | $ | 14.8 |
|
Canadian Dollar Foreign Exchange Contracts (hedge designation) | — |
| | (12.9 | ) | | 6.7 |
| | Cost of goods sold and operating expenses | | — |
| | (8.2 | ) | | 3.3 |
|
Canadian Dollar Foreign
Exchange Contracts
(prior to de-designation) | (14.3 | ) | | (4.1 | ) | | — |
| | Cost of goods sold and operating expenses | | (17.7 | ) | | (1.9 | ) | | — |
|
Treasury Locks | — |
| | — |
| | (1.3 | ) | | Other non-operating income (expense) | | (0.1 | ) | | (0.1 | ) | | — |
|
Total | $ | (28.2 | ) | | $ | (51.7 | ) | | $ | 25.6 |
| | | | $ | (31.0 | ) | | $ | (22.1 | ) | | $ | 18.1 |
|
Derivatives Not Designated as Hedging Instruments
Foreign Exchange Contracts
During the fourth quarter of 2014, we discontinued hedge accounting for Canadian foreign currency exchange contracts for all outstanding contracts associated with Bloom Lake operations as projected future cash flows were no longer considered probable or reasonably possible, but we continued to hold these instruments as economic hedges to manage currency risk. Subsequent to de-designation, no further foreign currency exchange contracts were entered into for the Bloom Lake operations. As of December 31, 2014,the de-designated outstanding foreign exchange rate contracts had a notional amount of $183.0 million in the form of forward contracts with varying maturity dates ranging from January 2015 to September 2015.
The amounts that were previously recorded as a component of Accumulated other comprehensive loss prior to de-designation and remaining in Accumulated other comprehensive loss as of December 31, 2014 were reclassified to earnings upon the de-designation of the hedges as the hedges would not be effective prospectively due to the projected future cash flows associated with the hedges no longer being considered probable or reasonably possible. We reclassified losses of $7.3 million from Accumulated other comprehensive loss related to contracts that had not matured during the year, and recorded the amounts as Cost of goods sold and operating expenses on the Statements of Consolidated Operations. A corresponding realized gain or loss will be recognized in each period until settlement of the related economic hedge in 2015. Additionally, for the year ended December 31, 2014, prior to the de-designation of the Bloom Lake hedges, we reclassified losses of $9.9 million from Accumulated other comprehensive loss related to contracts that matured during the year, and recorded the amounts as Cost of goods sold and operating expenses on the Statements of Consolidated Operations. As of December 31, 2014, no gains or losses remain in Accumulated other comprehensive loss related to the Bloom Lake effective cash flow hedge contracts prior to de-designation.
During the fourth quarter of 2013, we discontinued hedge accounting for Canadian foreign currency exchange contracts for all outstanding contracts associated with Wabush and Ferroalloys operations as projected future cash flows were no longer considered probable, but we continued to hold these instruments as economic hedges to manage currency risk. Subsequent to de-designation, no further foreign currency exchange contracts were entered into for the Wabush operation or the Ferroalloys operations. As of December 31, 2014, there were no outstanding de-designated foreign currency exchange rate contracts associated with the Wabush and Ferroalloys operations as all remaining de-designated foreign exchange contracts matured during the second quarter of 2014. This compares with outstanding de-designated foreign currency exchange contracts with a notional amount of $74.8 million as of December 31, 2013.
As a result of discontinued hedge accounting, the Wabush and Ferroalloys instruments were prospectively marked to fair value each reporting period through Cost of goods sold and operating expenses on the Statements of Consolidated Operations. For the years ended December 31, 2014, and 2013, the change in fair value of our de-designated foreign currency exchange contracts resulted in net losses of $3.3 million and $0.6 million, respectively. The amounts that were previously recorded as a component of Accumulated other comprehensive loss prior to de-designation were reclassified to earnings and a corresponding realized gain or loss was recognized when the forecasted cash flow occurred. For the years ended December 31, 2014, and 2013, we reclassified losses of $0.5 million and $1.9 million, respectively from Accumulated other comprehensive loss related to contracts that matured during the year, and recorded the amounts as Cost of goods sold and operating expenses on the Statements of Consolidated Operations. All the remaining contracts matured during the second quarter of 2014 and as of the period ended June 30, 2014, no gains or losses remained in Accumulated other comprehensive loss related to the effective cash flow hedge contracts prior to de-designation.
Fair Value Hedges
Interest Rate Hedges
Our fixed-to-variable interest rate swap derivative instruments, with a notional amount of $250.0 million, were de-designated and settled during August 2014. Prior to settlement, the derivatives were designated and qualified as fair value hedges. The objective of the hedges was to offset changes in the fair value of our debt instruments associated with fluctuations in the benchmark LIBOR interest rate as part of our risk management strategy.
Prior to de-designation and settlement, when the interest rate swap derivative instruments were designated and qualified as fair-value hedges, the gain or loss on the hedge instrument as well as the offsetting loss or gain on the hedged item attributable to the hedged risk were recognized in net income. We included the gain or loss on the derivative instrument and the offsetting loss or gain on the hedged item in Other non-operating income (expense). The net gains recognized in Other non-operating income (expense) for the year ended December 31, 2014 were $0.3 million.
For the year ended December 31, 2013, the fixed-to-variable interest rate swap derivative instruments were designated and qualified as fair-value hedges. The gain or loss on the hedge instrument as well as the offsetting loss or gain on the hedged item attributable to the hedged risk was recognized in net income. We included the gain or loss on the derivative instrument and the offsetting loss or gain on the hedged item in Other non-operating income (expense). The net gain recognized in Other non-operating income (expense) for year ended December 31, 2013 was $0.1 million.
Customer Supply Agreements
Most of our U.S. Iron Ore long-term supply agreements are comprised of a base price with annual price adjustment factors. The base price is the primary component of the purchase price for each contract. The indexed price adjustment factors are integral to the iron ore supply contracts and vary based on the agreement, but typically include adjustments based upon changes in the Platts 62 percent Fe fines spot price and/or international pellet prices and changes in specified Producer Price Indices, including those for all commodities, industrial commodities, energy and steel. The pricing adjustments generally operate in the same manner, with each factor typically comprising a portion of the price adjustment, although the weighting of each factor varies based upon the specific terms of each agreement. In most cases, these adjustment factors have not been finalized at the time our product is sold. In these cases, we historically have estimated the adjustment factors at each reporting period based upon the best third-party information available. The estimates are then adjusted to actual when the information has been finalized. The price adjustment factors have been evaluated to determine if they contain embedded derivatives. The price adjustment factors share the same economic characteristics and risks as the host contract and are integral to the host contract as inflation adjustments; accordingly, they have not been separately valued as derivative instruments.
A certain supply agreement with one U.S. Iron Ore customer provides for supplemental revenue or refunds to the customer based on the customer’s average annual steel pricing at the time the product is consumed in the customer’s blast furnace. The supplemental pricing is characterized as a freestanding derivative and is required to be accounted for separately once the product is shipped. The derivative instrument, which is finalized based on a future price, is adjusted to fair value as a revenue adjustment each reporting period until the pellets are consumed and the amounts are settled.
We recognized $187.8 million, $149.2 million and $171.4 million as Product revenues in the Statements of Consolidated Operations for the years ended December 31, 2014, 2013 and 2012, respectively, related to the supplemental payments. Other current assets, representing the fair value of the pricing factors, were $63.2 million and $55.8 million in the December 31, 2014 and December 31, 2013 Statements of Consolidated Financial Position, respectively.
Provisional Pricing Arrangements
Certain of our U.S. Iron Ore, Asia Pacific Iron Ore and Eastern Canadian Iron Ore customer supply agreements specify provisional price calculations, where the pricing mechanisms generally are based on market pricing, with the final revenue rate to be based on market inputs at a specified period in time in the future, per the terms of the supply agreements. The difference between the provisionally agreed-upon price and the estimated final revenue rate is characterized as a freestanding derivative and is required to be accounted for separately once the provisional revenue has been recognized. The derivative instrument is adjusted to fair value through Product revenues each reporting period based upon current market data and forward-looking estimates provided by management until the final revenue rate is determined. At December 31, 2014 we had no Other current assets recorded in the Statements of Consolidated Financial Position related to our estimate of the final revenue rate with any of our customers. At December 31, 2013, we recorded $3.1 million as Other current assets in the Statements of Consolidated Financial Position related to our estimate of final revenue rate with our U.S. Iron Ore, Asia Pacific Iron Ore and Eastern Canadian Iron Ore customers. At December 31, 2014 and December 31, 2013, we recorded $11.8 million and $10.3 million, respectively, as Other current liabilities in the Statements of Consolidated Financial Position related to our estimate of final revenue rate with our U.S. Iron Ore, Asia Pacific Iron Ore and Eastern Canadian Iron Ore customers. These amounts represent the difference between the provisional price agreed upon with our customers based on the supply agreement terms and our estimate of the final revenue rate based on the price calculations established in the supply agreements. As a result, we recognized a net $11.8 million decrease in Product revenues in the Statements of Consolidated Operations for the year ended December 31, 2014 related to these arrangements. This compares with a net $7.2 million decrease and a net $7.8 million decrease in Product revenues for the comparable periods in 2013 and 2012.
The following summarizes the effect of our derivatives that are not designated as hedging instruments in the Statements of Consolidated Operations for the years ended December 31, 2014, 2013 and 2012:
|
| | | | | | | | | | | | |
(In Millions) |
Derivatives Not Designated as Hedging Instruments | Location of Gain (Loss) Recognized in Income on Derivative | Amount of Gain/(Loss) Recognized in Income on Derivative |
| | Year Ended
December 31, |
| | 2014 | | 2013 | | 2012 |
Foreign Exchange Contracts | Cost of goods sold and operating expenses | $ | (16.9 | ) | | $ | (0.6 | ) | | $ | — |
|
Foreign Exchange Contracts | Other income (expense) | — |
| | — |
| | 0.3 |
|
Foreign Exchange Contracts | Income and Gain on Sale from Discontinued Operations, net of tax | — |
| | — |
| | (0.3 | ) |
Treasury Locks | Other non-operating income (expense) | — |
| | — |
| | (0.4 | ) |
Customer Supply Agreements | Product revenues | 187.8 |
| | 149.2 |
| | 171.4 |
|
Provisional Pricing Arrangements | Product revenues | (11.8 | ) | | (7.2 | ) | | (7.8 | ) |
Total | | $ | 159.1 |
| | $ | 141.4 |
| | $ | 163.2 |
|
Refer to NOTE 6 - FAIR VALUE OF FINANCIAL INSTRUMENTS for additional information.
NOTE 14 - DISCONTINUED OPERATIONS
In April 2014, the FASB issued ASU 2014-08, Reporting Discontinued Operations and Disclosures of Disposals of Components of an Entity, which changes the criteria for reporting discontinued operations and requires additional disclosures about discontinued operations. The standard requires that an entity report as a discontinued operation only a disposal that represents a strategic shift in operations that has a major effect on its operations and financial results. ASU 2014-08 is effective prospectively for new disposals that occur within annual periods beginning on or after December 15, 2014. Early adoption is permitted and we adopted ASU 2014-08 during the three months ended December 31, 2014. Adoption of the standard had a material impact on our Statements of Consolidated Operations.
The Wabush mine was idled by the end of the first quarter of 2014 and we subsequently began to commence permanent closure during the fourth quarter of 2014. As part of these closure activities, we terminated the rail transportation agreement and began implementation of the provincial Rehabilitation and Closure Plan that has been approved by the Canadian Department of Natural Resources. As such, the Wabush mine was deemed abandoned as of December 31, 2014 and meets the disposed by other than sale criteria.
On December 31, 2014, we completed the sale of our CLCC assets in West Virginia to Coronado Coal II, LLC, an affiliate of Coronado Coal LLC, for $174.0 million in cash and the assumption of certain liabilities, of which $155.0 million has been collected as of December 31, 2014. We recorded the results of this sale in our fourth quarter earnings as the transaction closed on December 31, 2014. As such, CLCC as of December 31, 2014, meets the disposed of by sale criteria.
As Wabush and CLCC met criteria for discontinued operations, each disposal had to be further evaluated to determine whether the disposal represents a strategic shift that has (or will have) a major effect on our operations and financial results. Wabush and CLCC meet the criteria for discontinued operations as Wabush's closure plan was implemented and CLCC was sold. According to ASU 2014-08, examples of a strategic shift that has (or will have) a major effect on an entity’s operations and financial results could include a disposal of a major geographical area, a major line of business, a major equity method investment, or other major parts of an entity. In order to determine if the disposal of CLCC or Wabush had a major effect on our operations and financial results, we used revenues and assets as a key indicator of significance as those are historically key indicators we have used to measure our components against. For both Wabush and CLCC, the associated revenues and assets were determined not to be a significant percentage of our consolidated results as evidenced by the years ended December 31, 2014, 2013 and 2012. Wabush revenues were less than 8 percent of consolidated revenues and less than 4 percent of total assets for the years ended December 31, 2014, 2013 and 2012. CLCC revenues were less than 5 percent of consolidated revenues and less than 8 percent of total assets for the years ended December 31, 2014, 2013 and 2012.
Other key indicators such as sales margin, EBITDA and adjusted EBITDA are not relevant for Wabush as Wabush was idled in the first quarter of 2014 and therefore not operational for the majority of 2014. These other key indicators were also not relevant for CLCC as the coal business makes up a small percentage of our overall financial results, approximately 15 percent of consolidated revenues in 2014, as compared to our iron ore business.
After assessing Wabush and CLCC under the ASU 2014-08 guidance as discussed above, it was determined that Wabush and CLCC do not qualify as discontinued operations as of December 31, 2014. Neither Wabush nor CLCC represent a strategic shift that has or will have a major impact on our operations or financial results.
The amendments in this ASU 2014-08 require us to provide the Income (Loss) from Continuing Operations Before Income Taxes and Equity Income (Loss) from Ventures for each individually significant component of an entity that does not qualify for discontinued operations presentation in the financial statements. The Income (Loss) from Continuing Operations Before Income Taxes and Equity Income (Loss) from Ventures is to be presented for the component of an entity for the period in which it is disposed of or is classified as held for sale and for all prior periods that are presented in the Statements of Consolidated Operations. As required, the Income (Loss) from Continuing Operations Before Income Taxes and Equity Income (Loss) from Ventures for Wabush and CLCC are presented below:
|
| | | | | | | | | | | |
| (In Millions) |
| Year Ended December 31, |
| 2014 | | 2013 | | 2012 |
INCOME (LOSS) FROM CONTINUING OPERATIONS BEFORE INCOME TAXES AND EQUITY INCOME (LOSS) FROM VENTURES | | | | | |
Wabush | $ | (345.6 | ) | | $ | (258.6 | ) | | $ | (131.8 | ) |
CLCC | $ | (669.9 | ) | | $ | (55.0 | ) | | $ | (41.8 | ) |
The table below sets forth selected financial information related to operating results of our business classified as discontinued operations. While the reclassification of revenues and expenses related to discontinued operations for prior periods has no impact upon previously reported net income, the Statements of Consolidated Operations present the revenues and expenses that were reclassified from the specified line items to discontinued operations. During the fourth quarter of 2012, we sold our 45 percent economic interest in Sonoma. The Sonoma operations previously were included in Other within our reportable segments.
The following table presents detail of our operations related to our Sonoma operations in the Statements of Consolidated Operations:
|
| | | | | | | | | | | |
| (In Millions) |
| Year Ended December 31, |
| 2014 | | 2013 | | 2012 |
REVENUES FROM PRODUCT SALES AND SERVICES | | | | | |
Product | $ | — |
| | $ | — |
| | $ | 151.6 |
|
| | | | | |
GAIN ON SALE FROM DISCONTINUED OPERATIONS, net of tax | — |
| | — |
| | 38.0 |
|
INCOME (LOSS) FROM DISCONTINUED OPERATIONS, net of tax | — |
| | 2.0 |
| | (2.1 | ) |
INCOME and GAIN ON SALE FROM DISCONTINUED OPERATIONS, net of tax | $ | — |
| | $ | 2.0 |
| | $ | 35.9 |
|
Income and Gain on Sale from Discontinued Operations, net of tax during the year ended December 31, 2013 relates to additional income tax benefit resulting from the actual tax gain from the sale of Sonoma as included on the 2012 tax return, which was filed during the year ended December 31, 2013.
We recorded a gain of $38.0 million, net of $8.1 million in tax expense in Income and Gain on Sale from Discontinued Operations, net of tax in the Statements of Consolidated Operations for the year ended December 31, 2012 related to our sale of the Sonoma operations, which was completed as of November 12, 2012. We recorded a loss from discontinued operations in 2012 of $2.1 million, net of $2.4 million in tax expense.
NOTE 15 - CAPITAL STOCK
Depositary Shares
On February 21, 2013, we issued 29.25 million depositary shares, representing an aggregate of 731,250 preferred shares, comprised of the 27.0 million depositary share offering and the exercise of an underwriters' over-allotment option to purchase an additional 2.25 million depositary shares. Each depositary share represents a 1/40th interest in a share of our 7.00 percent Series A Mandatory Convertible Preferred Stock, Class A, without par value ("Preferred Share") at a price of $25 per depositary share for total net proceeds of approximately $709.4 million, after underwriter fees and discounts. Each Preferred Share has an initial liquidation preference of $1,000 per share (equivalent to a $25 liquidation preference per depositary share). When and if declared by our Board of Directors, we will pay cumulative dividends on each Preferred Share at an annual rate of 7.00 percent on the liquidation preference. We will pay declared dividends in cash on February 1, May 1, August 1 and November 1 of each year, commencing on May 1, 2013 and to, and including February 1, 2016. Holders of the depositary shares are entitled to a proportional fractional interest in the rights and preferences of the Preferred Shares, including conversion, dividend, liquidation and voting rights, subject to the provisions of the deposit agreement.
The Preferred Shares may be converted, at the option of the holder, at the minimum conversion rate of 28.1480 of our common shares (equivalent to 0.7037 of our common shares per depositary share) at any time prior to February 1, 2016 or other than during a fundamental change conversion period, subject to anti-dilution adjustments. If not converted prior to that time, each Preferred Share will convert automatically on February 1, 2016 into between 28.1480 and 34.4840 common shares, par value $0.125 per share, subject to anti-dilution adjustments. The number of common shares issuable on conversion will be determined based on the average VWAP per share of our common shares during the 20 trading day period beginning on, and including, the 23rd scheduled trading day prior to February 1, 2016, subject to customary anti-dilution adjustments. Upon conversion, a minimum of 20.6 million common shares and a maximum of 25.2 million common shares will be issued.
If certain fundamental changes involving the Company occur, holders of the Preferred Shares may convert their shares into a number of common shares at the conversion rate that will be adjusted under certain circumstances, and such holders also will be entitled to a fundamental change dividend make-whole amount. The Preferred Shares are not redeemable.
Common Share Public Offering
On February 21, 2013, we issued 10.35 million common shares, comprised of the 9.0 million common share offering and the exercise of an underwriters' option to purchase an additional 1.35 million common shares. We received net proceeds of approximately $285.3 million at a closing price of $29.00 per common share.
Dividends
On March 20, 2013, our Board of Directors declared a cash dividend of $13.6111 per Preferred Share, which is equivalent to approximately $0.34 per depositary share. The cash dividend was paid on May 1, 2013 to our shareholders of record as of the close of business on April 15, 2013. On May 7, 2013, September 9, 2013, and November 11, 2013, our Board of Directors declared a quarterly cash dividend of $17.50 per Preferred Share, which is equivalent to approximately $0.44 per depositary share. The cash dividend was paid on August 1, 2013, November 1, 2013 and February 3, 2014 to our shareholders of record as of the close of business on July 15, 2013, October 15, 2013 and January 15, 2014, respectively. On February 11, 2014, May 13, 2014, and September 8, 2014, our board of directors declared the quarterly cash dividend of $17.50 per Preferred Share, which is equivalent to approximately $0.44 per depositary share. The cash dividend was paid on May 1, 2014, August 1, 2014 and November 3, 2014, to our Preferred Shareholders of record as of the close of business on April 15, 2014, July 15, 2014, and October 15, 2014, respectively. On November 19, 2014, our Board of Directors declared the quarterly cash dividend of $17.50 per Preferred Share, which is equivalent to approximately $0.44 per depositary share. The cash dividend of $12.8 million was paid on February 2, 2015 to our shareholders of record as of the close of business on January 15, 2015.
On February 11, 2013, our Board of Directors approved a reduction to our quarterly cash dividend rate by 76 percent to $0.15 per share. Our Board of Directors took this step in order to improve the future cash flows available for investment in the Phase II expansion at Bloom Lake, as well as to preserve our investment-grade credit ratings. The decreased dividend of $0.15 per share was paid on March 1, 2013, June 3, 2013, September 3, 2013 and December 2, 2013 to our common shareholders of record as of the close of business on February 22, 2013, May 17, 2013, August 15, 2013 and November 22, 2013, respectively. Additionally, the cash dividend of $0.15 per share was paid on March 3, 2014, June 3, 2014, September 2, 2014 and December 1, 2014 to our common shareholders of record as of close of business on February 21, 2014, May 23, 2014, August 15, 2014 and November 15, 2014.
NOTE 16 - ACCUMULATED OTHER COMPREHENSIVE INCOME (LOSS)
The components of Accumulated other comprehensive income (loss) within Cliffs shareholders’ equity and related tax effects allocated to each are shown below as of December 31, 2014, 2013 and 2012:
|
| | | | | | | | | | | |
| (In Millions) |
| Pre-tax Amount | | Tax Benefit (Provision) | | After-tax Amount |
As of December 31, 2012: | | | | | |
Postretirement benefit liability | $ | (576.7 | ) | | $ | 194.0 |
| | $ | (382.7 | ) |
Foreign currency translation adjustments | 316.3 |
| | — |
| | 316.3 |
|
Unrealized net gain on derivative financial instruments | 12.4 |
| | (3.7 | ) | | 8.7 |
|
Unrealized gain on securities | 3.3 |
| | (1.2 | ) | | 2.1 |
|
| $ | (244.7 | ) | | $ | 189.1 |
| | $ | (55.6 | ) |
As of December 31, 2013: | | | | | |
Postretirement benefit liability | $ | (299.3 | ) | | $ | 94.4 |
| | $ | (204.9 | ) |
Foreign currency translation adjustments | 106.7 |
| | — |
| | 106.7 |
|
Unrealized net gain on derivative financial instruments | (30.0 | ) | | 9.1 |
| | (20.9 | ) |
Unrealized gain on securities | 9.3 |
| | (3.1 | ) | | 6.2 |
|
| $ | (213.3 | ) | | $ | 100.4 |
| | $ | (112.9 | ) |
As of December 31, 2014: | | | | | |
Postretirement benefit liability | $ | (425.3 | ) | | $ | 134.2 |
| | $ | (291.1 | ) |
Foreign currency translation adjustments | 64.4 |
| | — |
| | 64.4 |
|
Unrealized net loss on derivative financial instruments | (25.9 | ) | | 7.8 |
| | (18.1 | ) |
Unrealized gain on securities | (1.3 | ) | | 0.3 |
| | (1.0 | ) |
| $ | (388.1 | ) | | $ | 142.3 |
| | $ | (245.8 | ) |
The following tables reflect the changes in Accumulated other comprehensive income (loss) related to Cliffs shareholders’ equity for December 31, 2014, 2013 and 2012:
|
| | | | | | | | | | | | | | | | | | | |
| (In Millions) |
| Postretirement Benefit Liability, net of tax | | Unrealized Net Gain (Loss) on Securities, net of tax | | Unrealized Net Gain (Loss) on Foreign Currency Translation | | Net Unrealized Gain (Loss) on Derivative Financial Instruments, net of tax | | Accumulated Other Comprehensive Income (Loss) |
Balance December 31, 2013 | $ | (204.9 | ) | | $ | 6.2 |
| | $ | 106.7 |
| | $ | (20.9 | ) | | $ | (112.9 | ) |
Other comprehensive income (loss) before reclassifications | (0.4 | ) | | 3.8 |
| | 40.5 |
| | (2.3 | ) | | 41.6 |
|
Net loss (gain) reclassified from accumulated other comprehensive income (loss) | 3.3 |
| | 0.1 |
| | — |
| | 12.8 |
| | 16.2 |
|
Balance March 31, 2014 | $ | (202.0 | ) | | $ | 10.1 |
| | $ | 147.2 |
| | $ | (10.4 | ) | | $ | (55.1 | ) |
Other comprehensive loss before reclassifications | (1.4 | ) | | (2.4 | ) | | 19.7 |
| | 9.7 |
| | 25.6 |
|
Net loss (gain) reclassified from accumulated other comprehensive income (loss) | 4.0 |
| | (1.3 | ) | | — |
| | 6.6 |
| | 9.3 |
|
Balance June 30, 2014 | $ | (199.4 | ) | | $ | 6.4 |
| | $ | 166.9 |
| | $ | 5.9 |
| | $ | (20.2 | ) |
Other comprehensive income (loss) before reclassifications | 3.5 |
| | 1.3 |
| | (65.9 | ) | | (20.0 | ) | | (81.1 | ) |
Net loss (gain) reclassified from accumulated other comprehensive income (loss) | 7.6 |
| | (7.1 | ) | | — |
| | (0.6 | ) | | (0.1 | ) |
Balance September 30, 2014 | $ | (188.3 | ) | | $ | 0.6 |
| | $ | 101.0 |
| | $ | (14.7 | ) | | $ | (101.4 | ) |
Other comprehensive income (loss) before reclassifications | $ | (98.7 | ) | | $ | (1.4 | ) | | $ | (36.6 | ) | | $ | (15.6 | ) | | $ | (152.3 | ) |
Net loss (gain) reclassified from accumulated other comprehensive income (loss) | $ | (4.1 | ) | | $ | (0.2 | ) | | $ | — |
| | $ | 12.2 |
| | $ | 7.9 |
|
Balance December 31, 2014 | $ | (291.1 | ) | | $ | (1.0 | ) | | $ | 64.4 |
| | $ | (18.1 | ) | | $ | (245.8 | ) |
|
| | | | | | | | | | | | | | | | | | | |
| (In Millions) |
| Postretirement Benefit Liability, net of tax | | Unrealized Net Gain (Loss) on Securities, net of tax | | Unrealized Net Gain (Loss) on Foreign Currency Translation | | Net Unrealized Gain (Loss) on Derivative Financial Instruments, net of tax | | Accumulated Other Comprehensive Income (Loss) |
Balance December 31, 2012 | $ | (382.7 | ) | | $ | 2.1 |
| | $ | 316.3 |
| | $ | 8.7 |
| | $ | (55.6 | ) |
Other comprehensive income (loss) before reclassifications | (1.1 | ) | | 2.5 |
| | 3.3 |
| | (5.0 | ) | | (0.3 | ) |
Net loss (gain) reclassified from accumulated other comprehensive income (loss) | 6.4 |
| | 0.1 |
| | — |
| | (2.0 | ) | | 4.5 |
|
Balance March 31, 2013 | $ | (377.4 | ) | | $ | 4.7 |
| | $ | 319.6 |
| | $ | 1.7 |
| | $ | (51.4 | ) |
Other comprehensive loss before reclassifications | (1.5 | ) | | (2.0 | ) | | (152.0 | ) | | (42.2 | ) | | (197.7 | ) |
Net loss (gain) reclassified from accumulated other comprehensive income (loss) | 8.1 |
| | 3.6 |
| | — |
| | (2.2 | ) | | 9.5 |
|
Balance June 30, 2013 | $ | (370.8 | ) | | $ | 6.3 |
| | $ | 167.6 |
| | $ | (42.7 | ) | | $ | (239.6 | ) |
Other comprehensive income (loss) before reclassifications | (0.6 | ) | | 3.5 |
| | 22.8 |
| | 12.1 |
| | 37.8 |
|
Net loss (gain) reclassified from accumulated other comprehensive income (loss) | 6.3 |
| | 0.9 |
| | — |
| | 16.2 |
| | 23.4 |
|
Balance September 30, 2013 | $ | (365.1 | ) | | $ | 10.7 |
| | $ | 190.4 |
| | $ | (14.4 | ) | | $ | (178.4 | ) |
Other comprehensive income (loss) before reclassifications | $ | 154.5 |
| | $ | (4.9 | ) | | $ | (83.7 | ) | | $ | (16.6 | ) | | $ | 49.3 |
|
Net loss (gain) reclassified from accumulated other comprehensive income (loss) | $ | 5.7 |
| | $ | 0.4 |
| | $ | — |
| | $ | 10.1 |
| | $ | 16.2 |
|
Balance December 31, 2013 | $ | (204.9 | ) | | $ | 6.2 |
| | $ | 106.7 |
| | $ | (20.9 | ) | | $ | (112.9 | ) |
|
| | | | | | | | | | | | | | | | | | | |
| (In Millions) |
| Postretirement Benefit Liability, net of tax | | Unrealized Net Gain (Loss) on Securities, net of tax | | Unrealized Net Gain on Foreign Currency Translation | | Net Unrealized Gain on Derivative Financial Instruments, net of tax | | Accumulated Other Comprehensive Income (Loss) |
Balance December 31, 2011 | $ | (408.9 | ) | | $ | 2.6 |
| | $ | 312.5 |
| | $ | 1.2 |
| | $ | (92.6 | ) |
Change during 2012 | 26.2 |
| | (0.5 | ) | | 3.8 |
| | 7.5 |
| | 37.0 |
|
Balance December 31, 2012 | $ | (382.7 | ) | | $ | 2.1 |
| | $ | 316.3 |
| | $ | 8.7 |
| | $ | (55.6 | ) |
The following table reflects the details about Accumulated other comprehensive income (loss) components related to Cliffs shareholders’ equity for the year ended December 31, 2014:
|
| | | | | | | | | | |
| | (In Millions) | | |
Details about Accumulated Other Comprehensive Income (Loss) Components | | Amount of (Gain)/Loss Reclassified into Income | | Affected Line Item in the Statement of Unaudited Condensed Consolidated Operations |
| | Year Ended
December 31, 2014 | | Year Ended December 31, 2013 | | |
Amortization of Pension and Postretirement Benefit Liability: | | | | | | |
Prior service costs | | $ | (0.9 | ) | | $ | (0.6 | ) | | (1) |
Net actuarial loss | | 19.1 |
| | 41.4 |
| | (1) |
Curtailments/Settlements | | (5.0 | ) | | — |
| | (1) |
Special termination benefits | | 3.4 |
| | — |
| | (1) |
| | 16.6 |
| | 40.8 |
| | Total before taxes |
| | (5.8 | ) | | (14.3 | ) | | Income tax benefit (expense) |
| | $ | 10.8 |
| | $ | 26.5 |
| | Net of taxes |
| | | | | | |
Unrealized gain (loss) on marketable securities: | | | | | | |
Sale of marketable securities | | $ | (11.4 | ) | | $ | (0.2 | ) | | Other non-operating income (expense) |
Impairment | | (0.5 | ) | | 5.3 |
| | Other non-operating income (expense) |
| | (11.9 | ) | | 5.1 |
| | Total before taxes |
| | 3.4 |
| | (0.1 | ) | | Income tax benefit (expense) |
| | $ | (8.5 | ) | | $ | 5.0 |
| | Net of taxes |
| | | | | | |
Unrealized gain (loss) on derivative financial instruments: | | | | | | |
Australian dollar foreign exchange contracts | | $ | 18.9 |
| | $ | 17.0 |
| | Product revenues |
Canadian dollar foreign exchange contracts | | 26.7 |
| | 15.3 |
| | Cost of goods sold and operating expenses |
| | 45.6 |
| | 32.3 |
| | Total before taxes |
| | (14.6 | ) | | (10.2 | ) | | Income tax benefit (expense) |
| | $ | 31.0 |
| | $ | 22.1 |
| | Net of taxes |
| | | | | | |
Total Reclassifications for the Period | | $ | 33.3 |
| | $ | 53.6 |
| | |
| |
(1) | These accumulated other comprehensive income components are included in the net periodic benefit cost recognized for the year ended December 31, 2014 and 2013. See NOTE 7 - PENSIONS AND OTHER POSTRETIREMENT BENEFITS for further information. |
NOTE 17 - CASH FLOW INFORMATION
A reconciliation of capital additions to cash paid for capital expenditures for the years ended December 31, 2014, 2013 and 2012 is as follows:
|
| | | | | | | | | | | |
| (In Millions) |
| Year Ended December 31, |
| 2014 | | 2013 | | 2012 |
Capital additions | $ | 235.5 |
| | $ | 752.3 |
| | $ | 1,335.3 |
|
Cash paid for capital expenditures | 284.1 |
| | 861.6 |
| | 1,127.5 |
|
Difference | $ | (48.6 | ) | | $ | (109.3 | ) | | $ | 207.8 |
|
Non-cash accruals | $ | (58.5 | ) | | $ | (109.3 | ) | | $ | 152.5 |
|
Capital leases | 9.9 |
| | — |
| | 55.3 |
|
Total | $ | (48.6 | ) | | $ | (109.3 | ) | | $ | 207.8 |
|
Cash payments for interest and income taxes in 2014, 2013 and 2012 are as follows:
|
| | | | | | | | | | | |
| (In Millions) |
2014 | | 2013 | | 2012 |
Taxes paid on income | $ | 47.3 |
| | $ | 153.3 |
| | $ | 443.2 |
|
Interest paid on debt obligations | 176.5 |
| | 174.4 |
| | 207.5 |
|
Non-Cash Financing Activities - Declared Dividends
On November 19, 2014, our Board of Directors declared the quarterly cash dividend on our Preferred Shares of $17.50 per share, which is equivalent to approximately $0.44 per depositary share, each representing 1/40th of a Preferred Share. The cash dividend of $12.8 million was paid on February 2, 2015 to our preferred shareholders of record as of the close of business on January 15, 2015.
NOTE 18 - RELATED PARTIES
Three of our five U.S. iron ore mines and one of our two Eastern Canadian iron ore mines are owned with various joint venture partners that are integrated steel producers or their subsidiaries. We are the manager of each of the mines we co-own and rely on our joint venture partners to make their required capital contributions and to pay for their share of the iron ore pellets and concentrate that we produce. The joint venture partners are also our customers. The following is a summary of the mine ownership of these iron ore mines at December 31, 2014:
|
| | | | | | | | | | | | |
Mine | | Cliffs Natural Resources | | ArcelorMittal | | U.S. Steel Canada | | WISCO |
Empire | | 79.0 | % | | 21.0 | % | | — |
| | — |
|
Tilden | | 85.0 | % | | — |
| | 15.0 | % | | — |
|
Hibbing | | 23.0 | % | | 62.3 | % | | 14.7 | % | | — |
|
Bloom Lake | | 82.8 | % | | — |
| | — |
| | 17.2 | % |
ArcelorMittal has a unilateral right to put its interest in the Empire mine to us, but has not exercised this right to date.
Product revenues from related parties were as follows:
|
| | | | | | | | | | | |
| (In Millions) |
| Year Ended December 31, |
| 2014 | | 2013 | | 2012 |
Product revenues from related parties | $ | 1,378.7 |
| | $ | 1,664.8 |
| | $ | 1,660.8 |
|
Total product revenues | 4,230.8 |
| | 5,346.6 |
| | 5,520.9 |
|
Related party product revenue as a percent of total product revenue | 32.6 | % | | 31.1 | % | | 30.1 | % |
Amounts due from related parties recorded in Accounts receivable, net and Other current assets, including customer supply agreements and provisional pricing arrangements, were $151.1 million and $132.0 million at December 31, 2014 and 2013, respectively. Amounts due to related parties recorded in Other current liabilities, including provisional pricing arrangements and liabilities to related parties, were $13.6 million and $25.1 million at December 31, 2014 and 2013, respectively.
Supply agreements with one of our customers include provisions for supplemental revenue or refunds based on the customer’s annual steel pricing for the year the product is consumed in the customer’s blast furnace. The supplemental pricing is characterized as an embedded derivative. Refer to NOTE 13 - DERIVATIVE INSTRUMENTS AND HEDGING ACTIVITIES for further information.
NOTE 19 - EARNINGS PER SHARE
The following table summarizes the computation of basic and diluted earnings per share attributable to Cliffs shareholders:
|
| | | | | | | | | | | |
| (In Millions, Except Per Share Amounts) |
| Year Ended December 31, |
| 2014 | | 2013 | | 2012 |
Net Income (Loss) from Continuing Operations
attributable to Cliffs shareholders | $ | (7,224.2 | ) | | $ | 411.5 |
| | $ | (935.3 | ) |
Income (Loss) and Gain on Sale from Discontinued Operations, net of tax | — |
| | 2.0 |
| | 35.9 |
|
NET INCOME (LOSS) ATTRIBUTABLE TO CLIFFS SHAREHOLDERS | $ | (7,224.2 | ) | | $ | 413.5 |
| | $ | (899.4 | ) |
PREFERRED STOCK DIVIDENDS | (51.2 | ) | | (48.7 | ) | | — |
|
NET INCOME (LOSS) ATTRIBUTABLE TO CLIFFS COMMON SHAREHOLDERS | $ | (7,275.4 | ) | | $ | 364.8 |
| | $ | (899.4 | ) |
Weighted Average Number of Shares: | | | | | |
Basic | 153.1 |
| | 151.7 |
| | 142.4 |
|
Depositary Shares | — |
| | 0.5 |
| | — |
|
Employee Stock Plans | — |
| | 22.1 |
| | — |
|
Diluted | 153.1 |
| | 174.3 |
| | 142.4 |
|
Earnings (loss) per Common Share Attributable to
Cliffs Common Shareholders - Basic: | | | | | |
Continuing operations | $ | (47.52 | ) | | $ | 2.39 |
| | $ | (6.57 | ) |
Discontinued operations | — |
| | 0.01 |
| | 0.25 |
|
| $ | (47.52 | ) | | $ | 2.40 |
| | $ | (6.32 | ) |
Earnings (loss) per Common Share Attributable to
Cliffs Common Shareholders - Diluted: | | | | | |
Continuing operations | $ | (47.52 | ) | | $ | 2.36 |
| | $ | (6.57 | ) |
Discontinued operations | — |
| | 0.01 |
| | 0.25 |
|
| $ | (47.52 | ) | | $ | 2.37 |
| | $ | (6.32 | ) |
The diluted earnings per share calculation excludes 25.2 million depositary shares that were anti-dilutive for the year ended December 31, 2014. Additionally, the diluted earnings per share calculation excludes 0.7 million shares for the year ended December 31, 2014 related to equity plan awards that were anti-dilutive. There was no anti-dilution for the year ended December 31, 2013. For the year ended December 31, 2012, the diluted earnings per share calculation excludes 0.5 million shares related to equity plan awards that were anti-dilutive.
NOTE 20 - COMMITMENTS AND CONTINGENCIES
Contingencies
Litigation
We are currently a party to various claims and legal proceedings incidental to our operations. If management believes that a loss arising from these matters is probable and can reasonably be estimated, we record the amount of the loss, or the minimum estimated liability when the loss is estimated using a range, and no point within the range is more probable than another. As additional information becomes available, any potential liability related to these matters is assessed and the estimates are revised, if necessary. Based on currently available information, management believes that the ultimate outcome of these matters, individually and in the aggregate, will not have a material effect on our financial position, results of operations or cash flows. However, litigation is subject to inherent uncertainties, and unfavorable rulings could occur. An unfavorable ruling could include monetary damages, additional funding requirements or an injunction. If an unfavorable ruling were to occur, there exists the possibility of a material impact on the financial position and results of operations of the period in which the ruling occurs, or future periods. However, we believe that any pending litigation will not result in a material liability in relation to our consolidated financial statements.
Environmental Matters
We had environmental liabilities of $5.5 million and $8.4 million at December 31, 2014 and 2013, respectively, including obligations for known environmental remediation exposures at active and closed mining operations and other sites. These amounts have been recognized based on the estimated cost of investigation and remediation at each site, and include site studies, design and implementation of remediation plans, legal and consulting fees, and post-remediation monitoring and related activities. If the cost can only be estimated as a range of possible amounts with no specific amount being more likely, the minimum of the range is accrued. Future expenditures are not discounted unless the amount and timing of the cash disbursements are readily known. Potential insurance recoveries have not been reflected. Additional environmental obligations could be incurred, the extent of which cannot be assessed. The amount of our ultimate liability with respect to these matters may be affected by several uncertainties, primarily the ultimate cost of required remediation and the extent to which other responsible parties contribute. Refer to NOTE 11 - ENVIRONMENTAL AND MINE CLOSURE OBLIGATIONS for further information.
Tax Matters
The calculation of our tax liabilities involves dealing with uncertainties in the application of complex tax regulations. We recognize liabilities for anticipated tax audit issues based on our estimate of whether, and the extent to which, additional taxes will be due. If we ultimately determine that payment of these amounts is unnecessary, we reverse the liability and recognize a tax benefit during the period in which we determine that the liability is no longer necessary. We also recognize tax benefits to the extent that it is more likely than not that our positions will be sustained when challenged by the taxing authorities. To the extent we prevail in matters for which liabilities have been established, or are required to pay amounts in excess of our liabilities, our effective tax rate in a given period could be materially affected. An unfavorable tax settlement would require use of our cash and result in an increase in our effective tax rate in the year of resolution. A favorable tax settlement would be recognized as a reduction in our effective tax rate in the year of resolution. Refer to NOTE 9 - INCOME TAXES for further information.
NOTE 21 - SUBSEQUENT EVENTS
Common Share Dividend
On January 26, 2015, we announced that our Board of Directors had decided to eliminate the quarterly dividend of $0.15 per share on our common shares. The decision is applicable to the first quarter of 2015 and all subsequent quarters. The elimination of the common share dividend provides us with additional free cash flow of approximately $92 million annually, which we intend to use for further debt reduction. We see accelerated debt reduction as a more effective means of protecting our shareholders than continuing to pay a common share dividend.
Credit Facility
On January 22, 2015, we amended the revolving credit agreement (Amendment No. 6) to effect the following:
| |
• | Reduces the size of the existing facility from $1.125 billion to $900 million at the closing of this amendment with a further reduction to $750 million on May 31, 2015. |
| |
• | Permits certain of our subsidiaries and joint ventures related to our Canadian operations (collectively, the "Canadian Entities") to enter into a restructuring (the "Canadian Restructuring"). |
| |
• | Permits costs and expenses incurred in connection with the Canadian Restructuring in an amount not to exceed $75 million to be added back to the calculation of EBITDA. |
| |
• | Adds limitations with respect to investments in the Canadian Entities after the Canadian Restructuring. |
| |
• | Adds limitations on the guaranty of indebtness of a Canadian Entity by us or our subsidiaries (other than by another Canadian Entity). |
| |
• | Permits additional liens on the assets of the Canadian Entities. |
| |
• | Reduces the permitted amount of quarterly dividends on our common shares to not more than $0.01 per share in any fiscal quarter. |
| |
• | Grants a security interest in our as-extracted collateral and certain of our subsidiaries. |
| |
• | Excludes certain indebtness and obligations of the Canadian Entities from the representations, covenants and events of default. |
The amended facility retains substantial financial flexibility for management to execute our strategy and provides us a consistent source of liquidity.
Bloom Lake Group CCAA Filing
As we have previously disclosed, despite our cost-cutting progress at our Bloom Lake mine, we concluded that Phase I alone would not be economically feasible based on our current operating plans and that the mine must be further developed to reduce the overall cash cost of operations. However, also as previously disclosed, we would only develop Phase II of the Bloom Lake mine if we were able to secure new equity partners to share in the capital costs, which we estimated to be approximately $1.2 billion. As the new equity partners were unable to commit within the short timeframe we required, we determined that the Phase II expansion of the Bloom Lake mine was no longer a viable option for us so we shifted our focus to considering available possibilities and executing an exit option for Eastern Canadian Iron Ore operations that minimized the cash outflows and associated liabilities. In December 2014, iron ore production at the Bloom Lake mine was suspended and the Bloom Lake mine was placed in ‘‘care-and-maintenance’’ mode.
On January 27, 2015, we announced that the Bloom Lake Group had commenced restructuring proceedings in Montreal, Québec, under the CCAA. The Bloom Lake Group comprises the Canadian affiliates which own and/or operate the Bloom Lake mine or are subsidiaries of such affiliates.
The decision by the Bloom Lake Group to seek protection under the CCAA was based on a thorough legal and financial analysis of the options available. The Bloom Lake Group was no longer generating any revenues and was not able to meet its obligations as they became due. The initial CCAA order obtained on January 27, 2015 addresses the Bloom Lake Group’s immediate liquidity issues by staying creditor claims and permits the Bloom Lake Group to preserve and protect its assets for the benefit of all stakeholders while restructuring and/or sale options are explored.
As part of the CCAA process, the Court has appointed FTI Consulting Canada Inc. as the Monitor. The Monitor’s role in the CCAA process is to monitor the activities of the Bloom Lake Group and provide assistance to the Bloom Lake Group and its stakeholders in respect of the CCAA process.
We also filed on February 2, 2015 a Current Report on Form 8-K that provides pro forma financial information reflecting the deconsolidation of the Bloom Lake Group. Additional information regarding the CCAA proceedings are available on the Monitor’s website at http://cfcanada.fticonsulting.com/bloomlake.
NOTE 22 - QUARTERLY RESULTS OF OPERATIONS (UNAUDITED)
The sum of quarterly EPS may not equal EPS for the year due to discrete quarterly calculations.
|
| | | | | | | | | | | | | | | | | | | |
| (In Millions, Except Per Share Amounts) |
2014 |
Quarters | | |
First | | Second | | Third | | Fourth | | Year |
Revenues from product sales and services | $ | 940.0 |
| | $ | 1,100.8 |
| | $ | 1,298.2 |
| | $ | 1,284.7 |
| | $ | 4,623.7 |
|
Sales margin | 63.2 |
| | 92.0 |
| | 127.5 |
| | 168.7 |
| | 451.4 |
|
Net Income (Loss) from Continuing Operations attributable to Cliffs shareholders | $ | (70.3 | ) | | $ | 10.9 |
| | $ | (5,879.6 | ) | | $ | (1,285.1 | ) | | $ | (7,224.2 | ) |
Income from Discontinued Operations | — |
| | — |
| | — |
| | — |
| | — |
|
Net Income (Loss) Attributable to Cliffs Shareholders | $ | (70.3 | ) | | $ | 10.9 |
| | $ | (5,879.6 | ) | | $ | (1,285.1 | ) | | $ | (7,224.2 | ) |
Preferred Stock Dividends | $ | (12.8 | ) | | $ | (12.8 | ) | | $ | (12.8 | ) | | $ | (12.8 | ) | | $ | (51.2 | ) |
Net Income (Loss) Attributable to Cliffs Common Shareholders | $ | (83.1 | ) | | $ | (1.9 | ) | | $ | (5,892.4 | ) | | $ | (1,297.9 | ) | | $ | (7,275.4 | ) |
Earnings per common share attributable to Cliffs common shareholders — Basic: |
| |
| |
| |
| |
|
Continuing Operations | $ | (0.54 | ) | | $ | (0.01 | ) | | $ | (38.49 | ) | | $ | (8.48 | ) | | $ | (47.52 | ) |
Discontinued Operations | — |
| | — |
| | — |
| | — |
| | — |
|
| $ | (0.54 | ) | | $ | (0.01 | ) | | $ | (38.49 | ) | | $ | (8.48 | ) | | $ | (47.52 | ) |
Earnings per common share attributable to Cliffs common shareholders — Diluted: |
| |
| |
| |
| | |
Continuing Operations | $ | (0.54 | ) | | $ | (0.01 | ) | | $ | (38.49 | ) | | $ | (8.48 | ) | | $ | (47.52 | ) |
Discontinued Operations | — |
| | — |
| | — |
| | — |
| | — |
|
| $ | (0.54 | ) | | $ | (0.01 | ) | | $ | (38.49 | ) | | $ | (8.48 | ) | | $ | (47.52 | ) |
The diluted earnings per share calculation for all quarters of 2014 exclude depositary shares that were anti-dilutive totaling 25.2 million million and equity plan awards ranging between 0.3 million and 0.8 million each quarter that were anti-dilutive.
|
| | | | | | | | | | | | | | | | | | | |
| 2013 |
Quarters | | |
First | | Second | | Third | | Fourth | | Year |
Revenues from product sales and services | $ | 1,140.5 |
| | $ | 1,488.5 |
| | $ | 1,546.6 |
| | $ | 1,515.8 |
| | $ | 5,691.4 |
|
Sales margin | 237.9 |
| | 268.2 |
| | 348.7 |
| | 294.5 |
| | 1,149.3 |
|
Net Income (Loss) from Continuing Operations attributable to Cliffs shareholders | $ | 107.0 |
| | $ | 146.0 |
| | $ | 115.2 |
| | $ | 43.3 |
| | $ | 411.5 |
|
Income (Loss) and Gain on Sale from Discontinued Operations, net of tax | — |
| | — |
| | 2.0 |
| | — |
| | 2.0 |
|
Net Income Attributable to Cliffs Shareholders | $ | 107.0 |
| | $ | 146.0 |
| | $ | 117.2 |
| | $ | 43.3 |
| | $ | 413.5 |
|
Earnings per common share attributable to Cliffs common shareholders — Basic: |
| |
| |
| |
| |
|
Continuing Operations | $ | 0.66 |
| | $ | 0.87 |
| | $ | 0.67 |
| | $ | 0.20 |
| | $ | 2.39 |
|
Discontinued Operations | — |
| | — |
| | 0.01 |
| | — |
| | 0.01 |
|
| $ | 0.66 |
| | $ | 0.87 |
| | $ | 0.68 |
| | $ | 0.20 |
| | $ | 2.40 |
|
Earnings per common share attributable to
Cliffs common shareholders — Diluted: |
| |
| |
| |
| |
|
Continuing Operations | $ | 0.66 |
| | $ | 0.82 |
| | $ | 0.65 |
| | $ | 0.20 |
| | $ | 2.36 |
|
Discontinued Operations | — |
| | — |
| | 0.01 |
| | — |
| | 0.01 |
|
| $ | 0.66 |
| | $ | 0.82 |
| | $ | 0.66 |
| | $ | 0.20 |
| | $ | 2.37 |
|
The diluted earnings per share calculation for the first and fourth quarters of 2013 exclude depositary shares that were anti-dilutive totaling 12.9 million and 25.2 million, respectively.
Fourth Quarter Results
During the fourth quarter of 2014, we recorded impairment charges of $1.3 billion primarily related to Bloom Lake and driven mainly by the changes in life-of-mine cash flows due to declining market pricing. Also, during the fourth quarter of 2014, we completed the sale of the CLCC assets for $174.0 million in cash and the assumption of certain liabilities, of which $155.0 million has been collected, and resulted in a loss on the sale of these assets of $419.6 million. The fourth quarter 2014 results additionally included an income tax benefit of $289.7 million, which includes the benefits related to the impairment charges as well as the recognition of a loss on a financial guaranty and the sale of CLCC assets.
Upon performing our annual goodwill impairment test in the fourth quarter of 2013, a goodwill impairment charge of $80.9 million million was recorded for our Cliffs Chromite Ontario and Cliffs Chromite Far North reporting units within our Ferroalloys operating segment. We also recorded an other long-lived asset impairment charge of $154.6 million related to our Wabush operations within our Eastern Canadian Iron Ore operating segment to reduce those assets to their estimated fair value as of December 31, 2013. All of these charges impacted Impairment of goodwill and other long-lived assets.
As discussed in NOTE 1 - BASIS OF PRESENTATION AND SIGNIFICANT ACCOUNTING POLICIES, we recorded an adjustment to correct an immaterial prior period error in the noncontrolling interest related to Bloom Lake. Accordingly, the adjustment was recorded prospectively in the Statements of Consolidated Operations for the period ended December 31, 2013 and in the Statements of Consolidated Financial Position as of December 31, 2013. The adjustment to noncontrolling interest related to Bloom Lake was approximately $45.1 million and resulted in an increase to Net Income (Loss) Attributable to Cliffs Shareholders and a reduction of Loss attributable to noncontrolling interest and corresponding decrease to Noncontrolling interest in the Statements of Consolidated Financial Position for the three months ended and year ended December 31, 2013. The adjustments also resulted in an increase to basic and diluted earnings per common share of $0.29 for the three months ended December 31, 2013.
Refer to NOTE 12 - GOODWILL AND OTHER INTANGIBLE ASSETS AND LIABILITIES, NOTE 4 - PROPERTY, PLANT AND EQUIPMENT and NOTE 9 - INCOME TAXES for further information.
REPORT OF INDEPENDENT REGISTERED PUBLIC ACCOUNTING FIRM
To the Board of Directors and Stockholders of
Cliffs Natural Resources Inc.
Cleveland, Ohio
We have audited the internal control over financial reporting of Cliffs Natural Resources Inc. and subsidiaries (the “Company”) as of December 31, 2014, based on criteria established in Internal Control - Integrated Framework (2013) issued by the Committee of Sponsoring Organizations of the Treadway Commission. The Company’s management is responsible for maintaining effective internal control over financial reporting and for its assessment of the effectiveness of internal control over financial reporting, included in the accompanying Management’s Report on Internal Control Over Financial Reporting. Our responsibility is to express an opinion on the Company’s internal control over financial reporting based on our audit.
We conducted our audit in accordance with the standards of the Public Company Accounting Oversight Board (United States). Those standards require that we plan and perform the audit to obtain reasonable assurance about whether effective internal control over financial reporting was maintained in all material respects. Our audit included obtaining an understanding of internal control over financial reporting, assessing the risk that a material weakness exists, testing and evaluating the design and operating effectiveness of internal control based on the assessed risk, and performing such other procedures as we considered necessary in the circumstances. We believe that our audit provides a reasonable basis for our opinion.
A company's internal control over financial reporting is a process designed by, or under the supervision of, the company's principal executive and principal financial officers, or persons performing similar functions, and effected by the company's board of directors, management, and other personnel to provide reasonable assurance regarding the reliability of financial reporting and the preparation of financial statements for external purposes in accordance with generally accepted accounting principles. A company's internal control over financial reporting includes those policies and procedures that (1) pertain to the maintenance of records that, in reasonable detail, accurately and fairly reflect the transactions and dispositions of the assets of the company; (2) provide reasonable assurance that transactions are recorded as necessary to permit preparation of financial statements in accordance with generally accepted accounting principles, and that receipts and expenditures of the company are being made only in accordance with authorizations of management and directors of the company; and (3) provide reasonable assurance regarding prevention or timely detection of unauthorized acquisition, use, or disposition of the company's assets that could have a material effect on the financial statements.
Because of the inherent limitations of internal control over financial reporting, including the possibility of collusion or improper management override of controls, material misstatements due to error or fraud may not be prevented or detected on a timely basis. Also, projections of any evaluation of the effectiveness of the internal control over financial reporting to future periods are subject to the risk that the controls may become inadequate because of changes in conditions, or that the degree of compliance with the policies or procedures may deteriorate.
In our opinion, the Company maintained, in all material respects, effective internal control over financial reporting as of December 31, 2014, based on the criteria established in Internal Control - Integrated Framework (2013) issued by the Committee of Sponsoring Organizations of the Treadway Commission.
We have also audited, in accordance with the standards of the Public Company Accounting Oversight Board (United States), the consolidated financial statements and financial statement schedule as of and for the year ended December 31, 2014 of the Company and our report dated February 25, 2015 expressed an unqualified opinion on those financial statements and financial statement schedule and included an explanatory paragraph regarding a change in accounting for discontinued operations.
/s/ Deloitte & Touche LLP
Cleveland, Ohio
February 25, 2015
REPORT OF INDEPENDENT REGISTERED PUBLIC ACCOUNTING FIRM
To the Board of Directors and Stockholders of
Cliffs Natural Resources Inc.
Cleveland, Ohio
We have audited the accompanying statements of consolidated financial position of Cliffs Natural Resources Inc. and subsidiaries (the "Company") as of December 31, 2014 and 2013, and the related statements of consolidated operations, comprehensive income (loss), cash flows, and changes in equity for each of the three years in the period ended December 31, 2014. Our audits also included the financial statement schedule listed in the Index at Item 15. These financial statements and financial statement schedule are the responsibility of the Company’s management. Our responsibility is to express an opinion on the financial statements and financial statement schedule based on our audits.
We conducted our audits in accordance with the standards of the Public Company Accounting Oversight Board (United States). Those standards require that we plan and perform the audit to obtain reasonable assurance about whether the financial statements are free of material misstatement. An audit includes examining, on a test basis, evidence supporting the amounts and disclosures in the financial statements. An audit also includes assessing the accounting principles used and significant estimates made by management, as well as evaluating the overall financial statement presentation. We believe that our audits provide a reasonable basis for our opinion.
In our opinion, such consolidated financial statements present fairly, in all material respects, the financial position of Cliffs Natural Resources Inc. and subsidiaries as of December 31, 2014 and 2013, and the results of their operations and their cash flows for each of the three years in the period ended December 31, 2014, in conformity with accounting principles generally accepted in the United States of America. Also, in our opinion, such financial statement schedule, when considered in relation to the basic consolidated financial statements taken as a whole, presents fairly, in all material respects, the information set forth therein.
As discussed in Note 1 to the consolidated financial statements, the Company has changed its method of accounting for discontinued operations in 2014 due to the adoption of Accounting Standards Update 2014-08, Reporting Discontinued Operations and Disclosures of Disposals of Components of an Entity.
We have also audited, in accordance with the standards of the Public Company Accounting Oversight Board (United States), the Company's internal control over financial reporting as of December 31, 2014, based on the criteria established in Internal Control - Integrated Framework (2013) issued by the Committee of Sponsoring Organizations of the Treadway Commission and our report dated February 25, 2015 expressed an unqualified opinion on the Company's internal control over financial reporting.
/s/ Deloitte & Touche LLP
Cleveland, Ohio
February 25, 2015
|
| |
Item 9. | Changes in and Disagreements With Accountants on Accounting and Financial Disclosure |
None.
|
| |
Item 9A. | Controls and Procedures |
We maintain disclosure controls and procedures that are designed to ensure that information required to be disclosed in our Exchange Act reports is recorded, processed, summarized and reported within the time periods specified in the SEC’s rules and forms, and that such information is accumulated and communicated to our management, including our President and Chief Executive Officer and Chief Financial Officer, as appropriate, to allow timely decisions regarding required disclosure based solely on the definition of “disclosure controls and procedures” in Rule 13a-15(e) promulgated under the Exchange Act. In designing and evaluating the disclosure controls and procedures, management recognized that any controls and procedures, no matter how well designed and operated, can provide only reasonable assurance of achieving the desired control objectives, and management necessarily was required to apply its judgment in evaluating the cost-benefit relationship of possible controls and procedures.
As of the end of the period covered by this report, we carried out an evaluation under the supervision and with the participation of our management, including our President and Chief Executive Officer and our Chief Financial Officer, of the effectiveness of the design and operation of our disclosure controls and procedures. Based on the foregoing, our President and Chief Executive Officer and Chief Financial Officer concluded that our disclosure controls and procedures were effective.
Management's Report on Internal Control Over Financial Reporting
Our management is responsible for establishing and maintaining adequate internal control over financial reporting as such term is defined under Rule 13a-15(f) promulgated under the Exchange Act.
Internal control over financial reporting is a process designed to provide reasonable assurance regarding the reliability of financial reporting and the preparation of the Company's consolidated financial statements for external purposes in accordance with generally accepted accounting principles.
Internal control over financial reporting includes those policies and procedures that (i) pertain to the maintenance of records that, in reasonable detail, accurately and fairly reflect the transactions and dispositions of the assets of the Company; (ii) provide reasonable assurance that transactions are recorded as necessary to permit the preparation of the consolidated financial statements in accordance with generally accepted accounting principles, and that receipts and expenditures of the Company are being made only in accordance with appropriate authorizations of management and directors of the Company; and (iii) provide reasonable assurance regarding prevention or timely detection of unauthorized acquisition, use or disposition of the Company's assets that could have a material effect on the consolidated financial statements.
Because of its inherent limitations, internal control over financial reporting may not prevent or detect misstatements. Also, projections of any evaluation of effectiveness to future periods are subject to the risk that controls may become inadequate because of changes in conditions, or that the degree of compliance with the policies or procedures may deteriorate.
Management conducted an assessment of the Company's internal control over financial reporting as of December 31, 2014 using the framework specified in Internal Control - Integrated Framework (2013), published by the Committee of Sponsoring Organizations of the Treadway Commission. Based on such assessment, management has concluded that the Company's internal control over financial reporting was effective as of December 31, 2014.
The effectiveness of the Company's internal control over financial reporting as of December 31, 2014 has been audited by Deloitte & Touche LLP, an independent registered public accounting firm, as stated in their report that appears herein.
February 25, 2015
Changes in Internal Control Over Financial Reporting
There have been no changes in our internal control over financial reporting or in other factors that occurred during our last fiscal quarter or our last fiscal year that have materially affected, or are reasonably likely to materially affect, our internal control over financial reporting.
|
| |
Item 9B. | Other Information |
None.
PART III
|
| |
Item 10. | Directors, Executive Officers and Corporate Governance |
The information required to be furnished by this Item will be set forth in our definitive proxy statement for the 2015 Annual Meeting of Shareholders (the "Proxy Statement") under the headings "Board Meetings and Committees - Audit Committee", "Business Ethics Policy", "Independence and Related Party Transactions", "Information Concerning Director Nominees” and “Section 16(a) Beneficial Ownership Reporting Compliance”, and is incorporated herein by reference and made a part hereof from the Proxy Statement. The information regarding executive officers required by this Item is set forth in Part I - Item 1. Business hereof under the heading “Executive Officers of the Registrant”, which information is incorporated herein by reference and made a part hereof.
|
| |
Item 11. | Executive Compensation |
The information required to be furnished by this Item will be set forth in our Proxy Statement under the headings “Director Compensation”, “Compensation Committee Report”, “Compensation Committee Interlocks and Insider Participation” and “Executive Compensation” and is incorporated herein by reference and made a part hereof from the Proxy Statement.
|
| |
Item 12. | Security Ownership of Certain Beneficial Owners and Management and Related Stockholder Matters |
The information required to be furnished by this Item regarding "Securities Authorized for Issuance Under Equity Compensation Plans", "Related Stockholder Matters" and "Security Ownership" will be set forth in the Proxy Statement under the headings "Independence and Related Party Transactions", "Ownership of Equity Securities of the Company" and "Equity Compensation Plan Information", respectively, and is incorporated herein by reference and made part hereof from the Proxy Statement.
|
| |
Item 13. | Certain Relationships and Related Transactions, and Director Independence |
The information required to be furnished by this Item will be set forth in the definitive Proxy Statement under the heading “Independence and Related Party Transactions” and is incorporated herein by reference and made a part hereof from the Proxy Statement.
|
| |
Item 14. | Principal Accountant Fees and Services |
The information required to be furnished by this Item will be set forth in the Proxy Statement under the heading “Ratification of Independent Registered Public Accounting Firm” and is incorporated herein by reference and made a part hereof from the Proxy Statement.
PART IV
|
| |
Item 15. | Exhibits and Financial Statement Schedules |
(a)(1) and (2) - List of Financial Statements and Financial Statement Schedules.
The following consolidated financial statements of Cliffs Natural Resources Inc. are included at Item 8. Financial Statements and Supplementary Data above:
•Statements of Consolidated Financial Position - December 31, 2014 and 2013
•Statements of Consolidated Operations - Years ended December 31, 2014, 2013 and 2012
•Statements of Consolidated Comprehensive Income - Years ended December 31, 2014, 2013 and 2012
•Statements of Consolidated Cash Flows - Years ended December 31, 2014, 2013 and 2012
•Statements of Consolidated Changes in Equity - Years ended December 31, 2014, 2013 and 2012
•Notes to Consolidated Financial Statements
The following consolidated financial statement schedule of Cliffs Natural Resources Inc. is included herein in Item 15(d) and attached as Exhibit 99(a):
Schedule II - Valuation and Qualifying Accounts
All other schedules for which provision is made in the applicable accounting regulation of the SEC are not required under the related instructions or are inapplicable, and therefore have been omitted.
(3) List of Exhibits - Refer to Exhibit Index on pages 190 - 197, which is incorporated herein by reference.
(c) Exhibits listed in Item 15(a)(3) above are incorporated herein by reference.
(d) The schedule listed above in Item 15(a)(1) and (2) is attached as Exhibit 99(a) and incorporated herein by reference.
SIGNATURES
Pursuant to the requirements of Section 13 or 15(d) of the Securities Exchange Act of 1934, the Registrant has duly caused this report to be signed on its behalf by the undersigned, thereunto duly authorized.
|
| | | | | | | |
| | | CLIFFS NATURAL RESOURCES INC. |
| | | | |
| | | By: | | /s/ Timothy K. Flanagan |
| | | | | Name: | | Timothy K. Flanagan |
| | | | | Title: | | Vice President, Corporate |
| | | | | | | Controller and Chief Accounting Officer |
Date: | February 25, 2015 | | | | | | |
Pursuant to the requirements of the Securities Exchange Act of 1934, this report has been signed below by the following persons on behalf of the Registrant and in the capacities and on the dates indicated. |
| | | | | |
Signatures | Title | Date |
| | |
/s/ C. L. Goncalves | Chairman, President, Chief | February 25, 2015 |
C. L. Goncalves | Executive Officer and Director | |
| (Principal Executive Officer) | |
/s/ T. M. Paradie | Executive Vice President | February 25, 2015 |
T. M. Paradie | & Chief Financial Officer | |
| (Principal Financial Officer) | |
/s/ T. K. Flanagan | Vice President, Corporate | February 25, 2015 |
T. K. Flanagan | Controller & Chief Accounting Officer | |
| (Principal Accounting Officer) | |
* | Director | February 25, 2015 |
J. T. Baldwin | | |
* | Director | February 25, 2015 |
R. P. Fisher, Jr. | | |
* | Director | February 25, 2015 |
S. M. Green | | |
* | Director | February 25, 2015 |
J. A. Rutkowski, Jr. | | |
* | Director | February 25, 2015 |
J. S. Sawyer | | |
* | Director | February 25, 2015 |
M. D. Siegal | | |
* | Director | February 25, 2015 |
G. Stoliar | | |
* | Director | February 25, 2015 |
D. C. Taylor | | |
* The undersigned, by signing his name hereto, does sign and execute this Annual Report on Form 10-K pursuant to a Power of Attorney executed on behalf of the above-indicated officers and directors of the registrant and filed herewith as Exhibit 24 on behalf of the registrant.
By: /s/ T. M. Paradie
(T. M. Paradie, as Attorney-in-Fact)
EXHIBIT INDEX
All documents referenced below have been filed pursuant to the Securities Exchange Act of 1934 by Cliffs Natural Resources Inc., file number 1-09844, unless otherwise indicated. |
| |
Exhibit Number | Exhibit |
| Plan of purchase, sale, reorganization, arrangement, liquidation or succession |
2.1 | ***Asset Purchase Agreement, dated as of December 2, 2014, by and among Cliffs Natural Resources Inc., Cliffs Logan County Coal LLC, Toney's Fork Land, LLC, Southern Eagle Land, LLC and Cliffs Logan County Coal Terminals LLC and Coronado Coal II, LLC (filed herewith) |
2.2 | ***Amendment to Asset Purchase Agreement, effective as of December 31, 2014, by and among Cliffs Natural Resources Inc., Cliffs Logan County Coal LLC, Toney's Fork Land, LLC, Southern Eagle Land, LLC and Cliffs Logan County Coal Terminals LLC and Coronado Coal II, LLC (filed herewith) |
| Articles of Incorporation and By-Laws of Cliffs Natural Resources Inc. |
3.1 | Third Amended Articles of Incorporation of Cliffs (as filed with the Secretary of State of the State of Ohio on May 13, 2013 (filed as Exhibit 3.1 to Cliffs' Form 8-K on May 13, 2013 and incorporated herein by reference) |
3.2 | Regulations of Cleveland-Cliffs Inc. (filed as Exhibit 3.2 to Cliffs' Form 10-K for the period ended December 31, 2011 and incorporated herein by reference) |
| Instruments defining rights of security holders, including indentures |
4.1 | Form of Indenture between Cliffs Natural Resources Inc. and U.S. Bank National Association, as trustee, dated March 17, 2010 (filed as Exhibit 4.1 to Cliffs' Form S-3 No. 333-165376 on March 10, 2010 and incorporated herein by reference) |
4.2 | Form of 5.90% Notes due 2020 First Supplemental Indenture between Cliffs Natural Resources Inc. and U.S. Bank National Association, as trustee, dated March 17, 2010, including Form of 5.90% Notes due 2020 (filed as Exhibit 4.2 to Cliffs' Form 8-K on March 16, 2010 and incorporated herein by reference) |
4.3 | Form of 4.80% Notes due 2020 Second Supplemental Indenture between Cliffs Natural Resources Inc. and U.S. Bank National Association, as trustee, dated September 20, 2010, including Form of 4.80% Notes due 2020 (filed as Exhibit 4.3 to Cliffs' Form 8-K on September 17, 2010 and incorporated herein by reference) |
4.4 | Form of 6.25% Notes due 2040 Third Supplemental Indenture between Cliffs Natural Resources Inc. and U.S. Bank National Association, as trustee, dated September 20, 2010, including Form of 6.25% Notes due 2040 (filed as Exhibit 4.4 to Cliffs' Form 8-K on September 17, 2010 and incorporated herein by reference) |
4.5 | Form of 4.875% Notes due 2021 Fourth Supplemental Indenture between Cliffs and U.S. Bank National Association, as trustee, dated March 23, 2011, including Form of 4.875% Notes due 2021 (filed as Exhibit 4.1 to Cliffs' Form 8-K on March 23, 2011 and incorporated herein by reference) |
4.6 | Fifth Supplemental Indenture between Cliffs and U.S. Bank National Association, as trustee, dated March 31, 2011 (filed as Exhibit 4(b) to Cliffs' Form 10-Q for the period ended June 30, 2011 and incorporated herein by reference) |
4.7 | Form of 3.95% Notes due 2018 Sixth Supplemental Indenture between Cliffs and U.S. Bank National Association, as trustee, dated December 13, 2012, including form of 3.95% Notes due 2018 (filed as Exhibit 4.1 to Cliffs' Form 8-K on December 13, 2012 and incorporated herein by reference) |
4.8 | Form of Common Share Certificate (filed as Exhibit 4.1 to Cliffs' Form 10-Q for the period ended September 30, 2014 and incorporated herein by reference) |
| |
|
| |
| Material Contracts |
10.1 | * Form of Change in Control Severance Agreement, effective January 1, 2014 (covering existing grants) (filed as Exhibit 10.1 to Cliffs' Form 10-K for the period ended December 31, 2013 and incorporated herein by reference) |
10.2 | * Form of Change in Control Severance Agreement (covering newly hired officers) (filed as Exhibit 10.2 to Cliffs' Form 10-K for the period ended December 31, 2013 and incorporated herein by reference) |
10.3 | * Form of Change In Control Severance Agreement (covering newly hired officers) (filed as Exhibit 10.4 to Cliffs' Form 8-K/A on September 16, 2014 and incorporated herein by reference) |
10.4 | * Cliffs Natural Resources Inc. 2012 Non-Qualified Deferred Compensation Plan (effective January 1, 2012) dated November 8, 2011 (filed as Exhibit 10.1 to Cliffs’ Form 8-K on November 8, 2011 and incorporated herein by reference) |
10.5 | * Form of Indemnification Agreement between Cliffs Natural Resources Inc. and Directors (filed as Exhibit 10.5 to Cliffs’ Form 10-K for the period ended December 31, 2011 and incorporated herein by reference) |
10.6 | * Amended and Restated Cleveland-Cliffs Inc Retirement Plan for Non-Employee Directors effective on July 1, 1995 (filed as Exhibit 10.6 to Cliffs’ Form 10-K for the period ended December 31, 2011 and incorporated herein by reference) |
10.7 | * Amendment to Amended and Restated Cleveland-Cliffs Inc Retirement Plan for Non-Employee Directors dated as of January 1, 2001 (filed as Exhibit 10.7 to Cliffs’ Form 10-K for the period ended December 31, 2011 and incorporated herein by reference) |
10.8 | * Second Amendment to the Amended and Restated Cleveland-Cliffs Inc Retirement Plan for Non-Employee Directors dated and effective January 14, 2003 (filed as Exhibit 10.8 to Cliffs’ Form 10-K for the period ended December 31, 2011 and incorporated herein by reference) |
10.9 | * Cliffs Natural Resources Inc. Nonemployee Directors’ Compensation Plan (Amended and Restated as of December 31, 2008) (filed as Exhibit 10(nnn) to Cliffs’ Form 10-K for the period ended December 31, 2008 and incorporated herein by reference) |
10.10 | * 2014 Nonemployee Directors' Compensation Plan (filed as Exhibit 10.2 to Cliffs’ Form 8-K on August 4, 2014 and incorporated herein by reference) |
10.11 | * Trust Agreement No. 1 (Amended and Restated effective June 1, 1997), dated June 12, 1997, by and between Cleveland-Cliffs Inc and KeyBank National Association, Trustee, with respect to the Cleveland-Cliffs Inc Supplemental Retirement Benefit Plan, Severance Pay Plan for Key Employees and certain executive agreements (filed as Exhibit 10.10 to Cliffs' Form 10-K for the period ended December 31, 2011 and incorporated herein by reference) |
10.12 | * Trust Agreement No. 1 Amendments to Exhibits, effective as of January 1, 2000, by and between Cleveland-Cliffs Inc and KeyBank National Association, as Trustee (filed as Exhibit 10.13 to Cliffs' Form 10-K for the period ended December 31, 2011 and incorporated herein by reference) |
10.13 | * First Amendment to Trust Agreement No. 1, effective September 10, 2002, by and between Cleveland-Cliffs Inc and KeyBank National Association, as Trustee (filed as Exhibit 10.12 to Cliffs' Form 10-K for the period ended December 31, 2011 and incorporated herein by reference) |
10.14 | * Second Amendment to Trust Agreement No. 1 between Cliffs Natural Resources Inc. (f/k/a Cleveland-Cliffs Inc) and KeyBank National Association, Trustee, entered into and effective as of December 31, 2008 (filed as Exhibit 10(y) to Cliffs’ Form 10-K for the period ended December 31, 2008 and incorporated herein by reference) |
10.15 | * Third Amendment to Trust Agreement No. 1 between Cliffs Natural Resources Inc. (f/k/a Cleveland-Cliffs Inc) and KeyBank National Association, Trustee, entered into and effective as July 28, 2014 (filed herewith) |
|
| |
10.16 | * Amended and Restated Trust Agreement No. 2, effective as of October 15, 2002, by and between Cleveland-Cliffs Inc and KeyBank National Association, Trustee, with respect to Executive Agreements and Indemnification Agreements with the Company’s Directors and certain Officers, the Company’s Severance Pay Plan for Key Employees, and the Retention Plan for Salaried Employees (filed as Exhibit 10.14 to Cliffs’ Form 10-K for the period ended December 31, 2011 and incorporated herein by reference) |
10.17 | * Second Amendment to Amended and Restated Trust Agreement No. 2 between Cliffs Natural Resources Inc. (f/k/a Cleveland-Cliffs Inc) and KeyBank National Association, Trustee, entered into and effective as of December 31, 2008 (filed as Exhibit 10(aa) to Cliffs’ Form 10-K for the period ended December 31, 2008 and incorporated herein by reference) |
10.18 | * Third Amendment to Amended and Restated Trust Agreement No. 2 between Cliffs Natural Resources Inc. (f/k/a Cleveland-Cliffs Inc) and KeyBank National Association, Trustee, entered into and effective as of July 28, 2014 (filed herewith) |
10.19 | * Trust Agreement No. 5, dated as of October 28, 1987, by and between Cleveland-Cliffs Inc and KeyBank National Association, Trustee, with respect to certain deferred compensation agreements (filed as Exhibit 10.16 to Cliffs’ Form 10-K for the period ended December 31, 2011 and incorporated herein by reference) |
10.20 | * First Amendment to Trust Agreement No. 5, dated as of May 12, 1989, by and between Cleveland-Cliffs Inc and KeyBank National Association, Trustee (filed as Exhibit 10.17 to Form 10-K of Cliffs’ for the period ended December 31, 2011 and incorporated herein by reference) |
10.21 | * Second Amendment to Trust Agreement No. 5, dated as of April 9, 1991, by and between Cleveland-Cliffs Inc and KeyBank National Association, Trustee (filed as Exhibit 10.18 to Form 10-K of Cliffs’ for the period ended December 31, 2011 and incorporated herein by reference) |
10.22 | * Third Amendment to Trust Agreement No. 5, dated as of March 9, 1992, by and between Cleveland-Cliffs Inc and KeyBank National Association, Trustee (filed as Exhibit 10.19 to Cliffs’ Form 10-K for the period ended December 31, 2011 and incorporated herein by reference) |
10.23 | * Fourth Amendment to Trust Agreement No. 5, dated November 18, 1994, by and between Cleveland-Cliffs Inc and KeyBank National Association, Trustee (filed as Exhibit 10.20 to Cliffs’ Form 10-K for the period ended December 31, 2011 and incorporated herein by reference) |
10.24 | * Fifth Amendment to Trust Agreement No. 5, dated May 23, 1997, by and between Cleveland-Cliffs Inc and KeyBank National Association, Trustee (filed as Exhibit 10.19 to Cliffs’ Form 10-K for the period ended December 31, 2011 and incorporated herein by reference) |
10.25 | *Sixth Amendment to Trust Agreement No. 5 between Cliffs Natural Resources Inc. (f/k/a Cleveland-Cliffs Inc) and KeyBank National Association, Trustee, entered into and effective as of December 31, 2008 (filed as Exhibit 10(hh) to Cliffs’ Form 10-K for the period ended December 31, 2008 and incorporated herein by reference) |
10.26 | *Seventh Amendment to Trust Agreement No. 5 between Cliffs Natural Resources Inc. (f/k/a Cleveland-Cliffs Inc) and KeyBank National Association, Trustee, entered into and effective as of July 28, 2014 (filed herewith) |
10.27 | * Trust Agreement No. 7, dated as of April 9, 1991, by and between Cleveland-Cliffs Inc and KeyBank National Association, Trustee, with respect to the Cleveland-Cliffs Inc Supplemental Retirement Benefit Plan (filed as Exhibit 10.23 to Cliffs’ Form 10-K for the period ended December 31, 2011 and incorporated herein by reference) |
10.28 | * First Amendment to Trust Agreement No. 7, by and between Cleveland-Cliffs Inc and KeyBank National Association, Trustee, dated as of March 9, 1992 (filed as Exhibit 10.24 to Cliffs’ Form 10-K for the period ended December 31, 2011 and incorporated herein by reference) |
10.29 | * Second Amendment to Trust Agreement No. 7, dated November 18, 1994, by and between Cleveland-Cliffs Inc and KeyBank National Association, Trustee (filed as Exhibit 10.25 to Cliffs’ Form 10-K for the period ended December 31, 2011 and incorporated herein by reference) |
10.30 | * Third Amendment to Trust Agreement No. 7, dated May 23, 1997, by and between Cleveland-Cliffs Inc and KeyBank National Association, Trustee (filed as Exhibit 10.26 to Cliffs’ Form 10-K for the period ended December 31, 2011 and incorporated herein by reference) |
|
| |
10.31 | * Fourth Amendment to Trust Agreement No. 7, dated July 15, 1997, by and between Cleveland-Cliffs Inc and KeyBank National Association, Trustee (filed as Exhibit 10.27 to Cliffs’ Form 10-K for the period ended December 31, 2011 and incorporated herein by reference) |
10.32 | * Amendment to Exhibits to Trust Agreement No. 7, effective as of January 1, 2000, by and between Cleveland-Cliffs Inc and KeyBank National Association, Trustee (filed as Exhibit 10.28 to Cliffs’ Form 10-K for the period ended December 31, 2011 and incorporated herein by reference) |
10.33 | * Sixth Amendment to Trust Agreement No. 7 between Cliffs Natural Resources Inc. (f/k/a Cleveland-Cliffs Inc) and KeyBank National Association, Trustee, entered into and effective as of December 31, 2008 (filed as Exhibit 10(oo) to Cliffs’ Form 10-K for the period ended December 31, 2008 and incorporated herein by reference) |
10.34 | * Seventh Amendment to Trust Agreement No. 7 between Cliffs Natural Resources Inc. (f/k/a Cleveland-Cliffs Inc) and KeyBank National Association, Trustee, entered into and effective as of July 28, 2014 (filed herewith) |
10.35 | * Trust Agreement No. 8, dated as of April 9, 1991, by and between Cleveland-Cliffs Inc and KeyBank National Association, Trustee, with respect to the Cleveland-Cliffs Inc Retirement Plan for Non-Employee Directors (filed as Exhibit 10.32 to Cliffs’ Form 10-K for the period ended December 31, 2011 and incorporated herein by reference) |
10.36 | * First Amendment to Trust Agreement No. 8, dated as of March 9, 1992, by and between Cleveland-Cliffs Inc and KeyBank National Association, Trustee (filed as Exhibit 10.31 to Cliffs’ Form 10-K for the period ended December 31, 2011 and incorporated herein by reference) |
10.37 | * Second Amendment to Trust Agreement No. 8, dated June 12, 1997, by and between Cleveland-Cliffs Inc and KeyBank National Association, Trustee (filed as Exhibit 10.32 to Cliffs’ Form 10-K for the period ended December 31, 2011 and incorporated herein by reference) |
10.38 | * Third Amendment to Trust Agreement No. 8 between Cliffs Natural Resources Inc. (f/k/a Cleveland-Cliffs Inc) and KeyBank National Association, Trustee, entered into and effective as of December 31, 2008 (filed as Exhibit 10(ss) to Cliffs’ Form 10-K for the period ended December 31, 2008 and incorporated herein by reference) |
10.39 | * Fourth Amendment to Trust Agreement No. 8 between Cliffs Natural Resources Inc. (f/k/a Cleveland-Cliffs Inc) and KeyBank National Association, Trustee, entered into and effective as of July 28, 2014 (filed herewith) |
10.40 | * Trust Agreement No. 9, dated as of November 20, 1996, by and between Cleveland-Cliffs Inc and KeyBank National Association, Trustee, with respect to the Cleveland-Cliffs Inc Nonemployee Directors’ Supplemental Compensation Plan (filed as Exhibit 10.34 to Cliffs’ Form 10-K for the period ended December 31, 2011 and incorporated herein by reference) |
10.41 | * First Amendment to Trust Agreement No. 9 between Cliffs Natural Resources Inc. (f/k/a Cleveland-Cliffs Inc) and KeyBank National Association, Trustee, entered into and effective as of December 31, 2008 (filed as Exhibit 10(uu) to Cliffs’ Form 10-K for the period ended December 31, 2008 and incorporated herein by reference) |
10.42 | * Second Amendment to Trust Agreement No. 9 between Cliffs Natural Resources Inc. (f/k/a Cleveland-Cliffs Inc) and KeyBank National Association, Trustee, entered into and effective as of July 28, 2014 (filed herewith) |
10.43 | * Trust Agreement No. 10, dated as of November 20, 1996, by and between Cleveland-Cliffs Inc and KeyBank National Association, Trustee, with respect to the Cleveland-Cliffs Inc Nonemployee Directors’ Compensation Plan (filed as Exhibit 10.36 to Cliffs’ Form 10-K for the period ended December 31, 2011 and incorporated herein by reference) |
10.44 | *First Amendment to Trust Agreement No. 10 between Cliffs Natural Resources Inc. (f/k/a Cleveland-Cliffs Inc) and KeyBank National Association, Trustee, entered into and effective as of December 31, 2008 (filed as Exhibit 10(ww) to Cliffs’ Form 10-K for the period ended February 26, 2009 and incorporated herein by reference) |
|
| |
10.45 | * Second Amendment to Trust Agreement No. 10 between Cliffs Natural Resources Inc. (f/k/a Cleveland-Cliffs Inc) and KeyBank National Association, Trustee, entered into and effective as of July 28, 2014 (filed herewith) |
10.46 | *Letter Agreement of Employment by and between Cliffs Natural Resources Inc. and Gary B. Halverson dated October 23, 2013 (filed as Exhibit 10.50 to Cliffs' Form 10-K for the period ended December 31, 2013 and incorporated herein by reference) |
10.47 | *Non-employee Director Phantom Stock Unit Award Agreement, by and between Cliffs and James F. Kirsch dated July 9, 2013 (filed as Exhibit 10.51 to Cliffs' Form 10-K for the period ended December 31, 2013 and incorporated herein by reference) |
10.48 | *Letter Agreement between Cliffs Natural Resources Inc. and James Kirsch dated December 4, 2013 (filed as Exhibit 10.52 to Cliffs' Form 10-K for the period ended December 31, 2013 and incorporated herein by reference) |
10.49 | *Form of Letter Agreement of Employment between Cliffs Asia Pacific Iron Ore Management Pty Ltd and Australian Executives (filed as Exhibit 10.55 to Cliffs' Form 10-K for the period ended December 31, 2013 and incorporated herein by reference) |
10.50 | *Letter Agreement between Cliffs Natural Resources Inc. and William Hart dated October 10, 2013 (filed as Exhibit 10.56 to Cliffs' Form 10-K for the period ended December 31, 2013 and incorporated herein by reference) |
10.51 | *Severance Agreement, by and between William S. Hart and Cliffs Natural Resources Inc. and its affiliates, dated March 20, 2014 (filed as Exhibit 10.2 to Cliffs' Form 10-Q for the period ended March 31, 2014 and incorporated herein by reference) |
10.52 | *Release by William S. Hart in favor of Cliffs Natural Resources Inc. and its affiliates, dated March 26, 2014 (filed as Exhibit 10.3 to Cliffs' Form 10-Q for the period ended March 31, 2014 and incorporated herein by reference) |
10.53 | *Redundancy Letter Agreement, by and between Cliffs Asia Pacific Iron Ore Management PTY LTD and Colin Williams, dated March 21, 2014 (filed as Exhibit 10.1 to Cliffs' Form 10-Q for the period ended June 30, 2014 and incorporated herein by reference) |
10.54 | *Severance Agreement and Release, by and between Gary B. Halverson and Cliffs Natural Resources Inc., dated August 22, 2014 (filed herewith) |
10.55 | *Letter Agreement, by and between Lourenco Goncalves and Cliffs Natural Resources Inc., signed as of September 11, 2014 (filed as Exhibit 10.1 to Cliffs' Form 8-K/A on September 16, 2014 and incorporated herein by reference) |
10.56 | *Cleveland-Cliffs Inc and Subsidiaries Management Performance Incentive Plan Summary, effective January 1, 2004 (filed as Exhibit 10.47 to Cliffs’ Form 10-K for the period ended December 31, 2011 and incorporated herein by reference) |
10.57 | *Cliffs Natural Resources Inc. 2012 Executive Management Performance Incentive Plan effective March 13, 2012 (filed as Exhibit 10.3 to Cliffs’ Form 8-K on May 14, 2012 and incorporated herein by reference) |
10.58 | *Cliffs Natural Resources Inc. 2012 Incentive Equity Plan effective March 13, 2012 (filed as Exhibit 10.1 to Cliffs Form 8-K on May 14, 2012 and incorporated herein by reference) |
10.59 | *First Amendment to Cliffs Natural Resources Inc. 2012 Incentive Plan effective September 11, 2012 (filed as Exhibit 10.2 to Cliffs’ Form 10-Q for the period ended September 30, 2012 and incorporated herein by reference) |
10.60 | *Form of Cliffs Natural Resources Inc. Restricted Share Unit Award Memorandum and Restricted Share Unit Award Agreement under the 2012 Incentive Equity Plan (filed as Exhibit 10.77 to Cliffs' Form 10-K for the period ended December 31, 2013 and incorporated herein by reference) |
10.61 | *Form of Cliffs Natural Resources Inc. Restricted Share Unit Award Memorandum (Graduated Vesting 50%) and Restricted Share Unit Award Agreement under the 2012 Incentive Equity Plan (filed as Exhibit 10.78 to Cliffs' Form 10-K for the period ended December 31, 2013 and incorporated herein by reference) |
|
| |
10.62 | *Form of Cliffs Natural Resources Inc. Restricted Share Unit Award Memorandum (Graduated Vesting 33%) and Restricted Share Unit Award Agreement under the 2012 Incentive Equity Plan (filed as Exhibit 10.79 to Cliffs' Form 10-K for the period ended December 31, 2013 and incorporated herein by reference) |
10.63 | *Cliffs Natural Resources Inc. Amended and Restated 2012 Incentive Equity Plan (filed as Exhibit 10.1 to Cliffs' Form 8-K on August 4, 2014 and incorporated herein by reference) |
10.64 | *Form of Cliffs Natural Resources Inc. Amended and Restated 2012 Incentive Equity Plan Restricted Share Unit Award Memorandum (Graduated Vesting 50% - July 2014 Grant) and Restricted Share Unit Award Agreement (filed herewith) |
10.65 | *Form of Cliffs Natural Resources Inc. Amended and Restated 2012 Incentive Equity Plan Restricted Share Unit Award Memorandum (3-Year Vesting - July 2014 Grant) and Restricted Share Unit Award Agreement (filed herewith) |
10.66 | *Form of Cliffs Natural Resources Inc. Amended and Restated 2012 Incentive Equity Plan Performance Share Award Memorandum (3-Year Vesting - July 2014 Grant) and Performance Share Award Agreement (filed herewith) |
10.67 | *Form of Cliffs Natural Resources Inc. Amended and Restated 2012 Incentive Equity Plan Non-Qualified Stock Option Award Memorandum (2014 Grant) and Stock Option Award Agreement (filed as Exhibit 10.2 to Cliffs' Form 8-K/A on September 16, 2014 and incorporated herein by reference) |
10.68 | *Form of Cliffs Natural Resources Inc. Amended and Restated 2012 Incentive Equity Plan Performance Unit Award Memorandum (2014 Grant) and Performance Unit Award Agreement (filed as Exhibit 10.3 to Cliffs' Form 8-K/A on September 16, 2014 and incorporated herein by reference) |
10.69 | *Form of Cliffs Natural Resources Inc. Amended and Restated 2012 Incentive Equity Plan Non-Qualified Stock Option Award Memorandum (3-Year Vesting - January 2015 Grant) and Stock Option Award Agreement (filed herewith) |
10.70 | *Form of Cliffs Natural Resources Inc. Amended and Restated 2012 Incentive Equity Plan Restricted Share Unit Award Memorandum (Graduated Vesting 33% - January 2015 Grant) and Restricted Share Unit Award Agreement (filed herewith) |
10.71 | *Form of Cliffs Natural Resources Inc. Amended and Restated 2012 Incentive Equity Plan Performance Share Award Memorandum (3-Year Vesting - January 2015 Grant) and Performance Share Award Agreement (filed herewith) |
10.72 | *Form of Cliffs Natural Resources Inc. Amended and Restated 2012 Incentive Equity Plan Restricted Share Unit Award Memorandum (Graduated Vesting 33% - February 2015 Grant) and Restricted Share Unit Award Agreement (filed herewith) |
10.73 | *Form of Cliffs Natural Resources Inc. Amended and Restated 2012 Incentive Equity Plan Performance Share Award Memorandum (3 year Vesting - February 2015 Grant) and Restricted Share Unit Award Agreement (filed herewith) |
10.74 | *Cliffs Natural Resources Inc. Supplemental Retirement Benefit Plan (as Amended and Restated effective December 1, 2006) dated December 31, 2008 (filed as Exhibit 10(mmm) to Cliffs’ Form 10-K for the period ended December 31, 2008 and incorporated herein by reference) |
10.75 | ** Pellet Sale and Purchase Agreement, dated and effective as of April 10, 2002, by and among The Cleveland-Cliffs Iron Company, Cliffs Mining Company, Northshore Mining Company, Northshore Sales Company, International Steel Group Inc., ISG Cleveland Inc., and ISG Indiana Harbor Inc. (filed as Exhibit 10.84 to Cliffs' Form 10-K for the period ended December 31, 2013 and incorporated herein by reference) |
10.76 | ** First Amendment to Pellet Sale and Purchase Agreement, dated and effective December 16, 2004 by and among The Cleveland-Cliffs Iron Company, Cliffs Mining Company, Northshore Mining Company, Cliffs Sales Company (formerly known as Northshore Sales Company), International Steel Group Inc., ISG Cleveland Inc. and ISG Indiana Harbor (filed as Exhibit 10.85 to Cliffs' Form 10-K for the period ended December 31, 2013 and incorporated herein by reference) |
|
| |
10.77 | ** Pellet Sale and Purchase Agreement, dated and effective as of December 31, 2002 by and among The Cleveland-Cliffs Iron Company, Cliffs Mining Company, and Ispat Inland Inc. (filed as Exhibit 10.86 to Cliffs' Form 10-K for the period ended December 31, 2013 and incorporated herein by reference) |
10.78 | ** 2011 Omnibus Agreement, dated as of April 8, 2011 and effective as of March 31, 2011, by and among ArcelorMittal USA LLC, as successor in interest to Ispat Inland Inc., ArcelorMittal Cleveland Inc. (formerly known as ISG Cleveland Inc.), ArcelorMittal Indiana Harbor LLC (formerly known as ISG Indiana Harbor Inc.) and Cliffs Natural Resources Inc., The Cleveland-Cliffs Iron Company, Cliffs Mining Company, Northshore Mining Company and Cliffs Sales Company (formerly known as Northshore Sales Company) (filed as Exhibit 10(a) to Cliffs’ Form 10-Q for the period ended June 30, 2011 and incorporated herein by reference) |
10.79 | **2014 Extension Agreement dated as of February 24, 2014 but effective as of January 1, 2014, among ArcelorMittal USA LLC, Cliffs Natural Resources Inc., The Cleveland-Cliffs Iron Company and Cliffs Mining Company (filed as Exhibit 10.1 to Cliffs' Form 10-Q/A filed on October 8, 2014 for the period ended March 31, 2014 and incorporated herein by reference) |
10.80 | Amended and Restated Multicurrency Credit Agreement entered into as of August 11, 2011, among Cliffs, certain foreign subsidiaries of the Company from time to time party thereto, Bank of America, N.A., as Administrative Agent, Swing Line Lender and L/C Issuer, JPMorgan Chase Bank, N.A., as Syndication Agent and L/C Issuer, Merrill Lynch, Pierce, Fenner & Smith Incorporated, J.P. Morgan Securities LLC, Citigroup Global Markets Inc., PNC Capital Markets Inc. and U.S. Bank National Association, as Joint Lead Arrangers and Joint Book Managers, Fifth Third Bank and RBS Citizens, N.A., as Co-Documentation Agents, and the various institutions from time to time party thereto (filed as Exhibit 10(a) to Cliffs’ Form 8-K on August 17, 2011 and incorporated herein by reference) |
10.81 | Amendment No. 1, dated as of October 16, 2012 to Amended and Restated Multicurrency Credit Agreement (filed as Exhibit 10.1 to Cliffs’ Form 8-K on October 19, 2012 and incorporated herein by reference) |
10.82 | Amendment No. 2 to the Amended and Restated Multicurrency Credit Agreement dated as of February 8, 2013 (filed as Exhibit 10.92 to Cliffs’ Form 10-K for the period ended December 31, 2012 and incorporated herein by reference) |
10.83 | Amendment No. 3, dated as of June 30, 2014, to the Amended and Restated Multicurrency Credit Agreement, dated as of August 11, 2011, among Cliffs Natural Resources Inc., the foreign subsidiaries of Cliffs Natural Resources Inc. from time to time party thereto, the lenders from time to time party thereto and Bank of America, N.A., as Administrative Agent (filed as Exhibit 10.1 to Cliffs' Form 8-K on June 30, 2014 and incorporated herein by reference) |
10.84 | Amendment No. 4, dated as of September 9, 2014, to the Amended and Restated Multicurrency Credit Agreement, dated as of August 11, 2011, among the Company, the foreign subsidiaries of the Company from time to time party thereto, the lenders from time to time party thereto and Bank of America, N.A., as Administrative Agent (filed as Exhibit 10.1 to Cliffs' Form 8-K on September 12, 2014 and incorporated herein by reference)
|
10.85 | Amendment No. 5, dated as of October 24, 2014, to the Amended and Restated Multicurrency Credit Agreement, dated as of August 11, 2011, among the Company, the foreign subsidiaries of the Company from time to time party thereto, the lenders from time to time party thereto and Bank of America, N.A., as Administrative Agent (filed as Exhibit 10.2 to Cliffs’ Form 10-Q for the period ended on September 30, 2014 and incorporated herein by reference) |
10.86 | Amendment No. 6, dated as of January 22, 2015, to the Amended and Restated Multicurrency Credit Agreement, dated as of August 11, 2011, among the Company, the foreign subsidiaries of the Company from time to time party thereto, the lenders from time to time party thereto and Bank of America, N.A., as Administrative Agent (filed herewith) |
10.87 | Agreement between Cliffs Natural Resources Inc. and Casablanca Capital LP, dated October 7, 2014 (filed as Exhibit 99.1 to Cliffs' Form 8-K on October 14, 2014 and incorporated herein by reference) |
12 | Ratio of Earnings To Combined Fixed Charges And Preferred Stock Dividend Requirements (filed herewith) |
|
| |
21 | Subsidiaries of the Registrant (filed herewith) |
23 | Consent of Independent Registered Public Accounting Firm (filed herewith) |
24 | Power of Attorney (filed herewith) |
31.1 | Certification Pursuant to 15 U.S.C. Section 7241, as Adopted Pursuant to Section 302 of the Sarbanes-Oxley Act of 2002, signed and dated by Lourenco Goncalves as of February 25, 2015 (filed herewith) |
31.2 | Certification Pursuant to 15 U.S.C. Section 7241, as Adopted Pursuant to Section 302 of the Sarbanes-Oxley Act of 2002, signed and dated by Terrance M. Paradie as of February 25, 2015 (filed herewith) |
32.1 | Certification Pursuant to 18 U.S.C. Section 1350, as Adopted Pursuant to Section 906 of the Sarbanes-Oxley Act of 2002, signed and dated by Lourenco Goncalves, President and Chief Executive Officer of Cliffs Natural Resources Inc., as of February 25, 2015 (filed herewith) |
32.2 | Certification Pursuant to 18 U.S.C. Section 1350, as Adopted Pursuant to Section 906 of the Sarbanes-Oxley Act of 2002, signed and dated by Terrance M. Paradie, Executive Vice President and Chief Financial Officer of Cliffs Natural Resources Inc., as of February 25, 2015 (filed herewith) |
95 | Mine Safety Disclosures (filed herewith) |
99(a) | Schedule II – Valuation and Qualifying Accounts (filed herewith) |
101.INS | XBRL Instance Document |
101.SCH | XBRL Taxonomy Extension Schema Document |
101.CAL | XBRL Taxonomy Extension Calculation Linkbase Document |
101.DEF | XBRL Taxonomy Extension Definition Linkbase Document |
101.LAB | XBRL Taxonomy Extension Label Linkbase Document |
101.PRE | XBRL Taxonomy Extension Presentation Linkbase Document |
* Indicates management contract or other compensatory arrangement.
| |
** | Confidential treatment requested and/or approved as to certain portions, which portions have been omitted and filed separately with the Securities and Exchange Commission. |
| |
*** | Certain immaterial schedules and exhibits to this exhibit have been omitted pursuant to the provisions of Regulation S-K, Item 601(b)(2). A copy of any of the omitted schedules and exhibits will be furnished to the Securities and Exchange Commission upon request. |