000076406512/312023Q1false00007640652023-01-012023-03-3100007640652023-04-25xbrli:shares00007640652023-03-31iso4217:USD00007640652022-12-31iso4217:USDxbrli:shares00007640652022-01-012022-03-3100007640652021-12-3100007640652022-03-310000764065us-gaap:CommonStockMember2022-12-310000764065us-gaap:AdditionalPaidInCapitalMember2022-12-310000764065us-gaap:RetainedEarningsMember2022-12-310000764065us-gaap:TreasuryStockMember2022-12-310000764065us-gaap:AccumulatedOtherComprehensiveIncomeMember2022-12-310000764065us-gaap:NoncontrollingInterestMember2022-12-310000764065us-gaap:RetainedEarningsMember2023-01-012023-03-310000764065us-gaap:AccumulatedOtherComprehensiveIncomeMember2023-01-012023-03-310000764065us-gaap:NoncontrollingInterestMember2023-01-012023-03-310000764065us-gaap:CommonStockMember2023-01-012023-03-310000764065us-gaap:AdditionalPaidInCapitalMember2023-01-012023-03-310000764065us-gaap:TreasuryStockMember2023-01-012023-03-310000764065us-gaap:CommonStockMember2023-03-310000764065us-gaap:AdditionalPaidInCapitalMember2023-03-310000764065us-gaap:RetainedEarningsMember2023-03-310000764065us-gaap:TreasuryStockMember2023-03-310000764065us-gaap:AccumulatedOtherComprehensiveIncomeMember2023-03-310000764065us-gaap:NoncontrollingInterestMember2023-03-310000764065us-gaap:CommonStockMember2021-12-310000764065us-gaap:AdditionalPaidInCapitalMember2021-12-310000764065us-gaap:RetainedEarningsMember2021-12-310000764065us-gaap:TreasuryStockMember2021-12-310000764065us-gaap:AccumulatedOtherComprehensiveIncomeMember2021-12-310000764065us-gaap:NoncontrollingInterestMember2021-12-310000764065us-gaap:RetainedEarningsMember2022-01-012022-03-310000764065us-gaap:AccumulatedOtherComprehensiveIncomeMember2022-01-012022-03-310000764065us-gaap:NoncontrollingInterestMember2022-01-012022-03-310000764065us-gaap:CommonStockMember2022-01-012022-03-310000764065us-gaap:AdditionalPaidInCapitalMember2022-01-012022-03-310000764065us-gaap:TreasuryStockMember2022-01-012022-03-310000764065us-gaap:CommonStockMember2022-03-310000764065us-gaap:AdditionalPaidInCapitalMember2022-03-310000764065us-gaap:RetainedEarningsMember2022-03-310000764065us-gaap:TreasuryStockMember2022-03-310000764065us-gaap:AccumulatedOtherComprehensiveIncomeMember2022-03-310000764065us-gaap:NoncontrollingInterestMember2022-03-31clf:Employeeclf:segment0000764065us-gaap:OtherNoncurrentAssetsMember2023-03-310000764065us-gaap:OtherNoncurrentAssetsMember2022-12-310000764065us-gaap:OtherCurrentLiabilitiesMember2023-03-310000764065us-gaap:OtherCurrentLiabilitiesMember2022-12-310000764065us-gaap:AccountsPayableMember2023-03-310000764065us-gaap:AccountsPayableMember2022-12-310000764065clf:SteelmakingMemberclf:AutomotiveMember2023-01-012023-03-310000764065clf:SteelmakingMemberclf:AutomotiveMember2022-01-012022-03-310000764065clf:InfrastructureAndManufacturingMemberclf:SteelmakingMember2023-01-012023-03-310000764065clf:InfrastructureAndManufacturingMemberclf:SteelmakingMember2022-01-012022-03-310000764065clf:SteelmakingMemberclf:DistributorsAndConvertersMember2023-01-012023-03-310000764065clf:SteelmakingMemberclf:DistributorsAndConvertersMember2022-01-012022-03-310000764065clf:SteelmakingMemberclf:SteelProducersMember2023-01-012023-03-310000764065clf:SteelmakingMemberclf:SteelProducersMember2022-01-012022-03-310000764065clf:SteelmakingMember2023-01-012023-03-310000764065clf:SteelmakingMember2022-01-012022-03-310000764065clf:OtherBusinessesMemberclf:AutomotiveMember2023-01-012023-03-310000764065clf:OtherBusinessesMemberclf:AutomotiveMember2022-01-012022-03-310000764065clf:OtherBusinessesMemberclf:InfrastructureAndManufacturingMember2023-01-012023-03-310000764065clf:OtherBusinessesMemberclf:InfrastructureAndManufacturingMember2022-01-012022-03-310000764065clf:OtherBusinessesMemberclf:DistributorsAndConvertersMember2023-01-012023-03-310000764065clf:OtherBusinessesMemberclf:DistributorsAndConvertersMember2022-01-012022-03-310000764065clf:OtherBusinessesMember2023-01-012023-03-310000764065clf:OtherBusinessesMember2022-01-012022-03-310000764065clf:SteelmakingMemberclf:HotRolledSteelMember2023-01-012023-03-310000764065clf:SteelmakingMemberclf:HotRolledSteelMember2022-01-012022-03-310000764065clf:SteelmakingMemberclf:ColdRolledSteelMember2023-01-012023-03-310000764065clf:SteelmakingMemberclf:ColdRolledSteelMember2022-01-012022-03-310000764065clf:SteelmakingMemberclf:CoatedSteelMember2023-01-012023-03-310000764065clf:SteelmakingMemberclf:CoatedSteelMember2022-01-012022-03-310000764065clf:SteelmakingMemberclf:StainlessAndElectricalSteelMember2023-01-012023-03-310000764065clf:SteelmakingMemberclf:StainlessAndElectricalSteelMember2022-01-012022-03-310000764065clf:PlateSteelMemberclf:SteelmakingMember2023-01-012023-03-310000764065clf:PlateSteelMemberclf:SteelmakingMember2022-01-012022-03-310000764065clf:SteelmakingMemberclf:SlabAndOtherSteelProductsMember2023-01-012023-03-310000764065clf:SteelmakingMemberclf:SlabAndOtherSteelProductsMember2022-01-012022-03-310000764065clf:SteelmakingMemberclf:OtherMember2023-01-012023-03-310000764065clf:SteelmakingMemberclf:OtherMember2022-01-012022-03-310000764065clf:OtherBusinessesMemberclf:OtherMember2023-01-012023-03-310000764065clf:OtherBusinessesMemberclf:OtherMember2022-01-012022-03-310000764065us-gaap:IntersegmentEliminationMember2023-01-012023-03-310000764065us-gaap:IntersegmentEliminationMember2022-01-012022-03-310000764065clf:EBITDACalculationMember2023-01-012023-03-310000764065clf:EBITDACalculationMember2022-01-012022-03-310000764065clf:AdjustedEBITDACalculationMember2023-01-012023-03-310000764065clf:AdjustedEBITDACalculationMember2022-01-012022-03-310000764065clf:SteelmakingMemberus-gaap:OperatingSegmentsMember2023-03-310000764065clf:SteelmakingMemberus-gaap:OperatingSegmentsMember2022-12-310000764065clf:OtherBusinessesMemberus-gaap:OperatingSegmentsMember2023-03-310000764065clf:OtherBusinessesMemberus-gaap:OperatingSegmentsMember2022-12-310000764065us-gaap:OperatingSegmentsMember2023-03-310000764065us-gaap:OperatingSegmentsMember2022-12-310000764065us-gaap:CorporateNonSegmentMember2023-03-310000764065us-gaap:CorporateNonSegmentMember2022-12-310000764065clf:LandlandimprovementsandmineralrightsMember2023-03-310000764065clf:LandlandimprovementsandmineralrightsMember2022-12-310000764065us-gaap:BuildingMember2023-03-310000764065us-gaap:BuildingMember2022-12-310000764065us-gaap:EquipmentMember2023-03-310000764065us-gaap:EquipmentMember2022-12-310000764065us-gaap:OtherAssetsMember2023-03-310000764065us-gaap:OtherAssetsMember2022-12-310000764065us-gaap:ConstructionInProgressMember2023-03-310000764065us-gaap:ConstructionInProgressMember2022-12-310000764065clf:IndianaHarborMember2022-01-012022-03-310000764065clf:SteelmakingMember2023-03-310000764065clf:SteelmakingMember2022-12-310000764065clf:OtherBusinessesMember2023-03-310000764065clf:OtherBusinessesMember2022-12-310000764065us-gaap:CustomerRelationshipsMember2023-03-310000764065us-gaap:CustomerRelationshipsMember2022-12-310000764065us-gaap:TechnologyBasedIntangibleAssetsMember2023-03-310000764065us-gaap:TechnologyBasedIntangibleAssetsMember2022-12-310000764065us-gaap:TrademarksAndTradeNamesMember2023-03-310000764065us-gaap:TrademarksAndTradeNamesMember2022-12-310000764065clf:MiningPermitsMember2023-03-310000764065clf:MiningPermitsMember2022-12-310000764065clf:SupplierRelationshipsMember2023-03-310000764065clf:SupplierRelationshipsMember2022-12-310000764065clf:A67502026SeniorSecuredNotesMemberclf:ClevelandCliffsInc.Member2023-03-31xbrli:pure0000764065clf:A67502026SeniorSecuredNotesMemberclf:ClevelandCliffsInc.Member2022-12-310000764065clf:A70002027SeniorNotesMemberclf:ClevelandCliffsInc.Member2023-03-310000764065clf:A70002027SeniorNotesMemberclf:ClevelandCliffsInc.Member2022-12-310000764065clf:A70002027AKSeniorNotesMemberclf:AKSteelMember2023-03-310000764065clf:A70002027AKSeniorNotesMemberclf:AKSteelMember2022-12-310000764065clf:A5.8752027SeniorNotesMemberclf:ClevelandCliffsInc.Member2023-03-310000764065clf:A5.8752027SeniorNotesMemberclf:ClevelandCliffsInc.Member2022-12-310000764065clf:A46252029SeniorNotesMemberclf:ClevelandCliffsInc.Member2023-03-310000764065clf:A46252029SeniorNotesMemberclf:ClevelandCliffsInc.Member2022-12-310000764065clf:A48752031SeniorNotesMemberclf:ClevelandCliffsInc.Member2023-03-310000764065clf:A48752031SeniorNotesMemberclf:ClevelandCliffsInc.Member2022-12-310000764065clf:ClevelandCliffsInc.Memberclf:A62502040SeniorNotesMember2023-03-310000764065clf:ClevelandCliffsInc.Memberclf:A62502040SeniorNotesMember2022-12-310000764065us-gaap:RevolvingCreditFacilityMemberclf:ClevelandCliffsInc.Member2023-03-310000764065us-gaap:RevolvingCreditFacilityMemberclf:ClevelandCliffsInc.Member2022-12-310000764065us-gaap:SubsequentEventMemberclf:A67502030SeniorNotesMemberclf:ClevelandCliffsInc.Member2023-04-140000764065us-gaap:RevolvingCreditFacilityMember2023-03-310000764065us-gaap:LetterOfCreditMember2023-03-310000764065us-gaap:PensionPlansDefinedBenefitMember2023-01-012023-03-310000764065us-gaap:PensionPlansDefinedBenefitMember2022-01-012022-03-310000764065us-gaap:OtherPostretirementBenefitPlansDefinedBenefitMember2023-01-012023-03-310000764065us-gaap:OtherPostretirementBenefitPlansDefinedBenefitMember2022-01-012022-03-310000764065us-gaap:CarryingReportedAmountFairValueDisclosureMemberus-gaap:FairValueInputsLevel1Memberus-gaap:SeniorNotesMember2023-03-310000764065us-gaap:EstimateOfFairValueFairValueDisclosureMemberus-gaap:FairValueInputsLevel1Memberus-gaap:SeniorNotesMember2023-03-310000764065us-gaap:CarryingReportedAmountFairValueDisclosureMemberus-gaap:FairValueInputsLevel1Memberus-gaap:SeniorNotesMember2022-12-310000764065us-gaap:EstimateOfFairValueFairValueDisclosureMemberus-gaap:FairValueInputsLevel1Memberus-gaap:SeniorNotesMember2022-12-310000764065us-gaap:FairValueInputsLevel2Memberus-gaap:CarryingReportedAmountFairValueDisclosureMemberus-gaap:RevolvingCreditFacilityMemberus-gaap:LineOfCreditMember2023-03-310000764065us-gaap:FairValueInputsLevel2Memberus-gaap:EstimateOfFairValueFairValueDisclosureMemberus-gaap:RevolvingCreditFacilityMemberus-gaap:LineOfCreditMember2023-03-310000764065us-gaap:FairValueInputsLevel2Memberus-gaap:CarryingReportedAmountFairValueDisclosureMemberus-gaap:RevolvingCreditFacilityMemberus-gaap:LineOfCreditMember2022-12-310000764065us-gaap:FairValueInputsLevel2Memberus-gaap:EstimateOfFairValueFairValueDisclosureMemberus-gaap:RevolvingCreditFacilityMemberus-gaap:LineOfCreditMember2022-12-310000764065us-gaap:CarryingReportedAmountFairValueDisclosureMember2023-03-310000764065us-gaap:EstimateOfFairValueFairValueDisclosureMember2023-03-310000764065us-gaap:CarryingReportedAmountFairValueDisclosureMember2022-12-310000764065us-gaap:EstimateOfFairValueFairValueDisclosureMember2022-12-310000764065us-gaap:CommodityContractMembersrt:NaturalGasPerThousandCubicFeetMember2023-03-31clf:MMBtu0000764065us-gaap:CommodityContractMembersrt:NaturalGasPerThousandCubicFeetMember2022-12-310000764065us-gaap:ElectricityMemberus-gaap:CommodityContractMember2023-03-31utr:MWh0000764065us-gaap:ElectricityMemberus-gaap:CommodityContractMember2022-12-310000764065us-gaap:CommodityContractMemberclf:TinMember2023-03-31clf:metricTons0000764065us-gaap:CommodityContractMemberclf:TinMember2022-12-310000764065us-gaap:OtherCurrentAssetsMember2023-03-310000764065us-gaap:OtherCurrentAssetsMember2022-12-310000764065us-gaap:OtherNoncurrentLiabilitiesMember2023-03-310000764065us-gaap:OtherNoncurrentLiabilitiesMember2022-12-3100007640652022-02-100000764065us-gaap:SeriesAPreferredStockMember2023-03-310000764065us-gaap:SeriesBPreferredStockMember2023-03-310000764065us-gaap:AccumulatedForeignCurrencyAdjustmentIncludingPortionAttributableToNoncontrollingInterestMember2022-12-310000764065us-gaap:AccumulatedForeignCurrencyAdjustmentIncludingPortionAttributableToNoncontrollingInterestMember2021-12-310000764065us-gaap:AccumulatedForeignCurrencyAdjustmentIncludingPortionAttributableToNoncontrollingInterestMember2023-01-012023-03-310000764065us-gaap:AccumulatedForeignCurrencyAdjustmentIncludingPortionAttributableToNoncontrollingInterestMember2022-01-012022-03-310000764065us-gaap:AccumulatedForeignCurrencyAdjustmentIncludingPortionAttributableToNoncontrollingInterestMember2023-03-310000764065us-gaap:AccumulatedForeignCurrencyAdjustmentIncludingPortionAttributableToNoncontrollingInterestMember2022-03-310000764065us-gaap:AccumulatedGainLossCashFlowHedgeIncludingNoncontrollingInterestMember2022-12-310000764065us-gaap:AccumulatedGainLossCashFlowHedgeIncludingNoncontrollingInterestMember2021-12-310000764065us-gaap:AccumulatedGainLossCashFlowHedgeIncludingNoncontrollingInterestMember2023-01-012023-03-310000764065us-gaap:AccumulatedGainLossCashFlowHedgeIncludingNoncontrollingInterestMember2022-01-012022-03-310000764065us-gaap:AccumulatedGainLossCashFlowHedgeIncludingNoncontrollingInterestMember2023-03-310000764065us-gaap:AccumulatedGainLossCashFlowHedgeIncludingNoncontrollingInterestMember2022-03-310000764065us-gaap:AccumulatedDefinedBenefitPlansAdjustmentIncludingPortionAttributableToNoncontrollingInterestMember2022-12-310000764065us-gaap:AccumulatedDefinedBenefitPlansAdjustmentIncludingPortionAttributableToNoncontrollingInterestMember2021-12-310000764065us-gaap:AccumulatedDefinedBenefitPlansAdjustmentIncludingPortionAttributableToNoncontrollingInterestMember2023-01-012023-03-310000764065us-gaap:AccumulatedDefinedBenefitPlansAdjustmentIncludingPortionAttributableToNoncontrollingInterestMember2022-01-012022-03-310000764065us-gaap:AccumulatedDefinedBenefitPlansAdjustmentIncludingPortionAttributableToNoncontrollingInterestMember2023-03-310000764065us-gaap:AccumulatedDefinedBenefitPlansAdjustmentIncludingPortionAttributableToNoncontrollingInterestMember2022-03-310000764065clf:SunCokeMiddletownMemberus-gaap:VariableInterestEntityPrimaryBeneficiaryMember2023-01-012023-03-310000764065clf:SunCokeMiddletownMemberus-gaap:VariableInterestEntityPrimaryBeneficiaryMember2022-01-012022-03-310000764065clf:SunCokeMiddletownMemberus-gaap:VariableInterestEntityPrimaryBeneficiaryMember2023-03-310000764065clf:SunCokeMiddletownMemberus-gaap:VariableInterestEntityPrimaryBeneficiaryMember2022-12-310000764065us-gaap:StockCompensationPlanMember2023-01-012023-03-31
UNITED STATES
SECURITIES AND EXCHANGE COMMISSION
Washington, D.C. 20549
FORM 10-Q
| | | | | | | | | | | |
| ☒ | QUARTERLY REPORT PURSUANT TO SECTION 13 OR 15(d) OF THE SECURITIES EXCHANGE ACT OF 1934 | |
For the quarterly period ended March 31, 2023
OR
| | | | | | | | | | | |
| ☐ | TRANSITION REPORT PURSUANT TO SECTION 13 OR 15(d) OF THE SECURITIES EXCHANGE ACT OF 1934 | |
For the transition period from to .
Commission File Number: 1-8944
CLEVELAND-CLIFFS INC.
(Exact Name of Registrant as Specified in Its Charter)
| | | | | | | | | | | | | | | | | | | | |
| Ohio | | 34-1464672 | |
| (State or Other Jurisdiction of
Incorporation or Organization) | | (I.R.S. Employer
Identification No.) | |
| | | | |
| 200 Public Square, | Cleveland, | Ohio | | 44114-2315 | |
| (Address of Principal Executive Offices) | | (Zip Code) | |
Registrant’s telephone number, including area code: (216) 694-5700
Securities registered pursuant to Section 12(b) of the Act:
| | | | | | | | | | | | | | |
| Title of each class | | Trading Symbol(s) | | Name of each exchange on which registered |
| Common shares, par value $0.125 per share | | CLF | | New York Stock Exchange |
Indicate by check mark whether the registrant (1) has filed all reports required to be filed by Section 13 or 15(d) of the Securities Exchange Act of 1934 during the preceding 12 months (or for such shorter period that the registrant was required to file such reports), and (2) has been subject to such filing requirements for the past 90 days.
Yes ☒ No ☐
Indicate by check mark whether the registrant has submitted electronically every Interactive Data File required to be submitted pursuant to Rule 405 of Regulation S-T (§232.405 of this chapter) during the preceding 12 months (or for such shorter period that the registrant was required to submit such files).
Yes ☒ No ☐
Indicate by check mark whether the registrant is a large accelerated filer, an accelerated filer, a non-accelerated filer, a smaller reporting company, or an emerging growth company. See the definitions of “large accelerated filer,” “accelerated filer,” “smaller reporting company,” and "emerging growth company" in Rule 12b-2 of the Exchange Act.
| | | | | | | | | | | |
| Large accelerated filer | ☒ | Accelerated filer | ☐ |
| Non-accelerated filer | ☐ | Smaller reporting company | ☐ |
| | Emerging growth company | ☐ |
If an emerging growth company, indicate by check mark if the registrant has elected not to use the extended transition period for complying with any new or revised financial accounting standards provided pursuant to Section 13(a) of the Exchange Act. ☐
Indicate by check mark whether the registrant is a shell company (as defined in Rule 12b-2 of the Exchange Act).
Yes ☐ No ☒
The number of shares outstanding of the registrant’s common shares, par value $0.125 per share, was 515,079,211 as of April 25, 2023.
TABLE OF CONTENTS
| | | | | | | | | | | | | | | | | |
| | | Page Number |
| | | | | |
| DEFINITIONS | | | |
| | | |
| PART I - FINANCIAL INFORMATION | | | |
| ITEM 1. | FINANCIAL STATEMENTS AND SUPPLEMENTARY DATA | | | |
| | STATEMENTS OF UNAUDITED CONDENSED CONSOLIDATED FINANCIAL POSITION AS OF MARCH 31, 2023 AND DECEMBER 31, 2022 | | | |
| | STATEMENTS OF UNAUDITED CONDENSED CONSOLIDATED OPERATIONS FOR THE THREE MONTHS ENDED MARCH 31, 2023 AND 2022 | | | |
| | STATEMENTS OF UNAUDITED CONDENSED CONSOLIDATED COMPREHENSIVE INCOME (LOSS) FOR THE THREE MONTHS ENDED MARCH 31, 2023 AND 2022 | | | |
| | STATEMENTS OF UNAUDITED CONDENSED CONSOLIDATED CASH FLOWS FOR THE THREE MONTHS ENDED MARCH 31, 2023 AND 2022 | | | |
| | STATEMENTS OF UNAUDITED CONDENSED CONSOLIDATED CHANGES IN EQUITY FOR THE THREE MONTHS ENDED MARCH 31, 2023 AND 2022 | | | |
| | NOTES TO UNAUDITED CONDENSED CONSOLIDATED FINANCIAL STATEMENTS | | | |
| ITEM 2. | MANAGEMENT'S DISCUSSION AND ANALYSIS OF FINANCIAL CONDITION AND RESULTS OF OPERATIONS | | | |
| ITEM 3. | QUANTITATIVE AND QUALITATIVE DISCLOSURES ABOUT MARKET RISK | | | |
| ITEM 4. | CONTROLS AND PROCEDURES | | | |
| | | |
| PART II - OTHER INFORMATION | | | |
| ITEM 1. | LEGAL PROCEEDINGS | | | |
| ITEM 1A. | RISK FACTORS | | | |
| ITEM 2. | UNREGISTERED SALES OF EQUITY SECURITIES AND USE OF PROCEEDS | | | |
| ITEM 4. | MINE SAFETY DISCLOSURES | | | |
| ITEM 5. | OTHER INFORMATION | | | |
| ITEM 6. | EXHIBITS | | | |
| | | | | |
| SIGNATURES | | | |
| | | |
DEFINITIONS
The following abbreviations or acronyms are used in the text. References in this report to the “Company,” “we,” “us,” “our,” "Cleveland-Cliffs" and “Cliffs” are to Cleveland-Cliffs Inc. and subsidiaries, collectively. References to "$" is to United States currency.
| | | | | | | | |
| Abbreviation or acronym | | Term |
| | |
| | |
| | |
| 6.750% 2030 Senior Notes | | 6.750% Senior Guaranteed Notes due 2030 issued by Cleveland-Cliffs Inc. on April 14, 2023 in an aggregate principal amount of $750 million |
| ABL Facility | | Asset-Based Revolving Credit Agreement, dated as of March 13, 2020, among Cleveland-Cliffs Inc., the lenders party thereto from time to time and Bank of America, N.A., as administrative agent, as amended as of March 27, 2020, December 9, 2020 and December 17, 2021, and as may be further amended from time to time |
| Adjusted EBITDA | | EBITDA, excluding certain items such as EBITDA of noncontrolling interests, extinguishment of debt, acquisition-related expenses and adjustments, asset impairment and other, net |
| AOCI | | Accumulated Other Comprehensive Income (Loss) |
| ASC | | Accounting Standards Codification |
| ASU | | Accounting Standards Update |
| | |
| BOF | | Basic oxygen furnace |
| CERCLA | | Comprehensive Environmental Response, Compensation and Liability Act of 1980 |
| CHIPS Act | | The Creating Helpful Incentives to Produce Semiconductors and Science Act of 2022 |
| COVID-19 | | A novel strain of coronavirus that the World Health Organization declared a global pandemic in March 2020 |
| Dodd-Frank Act | | Dodd-Frank Wall Street Reform and Consumer Protection Act |
| EAF | | Electric arc furnace |
| EBITDA | | Earnings before interest, taxes, depreciation and amortization |
| | |
| EPA | | U.S. Environmental Protection Agency |
| EPS | | Earnings per share |
| EV | | Electric vehicle |
| Exchange Act | | Securities Exchange Act of 1934, as amended |
| FASB | | Financial Accounting Standards Board |
| | |
| FMSH Act | | Federal Mine Safety and Health Act of 1977, as amended |
| GAAP | | Accounting principles generally accepted in the United States |
| GHG | | Greenhouse gas |
| GOES | | Grain oriented electrical steel |
| HBI | | Hot briquetted iron |
| | |
| HRC | | Hot-rolled coil steel |
| Inflation Reduction Act | | Inflation Reduction Act of 2022 |
| | |
| Metric ton (mt) | | 2,205 pounds |
| MSHA | | U.S. Mine Safety and Health Administration |
| Net ton (nt) | | 2,000 pounds |
| NOES | | Non-oriented electrical steel |
| | |
| NPDES | | National Pollutant Discharge Elimination System, authorized by the Clean Water Act |
| OPEB | | Other postretirement benefits |
| Platts 62% price | | Platts IODEX 62% Fe Fines CFR North China |
| RCRA | | Resource Conservation and Recovery Act |
| | |
| SEC | | U.S. Securities and Exchange Commission |
| Section 232 | | Section 232 of the Trade Expansion Act of 1962, as amended |
| Securities Act | | Securities Act of 1933, as amended |
| SunCoke Middletown | | Middletown Coke Company, LLC, a subsidiary of SunCoke Energy, Inc. |
| | |
| | |
| | |
| U.S. | | United States of America |
| | |
| | |
| | |
| VIE | | Variable interest entity |
PART I
| | |
|
| ITEM 1. FINANCIAL STATEMENTS AND SUPPLEMENTARY DATA |
STATEMENTS OF UNAUDITED CONDENSED CONSOLIDATED FINANCIAL POSITION
CLEVELAND-CLIFFS INC. AND SUBSIDIARIES
| | | | | | | | | | | |
| (In millions, except share information) | March 31,
2023 | | December 31,
2022 |
| ASSETS | | | |
| Current assets: | | | |
| Cash and cash equivalents | $ | 59 | | | $ | 26 | |
| Accounts receivable, net | 2,216 | | | 1,960 | |
| Inventories | 4,923 | | | 5,130 | |
| Other current assets | 246 | | | 306 | |
| Total current assets | 7,444 | | | 7,422 | |
| Non-current assets: | | | |
| Property, plant and equipment, net | 8,950 | | | 9,070 | |
| Goodwill | 1,130 | | | 1,130 | |
| Pension and OPEB, asset | 370 | | | 356 | |
| Other non-current assets | 758 | | | 777 | |
| TOTAL ASSETS | $ | 18,652 | | | $ | 18,755 | |
| LIABILITIES AND EQUITY | | | |
| Current liabilities: | | | |
| Accounts payable | $ | 2,173 | | | $ | 2,186 | |
| Accrued employment costs | 388 | | | 429 | |
| Accrued expenses | 271 | | | 383 | |
| Other current liabilities | 628 | | | 551 | |
| Total current liabilities | 3,460 | | | 3,549 | |
| Non-current liabilities: | | | |
| Long-term debt | 4,559 | | | 4,249 | |
| Pension liability, non-current | 465 | | | 473 | |
| OPEB liability, non-current | 572 | | | 585 | |
| Deferred income taxes | 527 | | | 590 | |
| Other non-current liabilities | 1,276 | | | 1,267 | |
| TOTAL LIABILITIES | 10,859 | | | 10,713 | |
| Commitments and contingencies (See Note 17) | | | |
| Equity: | | | |
Common shares - par value $0.125 per share | | | |
Authorized - 1,200,000,000 shares (2022 - 1,200,000,000 shares); | | | |
Issued - 531,051,530 shares (2022 - 531,051,530 shares); | | | |
Outstanding - 515,052,745 shares (2022 - 513,340,779 shares) | 66 | | | 66 | |
| Capital in excess of par value of shares | 4,832 | | | 4,871 | |
| Retained earnings | 1,277 | | | 1,334 | |
Cost of 15,998,785 common shares in treasury (2022 - 17,710,751 shares) | (280) | | | (310) | |
| Accumulated other comprehensive income | 1,651 | | | 1,830 | |
| Total Cliffs shareholders' equity | 7,546 | | | 7,791 | |
| Noncontrolling interest | 247 | | | 251 | |
| TOTAL EQUITY | 7,793 | | | 8,042 | |
| TOTAL LIABILITIES AND EQUITY | $ | 18,652 | | | $ | 18,755 | |
The accompanying notes are an integral part of these unaudited condensed consolidated financial statements.
STATEMENTS OF UNAUDITED CONDENSED CONSOLIDATED OPERATIONS
CLEVELAND-CLIFFS INC. AND SUBSIDIARIES
| | | | | | | | | | | | |
| | Three Months Ended
March 31, |
| (In millions, except per share amounts) | | 2023 | | 2022 |
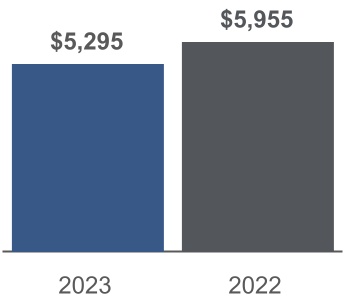
| Revenues | | $ | 5,295 | | | $ | 5,955 | |
| Operating costs: | | | | |
| Cost of goods sold | | (5,196) | | | (4,706) | |
| Selling, general and administrative expenses | | (127) | | | (122) | |
| | | | |
| Miscellaneous – net | | (3) | | | (33) | |
| Total operating costs | | (5,326) | | | (4,861) | |
| Operating income (loss) | | (31) | | | 1,094 | |
| Other income (expense): | | | | |
| Interest expense, net | | (77) | | | (77) | |
| Loss on extinguishment of debt | | — | | | (14) | |
| Net periodic benefit credits other than service cost component | | 50 | | | 49 | |
| Other non-operating income (expense) | | 2 | | | (2) | |
| Total other expense | | (25) | | | (44) | |
| Income (loss) from continuing operations before income taxes | | (56) | | | 1,050 | |
| Income tax benefit (expense) | | 13 | | | (237) | |
| Income (loss) from continuing operations | | (43) | | | 813 | |
| Income from discontinued operations, net of tax | | 1 | | | 1 | |
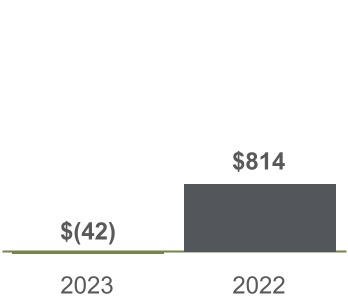
| Net income (loss) | | (42) | | | 814 | |
| Income attributable to noncontrolling interest | | (15) | | | (13) | |
| Net income (loss) attributable to Cliffs shareholders | | $ | (57) | | | $ | 801 | |
| | | | |
| Earnings (loss) per common share attributable to Cliffs shareholders - basic | | | | |
| Continuing operations | | $ | (0.11) | | | $ | 1.54 | |
| Discontinued operations | | — | | | — | |
| | $ | (0.11) | | | $ | 1.54 | |
| Earnings (loss) per common share attributable to Cliffs shareholders - diluted | | | | |
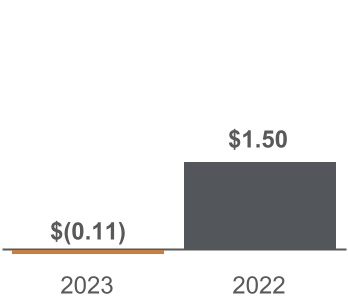
| Continuing operations | | $ | (0.11) | | | $ | 1.50 | |
| Discontinued operations | | — | | | — | |
| | $ | (0.11) | | | $ | 1.50 | |
The accompanying notes are an integral part of these unaudited condensed consolidated financial statements.
STATEMENTS OF UNAUDITED CONDENSED CONSOLIDATED COMPREHENSIVE INCOME (LOSS)
CLEVELAND-CLIFFS INC. AND SUBSIDIARIES
| | | | | | | | | | | | | | | |
| | | Three Months Ended
March 31, |
| (In millions) | | | | | 2023 | | 2022 |
| Net income (loss) | | | | | $ | (42) | | | $ | 814 | |
| Other comprehensive income (loss): | | | | | | | |
| Changes in pension and OPEB, net of tax | | | | | (27) | | | 1 | |
| Changes in derivative financial instruments, net of tax | | | | | (152) | | | 96 | |
| | | | | | | |
| Total other comprehensive income (loss) | | | | | (179) | | | 97 | |
| Comprehensive income (loss) | | | | | (221) | | | 911 | |
| Comprehensive income attributable to noncontrolling interests | | | | | (15) | | | (13) | |
| Comprehensive income (loss) attributable to Cliffs shareholders | | | | | $ | (236) | | | $ | 898 | |
The accompanying notes are an integral part of these unaudited condensed consolidated financial statements.
STATEMENTS OF UNAUDITED CONDENSED CONSOLIDATED CASH FLOWS
CLEVELAND-CLIFFS INC. AND SUBSIDIARIES
| | | | | | | | | | | |
| Three Months Ended
March 31, |
| (In millions) | 2023 | | 2022 |
| OPERATING ACTIVITIES | | | |
| Net income (loss) | $ | (42) | | | $ | 814 | |
| Adjustments to reconcile net income (loss) to net cash provided (used) by operating activities: | | | |
| Depreciation, depletion and amortization | 242 | | | 301 | |
| Impairment of long-lived assets | — | | | 29 | |
| | | |
| Deferred income taxes | (4) | | | 57 | |
| Pension and OPEB credits | (40) | | | (27) | |
| Loss on extinguishment of debt | — | | | 14 | |
| | | |
| Other | 39 | | | 25 | |
| Changes in operating assets and liabilities: | | | |
| Accounts receivable, net | (257) | | | (512) | |
| Inventories | 207 | | | (372) | |
| Income taxes | 15 | | | 180 | |
| Pension and OPEB payments and contributions | (30) | | | (60) | |
| Payables, accrued employment and accrued expenses | (90) | | | 109 | |
| Other, net | (79) | | | (25) | |
| Net cash provided (used) by operating activities | (39) | | | 533 | |
| INVESTING ACTIVITIES | | | |
| Purchase of property, plant and equipment | (188) | | | (236) | |
| | | |
| Other investing activities | 3 | | | 1 | |
| Net cash used by investing activities | (185) | | | (235) | |
| FINANCING ACTIVITIES | | | |
| | | |
| | | |
| Repurchase of common shares | — | | | (19) | |
| | | |
| | | |
| Repayments of debt | — | | | (360) | |
| Borrowings under credit facilities | 1,646 | | | 1,715 | |
| Repayments under credit facilities | (1,339) | | | (1,609) | |
| | | |
| Other financing activities | (50) | | | (38) | |
| Net cash provided (used) by financing activities | 257 | | | (311) | |
| Net increase (decrease) in cash and cash equivalents | 33 | | | (13) | |
| Cash and cash equivalents at beginning of period | 26 | | | 48 | |
| Cash and cash equivalents at end of period | $ | 59 | | | $ | 35 | |
The accompanying notes are an integral part of these unaudited condensed consolidated financial statements.
STATEMENTS OF UNAUDITED CONDENSED CONSOLIDATED CHANGES IN EQUITY
CLEVELAND-CLIFFS INC. AND SUBSIDIARIES
| | | | | | | | | | | | | | | | | | | | | | | | | | | | | | | | | | | | | | | | | | | | | | | |
| (In millions) | Number
of
Common
Shares Outstanding | | Par Value of
Common
Shares Issued | | Capital in
Excess of
Par Value
of Shares | | Retained
Earnings | | Common
Shares
in
Treasury | | AOCI | | Non-controlling Interests | | Total |
| December 31, 2022 | 513 | | | $ | 66 | | | $ | 4,871 | | | $ | 1,334 | | | $ | (310) | | | $ | 1,830 | | | $ | 251 | | | $ | 8,042 | |
| Comprehensive income (loss) | — | | | — | | | — | | | (57) | | | — | | | (179) | | | 15 | | | (221) | |
| | | | | | | | | | | | | | | |
| | | | | | | | | | | | | | | |
| Stock and other incentive plans | 2 | | | — | | | (39) | | | — | | | 30 | | | — | | | — | | | (9) | |
| | | | | | | | | | | | | | | |
| Net distributions to noncontrolling interests | — | | | — | | | — | | | — | | | — | | | — | | | (19) | | | (19) | |
| March 31, 2023 | 515 | | | $ | 66 | | | $ | 4,832 | | | $ | 1,277 | | | $ | (280) | | | $ | 1,651 | | | $ | 247 | | | $ | 7,793 | |
| | | | | | | | | | | | | | | |
| | | | | | | | | | | | | | | |
| | | | | | | | | | | | | | | |
| | | | | | | | | | | | | | | |
| | | | | | | | | | | | | | | |
| | | | | | | | | | | | | | | |
| | | | | | | | | | | | | | | |
| | | | | | | | | | | | | | | |
| | | | | | | | | | | | | | | |
| | | | | | | | | | | | | | | |
| | | | | | | | | | | | | | | |
| | | | | | | | | | | | | | | | | | | | | | | | | | | | | | | | | | | | | | | | | | | | | | | |
| (In millions) | Number
of
Common
Shares Outstanding | | Par Value of Common
Shares Issued | | Capital in
Excess of
Par Value
of Shares | | Retained
Earnings (Deficit) | | Common
Shares
in
Treasury | | AOCI | | Non-controlling Interests | | Total |
| December 31, 2021 | 500 | | | $ | 63 | | | $ | 4,892 | | | $ | (1) | | | $ | (82) | | | $ | 618 | | | $ | 284 | | | $ | 5,774 | |
| Comprehensive income | — | | | — | | | — | | | 801 | | | — | | | 97 | | | 13 | | | 911 | |
| Redemption of convertible debt | 24 | | | 3 | | | (28) | | | — | | | — | | | — | | | — | | | (25) | |
| Stock and other incentive plans | 2 | | | — | | | (16) | | | — | | | 11 | | | — | | | — | | | (5) | |
| Common stock repurchases | (1) | | | — | | | — | | | — | | | (19) | | | — | | | — | | | (19) | |
| Net distributions to noncontrolling interests | — | | | — | | | — | | | — | | | — | | | — | | | (28) | | | (28) | |
| March 31, 2022 | 525 | | | $ | 66 | | | $ | 4,848 | | | $ | 800 | | | $ | (90) | | | $ | 715 | | | $ | 269 | | | $ | 6,608 | |
| | | | | | | | | | | | | | | |
| | | | | | | | | | | | | | | |
| | | | | | | | | | | | | | | |
| | | | | | | | | | | | | | | |
| | | | | | | | | | | | | | | |
| | | | | | | | | | | | | | | |
| | | | | | | | | | | | | | | |
| | | | | | | | | | | | | | | |
| | | | | | | | | | | | | | | |
| | | | | | | | | | | | | | | |
| | | | | | | | | | | | | | | |
The accompanying notes are an integral part of these unaudited condensed consolidated financial statements.
NOTES TO CONSOLIDATED FINANCIAL STATEMENTS
CLEVELAND-CLIFFS INC. AND SUBSIDIARIES
NOTE 1 - BASIS OF PRESENTATION AND SIGNIFICANT ACCOUNTING POLICIES
BUSINESS, CONSOLIDATION AND PRESENTATION
The accompanying unaudited condensed consolidated financial statements have been prepared in accordance with SEC rules and regulations and, in the opinion of management, include all adjustments (consisting of normal recurring adjustments) necessary to present fairly the financial position, results of operations, comprehensive income, cash flows and changes in equity for the periods presented. The preparation of financial statements in conformity with GAAP requires management to make estimates and assumptions that affect the amounts reported in the financial statements and accompanying notes. Management bases its estimates on various assumptions and historical experience, which are believed to be reasonable; however, due to the inherent nature of estimates, actual results may differ significantly due to changed conditions or assumptions. The results of operations for the three months ended March 31, 2023 are not necessarily indicative of results to be expected for the year ending December 31, 2023 or any other future period. These unaudited condensed consolidated financial statements should be read in conjunction with the financial statements and notes included in our Annual Report on Form 10-K for the year ended December 31, 2022.
NATURE OF BUSINESS
We are the largest flat-rolled steel producer in North America. Founded in 1847 as a mine operator, we are also the largest manufacturer of iron ore pellets in North America. We are vertically integrated from mined raw materials, direct reduced iron and ferrous scrap to primary steelmaking and downstream finishing, stamping, tooling and tubing. We are the largest supplier of steel to the automotive industry in North America and serve a diverse range of markets due to our comprehensive offering of flat-rolled steel products. Headquartered in Cleveland, Ohio, we employ approximately 27,000 people across our operations in the United States and Canada.
BUSINESS OPERATIONS
We are organized into four operating segments based on differentiated products, Steelmaking, Tubular, Tooling and Stamping, and European Operations. We primarily operate through one reportable segment – the Steelmaking segment.
BASIS OF CONSOLIDATION
The unaudited condensed consolidated financial statements consolidate our accounts and the accounts of our wholly owned subsidiaries, all subsidiaries in which we have a controlling interest and VIEs for which we are the primary beneficiary. All intercompany transactions and balances are eliminated upon consolidation.
INVESTMENTS IN AFFILIATES
We have investments in several businesses accounted for using the equity method of accounting. These investments are included within our Steelmaking segment. We review an investment for impairment when circumstances indicate that a loss in value below its carrying amount is other than temporary.
Our investment in affiliates of $134 million and $133 million as of March 31, 2023 and December 31, 2022, respectively, was classified in Other non-current assets.
SIGNIFICANT ACCOUNTING POLICIES
A detailed description of our significant accounting policies can be found in the audited financial statements included in our Annual Report on Form 10-K for the year ended December 31, 2022 filed with the SEC. There have been no material changes in our significant accounting policies and estimates from those disclosed therein.
RECENT ACCOUNTING PRONOUNCEMENTS
ISSUED AND ADOPTED
In September 2022, the FASB issued ASU No. 2022-04, Liabilities - Supplier Finance Programs (Subtopic 405-50): Disclosure of Supplier Finance Program Obligations. This guidance requires annual and interim disclosure of the key terms of outstanding supplier finance programs and a roll-forward of the related obligations. The new standard does not affect the recognition, measurement or financial statement presentation of the supplier finance program obligations. We have adopted this standard, except for the amendment on roll-forward information, which is effective for fiscal years beginning after December 15, 2023. Refer to NOTE 2 - SUPPLEMENTARY FINANCIAL STATEMENT INFORMATION for further information.
NOTE 2 - SUPPLEMENTARY FINANCIAL STATEMENT INFORMATION
ALLOWANCE FOR CREDIT LOSSES
The following is a roll-forward of our allowance for credit losses associated with Accounts receivable, net:
| | | | | | | | | | | |
| (In millions) | 2023 | | 2022 |
| Allowance for credit losses as of January 1 | $ | (4) | | | $ | (4) | |
| Increase in allowance | (1) | | | — | |
| Allowance for credit losses as of March 31 | $ | (5) | | | $ | (4) | |
INVENTORIES
The following table presents the detail of our Inventories on the Statements of Unaudited Condensed Consolidated Financial Position:
| | | | | | | | | | | |
| (In millions) | March 31,
2023 | | December 31,
2022 |
| Product inventories | | | |
| Finished and semi-finished goods | $ | 2,919 | | | $ | 2,971 | |
| Raw materials | 1,626 | | | 1,794 | |
| Total product inventories | 4,545 | | | 4,765 | |
| Manufacturing supplies and critical spares | 378 | | | 365 | |
| Inventories | $ | 4,923 | | | $ | 5,130 | |
SUPPLY CHAIN FINANCE PROGRAMS
We negotiate payment terms directly with our suppliers for the purchase of goods and services. We currently offer voluntary supply chain finance programs that enable our suppliers to sell their Cliffs receivables to financial intermediaries, at the sole discretion of both the suppliers and financial intermediaries. No guarantees are provided by us or our subsidiaries under the supply chain finance programs. The supply chain finance programs allow our suppliers to be paid by the financial intermediaries earlier than the due date on the applicable invoice. Supply chain finance programs that extend terms or provide us an economic benefit are classified as short-term financings. As of March 31, 2023 and December 31, 2022, we had $27 million and $19 million, respectively, deemed as short-term financings that are classified in Other current liabilities. Additionally, as of March 31, 2023 and December 31, 2022, we had $87 million and $112 million, respectively, classified as Accounts payable.
CASH FLOW INFORMATION
A reconciliation of capital additions to cash paid for capital expenditures is as follows:
| | | | | | | | | | | |
| Three Months Ended
March 31, |
| (In millions) | 2023 | | 2022 |
| Capital additions | $ | 128 | | | $ | 181 | |
| Less: | | | |
| Non-cash accruals | (76) | | | (55) | |
| Right-of-use assets - finance leases | 16 | | | — | |
| | | |
| Cash paid for capital expenditures including deposits | $ | 188 | | | $ | 236 | |
Cash payments (receipts) for income taxes and interest are as follows:
| | | | | | | | | | | |
| Three Months Ended
March 31, |
| (In millions) | 2023 | | 2022 |
| Taxes paid on income | $ | 1 | | | $ | 1 | |
| Income tax refunds | (26) | | | (1) | |
Interest paid on debt obligations net of capitalized interest1 | 79 | | | 65 | |
| | | |
1 Capitalized interest was $3 million and $2 million for the three months ended March 31, 2023 and 2022, respectively. |
NOTE 3 - REVENUES
We generate our revenue through product sales, in which shipping terms indicate when we have fulfilled our performance obligations and transferred control of products to our customer. Our revenue transactions consist of a single performance obligation to transfer promised goods. Our contracts with customers define the mechanism for determining the sales price, which is generally fixed upon transfer of control, but the contracts generally do not impose a specific quantity on either party. Quantities to be delivered to the customer are determined at a point near the date of delivery through purchase orders or other written instructions we receive from the customer. Spot market sales are made through purchase orders or other written instructions. We consider our performance obligation to be complete and recognize revenue when control transfers in accordance with shipping terms.
Revenue is measured as the amount of consideration we expect to receive in exchange for transferring product. We reduce the amount of revenue recognized for estimated returns and other customer credits, such as discounts and volume rebates, based on the expected value to be realized. Payment terms are consistent with terms standard to the markets we serve. Sales taxes collected from customers are excluded from revenues.
The following table represents our Revenues by market:
| | | | | | | | | | | | | | | |
| Three Months Ended
March 31, | | |
| (In millions) | 2023 | | 2022 | | | | |
| Steelmaking: | | | | | | | |
| Automotive | $ | 1,870 | | | $ | 1,607 | | | | | |
| Infrastructure and manufacturing | 1,297 | | | 1,542 | | | | | |
| Distributors and converters | 1,258 | | | 1,829 | | | | | |
Steel producers | 701 | | | 816 | | | | | |
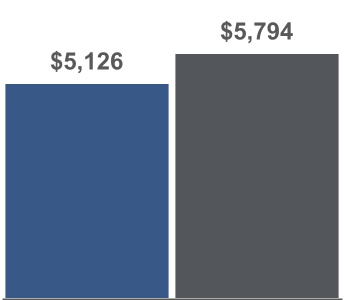
| Total Steelmaking | 5,126 | | | 5,794 | | | | | |
| Other Businesses: | | | | | | | |
| Automotive | 139 | | | 122 | | | | | |
| Infrastructure and manufacturing | 10 | | | 15 | | | | | |
| Distributors and converters | 20 | | | 24 | | | | | |
| Total Other Businesses | 169 | | | 161 | | | | | |
| Total revenues | $ | 5,295 | | | $ | 5,955 | | | | | |
The following tables represent our Revenues by product line:
| | | | | | | | | | | | | | | |
| | | Three Months Ended
March 31, |
| (In millions) | | | | | 2023 | | 2022 |
| Steelmaking: | | | | | | | |
| Hot-rolled steel | | | | | $ | 1,121 | | | $ | 1,194 | |
| Cold-rolled steel | | | | | 639 | | | 984 | |
| Coated steel | | | | | 1,617 | | | 1,775 | |
| Stainless and electrical steel | | | | | 574 | | | 551 | |
| Plate | | | | | 331 | | | 421 | |
| Slab and other steel products | | | | | 327 | | | 334 | |
| Other | | | | | 517 | | | 535 | |
| Total Steelmaking | | | | | 5,126 | | | 5,794 | |
| Other Businesses: | | | | | | | |
| Other | | | | | 169 | | | 161 | |
| Total revenues | | | | | $ | 5,295 | | | $ | 5,955 | |
NOTE 4 - SEGMENT REPORTING
We are vertically integrated from mined raw materials and direct reduced iron and ferrous scrap to primary steelmaking and downstream finishing, stamping, tooling and tubing. We are organized into four operating segments based on our differentiated products – Steelmaking, Tubular, Tooling and Stamping, and European Operations. We have one reportable segment – Steelmaking. The operating segment results of our Tubular, Tooling and Stamping, and European Operations that do not constitute reportable segments are combined and disclosed in the Other Businesses category. Our Steelmaking segment operates as the largest flat-rolled steel producer supported by being the largest iron ore pellet producer as well as a leading prime scrap processor in North America, primarily serving the automotive, distributors and converters, and infrastructure and manufacturing markets. Our Other Businesses primarily include the operating segments that provide customer solutions with carbon and stainless steel tubing products, advanced-engineered solutions, tool design and build, hot- and cold-stamped steel components, and complex assemblies. All intersegment transactions were eliminated in consolidation.
We evaluate performance on an operating segment basis, as well as a consolidated basis, based on Adjusted EBITDA, which is a non-GAAP measure. This measure is used by management, investors, lenders and other external users of our financial statements to assess our operating performance and to compare operating performance to other companies in the steel industry. In addition, management believes Adjusted EBITDA is a useful measure to assess the earnings power of the business without the impact of capital structure and can be used to assess our ability to service debt and fund future capital expenditures in the business.
Our results by segment are as follows:
| | | | | | | | | | | |
| Three Months Ended
March 31, |
| (In millions) | 2023 | | 2022 |
| Revenues: | | | |
| Steelmaking | $ | 5,126 | | | $ | 5,794 | |
| Other Businesses | 169 | | | 161 | |
| Total revenues | $ | 5,295 | | | $ | 5,955 | |
| | | |
| Adjusted EBITDA: | | | |
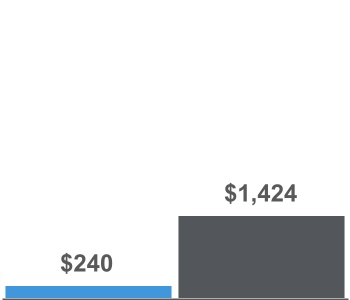
| Steelmaking | $ | 240 | | | $ | 1,424 | |
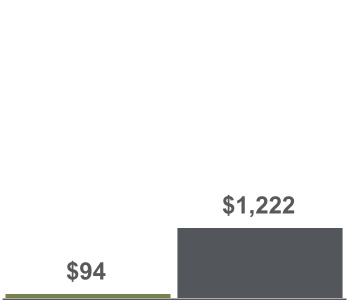
| Other Businesses | 8 | | | 29 | |
| Eliminations | (5) | | | (1) | |
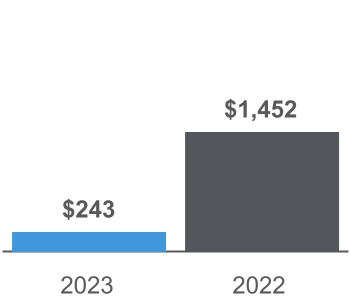
| Total Adjusted EBITDA | $ | 243 | | | $ | 1,452 | |
The following table provides a reconciliation of our consolidated Net income (loss) to total Adjusted EBITDA:
| | | | | | | | | | | |
| Three Months Ended
March 31, |
| (In millions) | 2023 | | 2022 |
| Net income (loss) | $ | (42) | | | $ | 814 | |
| Less: | | | |
| Interest expense, net | (77) | | | (77) | |
| Income tax benefit (expense) | 13 | | | (237) | |
| Depreciation, depletion and amortization | (242) | | | (301) | |
| 264 | | | 1,429 | |
| Less: | | | |
EBITDA of noncontrolling interests1 | 23 | | | 22 | |
| Loss on extinguishment of debt | — | | | (14) | |
| Asset impairment | — | | | (29) | |
| | | |
| Other, net | (2) | | | (2) | |
| Total Adjusted EBITDA | $ | 243 | | | $ | 1,452 | |
| | | |
1 EBITDA of noncontrolling interests includes the following: |
| Net income attributable to noncontrolling interests | $ | 15 | | | $ | 13 | |
| Depreciation, depletion and amortization | 8 | | | 9 | |
| EBITDA of noncontrolling interests | $ | 23 | | | $ | 22 | |
The following summarizes our assets by segment:
| | | | | | | | | | | |
| (In millions) | March 31,
2023 | | December 31,
2022 |
| Assets: | | | |
| Steelmaking | $ | 18,018 | | | $ | 18,070 | |
| Other Businesses | 312 | | | 315 | |
| Total segment assets | 18,330 | | | 18,385 | |
| Corporate/Eliminations | 322 | | | 370 | |
| Total assets | $ | 18,652 | | | $ | 18,755 | |
The following table summarizes our depreciation, depletion and amortization and capital additions by segment:
| | | | | | | | | | | |
| Three Months Ended
March 31, |
| (In millions) | 2023 | | 2022 |
| Depreciation, depletion and amortization: | | | |
| Steelmaking | $ | (231) | | | $ | (291) | |
| Other Businesses | (11) | | | (10) | |
| Total depreciation, depletion and amortization | $ | (242) | | | $ | (301) | |
| | | |
Capital additions1: | | | |
| Steelmaking | $ | 127 | | | $ | 175 | |
| Other Businesses | 1 | | | 6 | |
| | | |
| Total capital additions | $ | 128 | | | $ | 181 | |
| | | |
1 Refer to NOTE 2 - SUPPLEMENTARY FINANCIAL STATEMENT INFORMATION for additional information. |
NOTE 5 - PROPERTY, PLANT AND EQUIPMENT
The following table indicates the carrying value of each of the major classes of our depreciable assets:
| | | | | | | | | | | |
| (In millions) | March 31,
2023 | | December 31,
2022 |
| Land, land improvements and mineral rights | $ | 1,390 | | | $ | 1,388 | |
| Buildings | 927 | | | 921 | |
| Equipment | 9,359 | | | 9,289 | |
| Other | 244 | | | 238 | |
| Construction in progress | 580 | | | 552 | |
Total property, plant and equipment1 | 12,500 | | | 12,388 | |
| Allowance for depreciation and depletion | (3,550) | | | (3,318) | |
| Property, plant and equipment, net | $ | 8,950 | | | $ | 9,070 | |
| | | |
1 Includes right-of-use assets related to finance leases of $424 million and $408 million as of March 31, 2023 and December 31, 2022, respectively. |
We recorded depreciation and depletion expense of $239 million and $298 million for the three months ended March 31, 2023 and 2022, respectively. Depreciation and depletion expense for the three months ended March 31, 2022 includes $68 million of accelerated depreciation related to the indefinite idle of the Indiana Harbor #4 blast furnace.
NOTE 6 - GOODWILL AND INTANGIBLE ASSETS AND LIABILITIES
GOODWILL
The following is a summary of Goodwill by segment:
| | | | | | | | | | | |
| (In millions) | March 31,
2023 | | December 31,
2022 |
| Steelmaking | $ | 956 | | | $ | 956 | |
| Other Businesses | 174 | | | 174 | |
| Total goodwill | $ | 1,130 | | | $ | 1,130 | |
INTANGIBLE ASSETS AND LIABILITIES
The following is a summary of our intangible assets and liabilities:
| | | | | | | | | | | | | | | | | | | | | | | | | | | | | | | | | | | |
| March 31, 2023 | | December 31, 2022 |
| (In millions) | Gross Amount | | Accumulated Amortization | | Net Amount | | Gross Amount | | Accumulated Amortization | | Net Amount |
Intangible assets1: | | | | | | | | | | | |
| Customer relationships | $ | 90 | | | $ | (15) | | | $ | 75 | | | $ | 90 | | | $ | (13) | | | $ | 77 | |
| Developed technology | 60 | | | (11) | | | 49 | | | 60 | | | (10) | | | 50 | |
| Trade names and trademarks | 18 | | | (4) | | | 14 | | | 18 | | | (4) | | | 14 | |
| Mining permits | 72 | | | (27) | | | 45 | | | 72 | | | (27) | | | 45 | |
| Supplier relationships | 29 | | | (2) | | | 27 | | | 29 | | | (1) | | | 28 | |
| Total intangible assets | $ | 269 | | | $ | (59) | | | $ | 210 | | | $ | 269 | | | $ | (55) | | | $ | 214 | |
Intangible liabilities2: | | | | | | | | | | | |
| Above-market supply contracts | $ | (71) | | | $ | 20 | | | $ | (51) | | | $ | (71) | | | $ | 19 | | | $ | (52) | |
| | | | | | | | | | | |
1 Intangible assets are classified as Other non-current assets. Amortization related to mining permits is recognized in Cost of goods sold. Amortization of all other intangible assets is recognized in Selling, general and administrative expenses. |
2 Intangible liabilities are classified as Other non-current liabilities. Amortization of all intangible liabilities is recognized in Cost of goods sold. |
Amortization expense related to intangible assets was $4 million for both the three months ended March 31, 2023 and 2022. Estimated future amortization expense is $9 million for the remainder of 2023 and $13 million annually for the years 2024 through 2028.
Income from amortization related to the intangible liabilities was $1 million for both the three months ended March 31, 2023 and 2022. Estimated future income from amortization is $4 million for the remainder of 2023 and $5 million annually for the years 2024 through 2028.
NOTE 7 - DEBT AND CREDIT FACILITIES
The following represents a summary of our long-term debt:
| | | | | | | | | | | | | | | | | | | | | | | | | | |
| (In millions) |
| Debt Instrument | | Issuer1 | | Annual Effective
Interest Rate | | March 31,
2023 | | December 31,
2022 |
| Senior Secured Notes: | | | | | | | | |
6.750% 2026 Senior Secured Notes | | Cliffs | | 6.99% | | $ | 829 | | | $ | 829 | |
| Senior Unsecured Notes: | | | | | | | | |
7.000% 2027 Senior Notes | | Cliffs | | 9.24% | | 73 | | | 73 | |
7.000% 2027 AK Senior Notes | | AK Steel | | 9.24% | | 56 | | | 56 | |
5.875% 2027 Senior Notes | | Cliffs | | 6.49% | | 556 | | | 556 | |
4.625% 2029 Senior Notes | | Cliffs | | 4.63% | | 368 | | | 368 | |
4.875% 2031 Senior Notes | | Cliffs | | 4.88% | | 325 | | | 325 | |
6.250% 2040 Senior Notes | | Cliffs | | 6.34% | | 235 | | | 235 | |
| ABL Facility | | Cliffs2 | | Variable3 | | 2,171 | | | 1,864 | |
| Total principal amount | | | | | | 4,613 | | | 4,306 | |
| Unamortized discounts and issuance costs | | | | | | (54) | | | (57) | |
| Total long-term debt | | | | | | $ | 4,559 | | | $ | 4,249 | |
| | | | | | | | |
| | | | | | | | |
| | | | | | | | |
1 Unless otherwise noted, references in this column and throughout this NOTE 7 - DEBT AND CREDIT FACILITIES to "Cliffs" are to Cleveland-Cliffs Inc., and references to "AK Steel" are to AK Steel Corporation (n/k/a Cleveland-Cliffs Steel Corporation). |
2 Refers to Cleveland-Cliffs Inc. as borrower under our ABL Facility. |
3 Our ABL Facility annual effective interest rate was 6.40% and 5.60%, respectively, as of March 31, 2023 and December 31, 2022. |
Subsequent to the quarter ended March 31, 2023, we issued $750 million aggregate principal amount of 6.750% 2030 Senior Notes. We used the net proceeds from the offering to repay a portion of the borrowings under our ABL Facility. Refer to NOTE 18 - SUBSEQUENT EVENTS for further information.
ABL FACILITY
As of March 31, 2023, we were in compliance with the ABL Facility liquidity requirements and, therefore, the springing financial covenant requiring a minimum fixed charge coverage ratio of 1.0 to 1.0 was not applicable.
The following represents a summary of our borrowing capacity under the ABL Facility:
| | | | | | | | |
| (In millions) | | March 31,
2023 |
Available borrowing base on ABL Facility1 | | $ | 4,500 | |
| Borrowings | | (2,171) | |
Letter of credit obligations2 | | (147) | |
| Borrowing capacity available | | $ | 2,182 | |
| | |
1 As of March 31, 2023, the ABL Facility has a maximum available borrowing base of $4.5 billion. The borrowing base is determined by applying customary advance rates to eligible accounts receivable, inventory and certain mobile equipment. |
2 We issued standby letters of credit with certain financial institutions in order to support business obligations, including, but not limited to, workers' compensation, employee severance, insurance, operating agreements and environmental obligations. |
DEBT MATURITIES
The following represents a summary of our maturities of debt instruments based on the principal amounts outstanding at March 31, 2023 (in millions):
| | | | | | | | | | | | | | | | | | | | | | | | | | | | | | | | | | | | | | |
| 2023 | | 2024 | | 2025 | | 2026 | | 2027 | | Thereafter | | Total |
| $ | — | | | $ | — | | | $ | 2,171 | | | $ | 829 | | | $ | 685 | | | $ | 928 | | | $ | 4,613 | |
NOTE 8 - PENSIONS AND OTHER POSTRETIREMENT BENEFITS
We offer defined benefit pension plans, defined contribution pension plans and OPEB plans to a significant portion of our employees and retirees. Benefits are also provided through multiemployer plans for certain union members.
The following are the components of defined benefit pension and OPEB costs (credits):
DEFINED BENEFIT PENSION COSTS (CREDITS)
| | | | | | | | | | | | | | | |
| | | Three Months Ended
March 31, |
| (In millions) | | | | | 2023 | | 2022 |
| Service cost | | | | | $ | 8 | | | $ | 12 | |
| Interest cost | | | | | 59 | | | 32 | |
| Expected return on plan assets | | | | | (79) | | | (92) | |
| Amortization: | | | | | | | |
| Prior service costs | | | | | 4 | | | — | |
| Net actuarial loss | | | | | 1 | | | 4 | |
| Net periodic benefit credits | | | | | $ | (7) | | | $ | (44) | |
OPEB COSTS (CREDITS)
| | | | | | | | | | | | | | | |
| | | Three Months Ended
March 31, |
| (In millions) | | | | | 2023 | | 2022 |
| Service cost | | | | | $ | 2 | | | $ | 11 | |
| Interest cost | | | | | 16 | | | 20 | |
| Expected return on plan assets | | | | | (11) | | | (10) | |
| Amortization: | | | | | | | |
| Prior service credits | | | | | (4) | | | — | |
| Net actuarial gain | | | | | (36) | | | (3) | |
| Net periodic benefit costs (credits) | | | | | $ | (33) | | | $ | 18 | |
Based on funding requirements, we made no defined benefit pension contributions for the three months ended March 31, 2023 and March 31, 2022. Based on funding requirements, we made no contributions to our voluntary employee benefit association trust plans for the three months ended March 31, 2023. We made contributions of $28 million to our voluntary employee benefit association trust plans for the three months ended March 31, 2022.
NOTE 9 - INCOME TAXES
Our 2023 estimated annual effective tax rate before discrete items as of March 31, 2023 is 22%. The estimated annual effective tax rate exceeds the U.S. statutory rate of 21%, as state income tax expense exceeds the percentage depletion in excess of cost depletion. The 2022 estimated annual effective tax rate before discrete items as of March 31, 2022 was 22%.
NOTE 10 - ASSET RETIREMENT OBLIGATIONS
The accrued closure obligation provides for contractual and legal obligations related to our indefinitely idled and closed operations and for the eventual closure of our active operations. The closure date for each of our active mine sites was determined based on the exhaustion date of the remaining mineral reserves, and the amortization of the related asset and accretion of the liability is recognized over the estimated mine lives. The closure date and expected timing of the capital requirements to meet our obligations for our indefinitely idled or closed mines is determined based on the unique circumstances of each property. For indefinitely idled or closed mines, the accretion of the liability is recognized over the anticipated timing of remediation. As the majority of our asset retirement obligations at our steelmaking operations have indeterminate settlement dates, asset retirement obligations have been recorded at present values using estimated ranges of the economic lives of the underlying assets.
The following is a summary of our asset retirement obligations:
| | | | | | | | | | | |
| (In millions) | March 31,
2023 | | December 31,
2022 |
Asset retirement obligations1 | $ | 524 | | | $ | 520 | |
| Less: current portion | 24 | | | 21 | |
| Long-term asset retirement obligations | $ | 500 | | | $ | 499 | |
| | | |
1 Includes $279 million and $277 million related to our active operations as of March 31, 2023 and December 31, 2022, respectively. |
The following is a roll forward of our asset retirement obligation liability:
| | | | | | | | | | | |
| (In millions) | 2023 | | 2022 |
| Asset retirement obligation as of January 1 | $ | 520 | | | $ | 449 | |
| Accretion expense | 8 | | | 7 | |
| | | |
| Revision in estimated cash flows | — | | | 7 | |
| Remediation payments | (4) | | | (3) | |
| Asset retirement obligation as of March 31 | $ | 524 | | | $ | 460 | |
NOTE 11 - FAIR VALUE MEASUREMENTS
The carrying values of certain financial instruments (e.g., Accounts receivable, net, Accounts payable and Other current liabilities) approximate fair value and, therefore, have been excluded from the table below. See NOTE 12 - DERIVATIVE INSTRUMENTS AND HEDGING for information on our derivative instruments, which are accounted for at fair value on a recurring basis.
A summary of the carrying value and fair value of other financial instruments were as follows:
| | | | | | | | | | | | | | | | | | | | | | | | | | | | | |
| | | March 31, 2023 | | December 31, 2022 |
| (In millions) | Classification | | Carrying
Value | | Fair
Value | | Carrying
Value | | Fair
Value |
| Senior notes | Level 1 | | $ | 2,388 | | | $ | 2,356 | | | $ | 2,385 | | | $ | 2,311 | |
| ABL Facility - outstanding balance | Level 2 | | 2,171 | | | 2,171 | | | 1,864 | | | 1,864 | |
| Total | | | $ | 4,559 | | | $ | 4,527 | | | $ | 4,249 | | | $ | 4,175 | |
The valuation of financial assets classified in Level 2 were determined using a market approach based upon quoted prices for similar assets in active markets or other inputs that were observable.
NOTE 12 - DERIVATIVE INSTRUMENTS AND HEDGING
We are exposed to fluctuations in market prices of raw materials and energy sources. We may use cash-settled commodity swaps to hedge the market risk associated with the purchase of certain of our raw materials and energy requirements. Our hedging strategy is to reduce the effect on earnings from the price volatility of these various commodity exposures, including timing differences between when we incur raw material commodity costs and when we receive sales surcharges from our customers based on those raw materials.
Our commodity contracts are designated as cash flow hedges for accounting purposes, and we record the gains and losses for the derivatives in Accumulated other comprehensive income until we reclassify them into Cost of goods sold when we recognize the associated underlying operating costs. Refer to NOTE 14 - ACCUMULATED OTHER COMPREHENSIVE INCOME for further information.
Our commodity contracts are classified as Level 2 as values were determined using a market approach based upon quoted prices for similar assets in active markets or other inputs that were observable.
The following table presents the notional amount of our outstanding hedge contracts:
| | | | | | | | | | | | | | | | | | | | | | | | | | |
| | | | | | Notional Amount |
| Commodity Contracts | | Unit of Measure | | Maturity Dates | | March 31,
2023 | | December 31,
2022 |
| Natural Gas | | MMBtu | | April 2023 - November 2025 | | 148,340,000 | | | 127,790,000 | |
| | | | | | | | |
| Electricity | | Megawatt hours | | April 2023 - January 2025 | | 2,040,206 | | | 432,043 | |
| Tin | | Metric tons | | April 2023 - December 2023 | | 135 | | | 180 | |
The following table presents the fair value of our cash flow hedges and the classification in the Statements of Unaudited Condensed Consolidated Financial Position:
| | | | | | | | | | | |
| Balance Sheet Location (In millions) | March 31,
2023 | | December 31,
2022 |
| Other current assets | $ | 1 | | | $ | 15 | |
| Other non-current assets | 11 | | | 30 | |
| Other current liabilities | (141) | | | (87) | |
| Other non-current liabilities | (21) | | | (10) | |
NOTE 13 - CAPITAL STOCK
SHARE REPURCHASE PROGRAM
On February 10, 2022, our Board of Directors authorized a program to repurchase outstanding common shares in the open market or in privately negotiated transactions, which may include purchases pursuant to Rule 10b5-1 plans or accelerated share repurchases, up to a maximum of $1 billion. We are not obligated to make any purchases and the program may be suspended or discontinued at any time. The share repurchase program does not have a specific expiration date. During the three months ended March 31, 2023, we had no share buybacks. During the three months ended March 31, 2022, we repurchased 1 million common shares at a cost of $19 million in the aggregate. As of March 31, 2023, there was $760 million remaining under the authorization.
PREFERRED STOCK
We have 3 million shares of Serial Preferred Stock, Class A, without par value, authorized and 4 million shares of Serial Preferred Stock, Class B, without par value, authorized; no preferred shares are issued or outstanding.
NOTE 14 - ACCUMULATED OTHER COMPREHENSIVE INCOME
The following tables reflect the changes in Accumulated other comprehensive income related to Cliffs shareholders’ equity:
| | | | | | | | | | | | | | | |
| | | Three Months Ended
March 31, |
| (In millions) | | | | | 2023 | | 2022 |
| Foreign Currency Translation | | | | | | | |
| Beginning balance | | | | | $ | (1) | | | $ | 1 | |
| Other comprehensive loss before reclassifications | | | | | — | | | — | |
| Ending balance | | | | | $ | (1) | | | $ | 1 | |
| | | | | | | |
| Derivative Instruments | | | | | | | |
| Beginning balance | | | | | $ | (16) | | | $ | 68 | |
| Other comprehensive income (loss) before reclassifications | | | | | (177) | | | 168 | |
| Income tax | | | | | 44 | | | (39) | |
| Other comprehensive income (loss) before reclassifications, net of tax | | | | | (133) | | | 129 | |
Gains reclassified from AOCI to net income (loss)1 | | | | | (25) | | | (42) | |
Income tax expense2 | | | | | 6 | | | 9 | |
| Net gains reclassified from AOCI to net income (loss) | | | | | (19) | | | (33) | |
| Ending balance | | | | | $ | (168) | | | $ | 164 | |
| | | | | | | |
| Pension and OPEB | | | | | | | |
| Beginning balance | | | | | $ | 1,847 | | | $ | 549 | |
| | | | | | | |
| | | | | | | |
| | | | | | | |
Losses (gains) reclassified from AOCI to net income (loss)3 | | | | | (35) | | | 1 | |
Income tax expense2 | | | | | 8 | | | — | |
| Net losses (gains) reclassified from AOCI to net income (loss) | | | | | (27) | | | 1 | |
| Ending balance | | | | | $ | 1,820 | | | $ | 550 | |
| | | | | | | |
| Total AOCI Ending Balance | | | | | $ | 1,651 | | | $ | 715 | |
| | | | | | | |
1 Amounts recognized in Cost of goods sold in the Statements of Unaudited Condensed Consolidated Operations. |
2 Amounts recognized in Income tax benefit (expense) in the Statements of Unaudited Condensed Consolidated Operations. |
3 Amounts recognized in Net periodic benefit credits other than service cost component in the Statements of Unaudited Condensed Consolidated Operations. |
NOTE 15 - VARIABLE INTEREST ENTITIES
SUNCOKE MIDDLETOWN
We purchase all the coke and electrical power generated from SunCoke Middletown’s plant under long-term supply agreements and have committed to purchase all the expected production from the facility through 2032. We consolidate SunCoke Middletown as a VIE because we are the primary beneficiary despite having no ownership interest in SunCoke Middletown. SunCoke Middletown had income before income taxes of $17 million and $15 million for the three months ended March 31, 2023 and 2022, respectively, that was included in our consolidated income before income taxes.
The assets of the consolidated VIE can only be used to settle the obligations of the consolidated VIE and not obligations of the Company. The creditors of SunCoke Middletown do not have recourse to the assets or general credit of the Company to satisfy liabilities of the VIE. The Statements of Unaudited Condensed Consolidated Financial Position includes the following amounts for SunCoke Middletown:
| | | | | | | | | | | |
| (In millions) | March 31,
2023 | | December 31,
2022 |
| | | |
| Inventories | $ | 34 | | | $ | 28 | |
| Property, plant and equipment, net | 285 | | | 288 | |
| Accounts payable | (25) | | | (19) | |
| Other assets (liabilities), net | (26) | | | (27) | |
| Noncontrolling interests | (268) | | | (270) | |
NOTE 16 - EARNINGS PER SHARE
The following table summarizes the computation of basic and diluted EPS:
| | | | | | | | | | | | | | | |
| | | Three Months Ended
March 31, |
| (In millions, except per share amounts) | | | | | 2023 | | 2022 |
| Income (loss) from continuing operations | | | | | $ | (43) | | | $ | 813 | |
| Income from continuing operations attributable to noncontrolling interest | | | | | (15) | | | (13) | |
| Net income (loss) from continuing operations attributable to Cliffs shareholders | | | | | (58) | | | 800 | |
| Income from discontinued operations, net of tax | | | | | 1 | | | 1 | |
| Net income (loss) attributable to Cliffs shareholders | | | | | $ | (57) | | | $ | 801 | |
| | | | | | | |
| Weighted average number of shares: | | | | | | | |
| Basic | | | | | 515 | | 521 |
| | | | | | | |
| Convertible senior notes | | | | | — | | 7 |
Employee stock plans1 | | | | | — | | 4 |
| Diluted | | | | | 515 | | 532 |
| | | | | | | |
| Earnings (loss) per common share attributable to Cliffs shareholders - basic: | | | | | | | |
| Continuing operations | | | | | $ | (0.11) | | | $ | 1.54 | |
| Discontinued operations | | | | | — | | | — | |
| | | | | $ | (0.11) | | | $ | 1.54 | |
| | | | | | | |
| Earnings (loss) per common share attributable to Cliffs shareholders - diluted: | | | | | | | |
| Continuing operations | | | | | $ | (0.11) | | | $ | 1.50 | |
| Discontinued operations | | | | | — | | | — | |
| | | | | $ | (0.11) | | | $ | 1.50 | |
| | | | | | | |
1 For the three months ended March 31, 2023, we had 1 million shares related to employee stock plans that were excluded from the diluted EPS calculation as they were anti-dilutive. |
NOTE 17 - COMMITMENTS AND CONTINGENCIES
PURCHASE COMMITMENTS
We purchase portions of the principal raw materials required for our steel manufacturing operations under annual and multi-year agreements, some of which have minimum quantity requirements. We also use large volumes of natural gas, electricity and industrial gases in our steel manufacturing operations. We negotiate most of our purchases of chrome, industrial gases and a portion of our electricity under multi-year agreements. Our purchases of coke are made under annual or multi-year agreements with periodic price adjustments. We typically purchase coal under annual fixed-price agreements. We also purchase certain transportation services under multi-year contracts with minimum quantity requirements.
CONTINGENCIES
We are currently the subject of, or party to, various claims and legal proceedings incidental to our current and historical operations. These claims and legal proceedings are subject to inherent uncertainties and unfavorable rulings could occur. An unfavorable ruling could include monetary damages, additional funding requirements or an injunction. If an unfavorable ruling were to occur, there exists the possibility of a material adverse effect on our financial position and results of operations for the period in which the ruling occurs or future periods. However, based on currently available information we do not believe that any pending claims or legal proceedings will result in a material adverse effect in relation to our consolidated financial statements.
ENVIRONMENTAL CONTINGENCIES
Although we believe our operating practices have been consistent with prevailing industry standards, hazardous materials may have been released at operating sites or third-party sites in the past, including operating sites that we no longer own. If we reasonably can, we estimate potential remediation expenditures for those sites where future remediation efforts are probable based on identified conditions, regulatory requirements, or contractual obligations arising from the sale of a business or facility. For sites involving government required investigations, we typically make an estimate of potential remediation expenditures only after the investigation is complete and when we better understand the nature and scope of the remediation. In general, the material factors in these estimates include the costs associated with investigations, delineations, risk assessments, remedial work, governmental response and oversight, site monitoring, and preparation of reports to the appropriate environmental agencies.
The following is a summary of our environmental obligations:
| | | | | | | | | | | |
| (In millions) | March 31,
2023 | | December 31,
2022 |
| Environmental obligations | $ | 145 | | | $ | 141 | |
| Less: current portion | 28 | | | 23 | |
| Long-term environmental obligations | $ | 117 | | | $ | 118 | |
We cannot predict the ultimate costs for each site with certainty because of the evolving nature of the investigation and remediation process. Rather, to estimate the probable costs, we must make certain assumptions. The most significant of these assumptions is for the nature and scope of the work that will be necessary to investigate and remediate a particular site and the cost of that work. Other significant assumptions include the cleanup technology that will be used, whether and to what extent any other parties will participate in paying the investigation and remediation costs, reimbursement of past response costs and future oversight costs by governmental agencies, and the reaction of the governing environmental agencies to the proposed work plans. Costs for future investigation and remediation are not discounted to their present value, unless the amount and timing of the cash disbursements are readily known. To the extent that we have been able to reasonably estimate future liabilities, we do not believe that there is a reasonable possibility that we will incur a loss or losses that exceed the amounts we accrued for the environmental matters discussed below that would, either individually or in the aggregate, have a material adverse effect on our consolidated financial condition, results of operations or cash flows. However, since we recognize amounts in the consolidated financial statements in accordance with GAAP that exclude potential losses that are not probable or that may not be currently estimable, the ultimate costs of these environmental matters may be higher than the liabilities we currently have recorded in our consolidated financial statements.
Pursuant to RCRA, which governs the treatment, handling and disposal of hazardous waste, the EPA and authorized state environmental agencies may conduct inspections of RCRA-regulated facilities to identify areas where there have been releases of hazardous waste or hazardous constituents into the environment and may order the facilities to take corrective action to remediate such releases. Likewise, the EPA or the states may require closure or post-closure care of residual, industrial and hazardous waste management units. Environmental regulators have the authority to inspect all of our facilities. While we cannot predict the future actions of these regulators, it is possible that they may identify conditions in future inspections of these facilities that they believe require corrective action.
Pursuant to CERCLA, the EPA and state environmental authorities have conducted site investigations at some of our facilities and other third-party facilities, portions of which previously may have been used for disposal of materials that are currently regulated. The results of these investigations are still pending, and we could be directed to spend funds for remedial activities at the former disposal areas. Because of the uncertain status of these investigations, however, we cannot reasonably predict whether or when such spending might be required or its magnitude.
BURNS HARBOR WATER ISSUES
In August 2019, ArcelorMittal Burns Harbor LLC (n/k/a Cleveland-Cliffs Burns Harbor LLC) suffered a loss of the blast furnace cooling water recycle system, which led to the discharge of cyanide and ammonia in excess of the Burns Harbor plant's NPDES permit limits. Since that time, the facility has taken numerous steps to prevent recurrence and maintain compliance with its NPDES permit. We engaged in settlement discussions with the U.S. Department of Justice, the EPA and the State of Indiana to resolve any alleged violations of environmental laws or regulations arising out of the August 2019 event. Later stages of the settlement discussions included the Environmental Law and Policy Center (ELPC) and Hoosier Environmental Council (HEC), which had filed a lawsuit on December 20, 2019 in the U.S. District Court for the Northern District of Indiana alleging violations resulting from the August 2019 event and other Clean Water Act claims. On February 14, 2022, the United States and the State of Indiana filed a complaint and a proposed consent decree, and on April 21, 2022, the United States, with the consent of all of the parties, filed a motion seeking final approval of the consent decree from the court. The consent decree was approved by the court with an effective date of May 6, 2022. The consent decree requires specified enhancements to the mill's wastewater treatment systems and required us to pay a $3 million civil penalty, along with other terms and conditions. Other parties to the consent decree include the United States, the State of Indiana, ELPC and HEC. The ELPC/HEC civil litigation was dismissed with prejudice on May 12, 2022. In addition, ArcelorMittal Burns Harbor LLC was served with a subpoena on December 5, 2019, from the United States District Court for the Northern District of Indiana, relating to the August 2019 event and has responded to the subpoena requests, including follow-up requests. With the resolution of monetary sanctions and injunctive relief requirements under the consent decree, we do not believe that the costs to resolve any other third-party claims, including potential natural resource damages claims, that may arise out of the August 2019 event are likely to have, individually or in the aggregate, a material adverse effect on our consolidated financial condition, results of operations or cash flows.
In addition to the foregoing matters, we are or may be involved in proceedings with various regulatory authorities that may require us to pay fines, comply with more rigorous standards or other requirements or incur capital and operating expenses for environmental compliance. We believe that the ultimate disposition of any such proceedings will not have, individually or in the aggregate, a material adverse effect on our consolidated financial condition, results of operations or cash flows.
TAX MATTERS
The calculation of our tax liabilities involves dealing with uncertainties in the application of complex tax regulations. We recognize liabilities for anticipated tax audit issues based on our estimate of whether, and the extent to which, additional taxes will be due. If
we ultimately determine that payment of these amounts is unnecessary, we reverse the liability and recognize a tax benefit during the period in which we determine that the liability is no longer necessary. We also recognize tax benefits to the extent that it is more likely than not that our positions will be sustained when challenged by the taxing authorities. To the extent we prevail in matters for which liabilities have been established, or are required to pay amounts in excess of our liabilities, our effective tax rate in a given period could be materially affected. An unfavorable tax settlement would require use of our cash and result in an increase in our effective tax rate in the year of resolution. A favorable tax settlement would be recognized as a reduction in our effective tax rate in the year of resolution.
OTHER CONTINGENCIES
In addition to the matters discussed above, there are various pending and potential claims against us and our subsidiaries involving product liability, personal injury, commercial, employee benefits and other matters arising in the ordinary course of business. Because of the considerable uncertainties that exist for any claim, it is difficult to reliably or accurately estimate what the amount of a loss would be if a claimant prevails. If material assumptions or factual understandings we rely on to evaluate exposure for these contingencies prove to be inaccurate or otherwise change, we may be required to record a liability for an adverse outcome. If, however, we have reasonably evaluated potential future liabilities for all of these contingencies, including those described more specifically above, it is our opinion, unless we otherwise noted, that the ultimate liability from these contingencies, individually or in the aggregate, should not have a material adverse effect on our consolidated financial position, results of operations or cash flows.
NOTE 18 - SUBSEQUENT EVENTS
On April 14, 2023, we issued $750 million aggregate principal amount of 6.750% 2030 Senior Notes in an offering that was exempt from the registration requirements of the Securities Act. The notes were issued at par. We used the net proceeds from the notes offering to repay a portion of the borrowings under our ABL Facility.
| | |
|
| ITEM 2. MANAGEMENT'S DISCUSSION AND ANALYSIS OF FINANCIAL CONDITION AND RESULTS OF OPERATIONS |
Management's Discussion and Analysis of Financial Condition and Results of Operations is designed to provide a reader of our financial statements with a narrative from the perspective of management on our financial condition, results of operations, liquidity and other factors that may affect our future results. We believe it is important to read our Management's Discussion and Analysis of Financial Condition and Results of Operations in conjunction with our Annual Report on Form 10-K for the year ended December 31, 2022, as well as other publicly available information.
OVERVIEW
We are the largest flat-rolled steel producer in North America. Founded in 1847 as a mine operator, we are also the largest manufacturer of iron ore pellets in North America. We are vertically integrated from mined raw materials, direct reduced iron and ferrous scrap to primary steelmaking and downstream finishing, stamping, tooling and tubing. We are the largest supplier of steel to the automotive industry in North America and serve a diverse range of other markets due to our comprehensive offering of flat-rolled steel products. Headquartered in Cleveland, Ohio, we employ approximately 27,000 people across our operations in the United States and Canada.
FINANCIAL SUMMARY
The following is a summary of our consolidated results for the three months ended March 31, 2023 and 2022 (in millions, except for diluted EPS):
| | | | | | | | | | | | | | | | | | | | |
| Total Revenue | | Net Income (Loss) | | Adjusted EBITDA | | Diluted EPS |
See "— Non-GAAP Financial Measures" below for a reconciliation of our Net income (loss) to Adjusted EBITDA.
ECONOMIC OVERVIEW
To begin 2023, steel market conditions have been strong, driven by increased demand, extended lead times, low inventory levels at service centers and improving dynamics in the raw materials market. The price for domestic HRC, the most significant index
impacting our revenues and profitability, averaged $875 per net ton for the first quarter of 2023, 28% lower than the first quarter of 2022, but above the prior ten-year average of $750 per net ton and $685 per net ton during the fourth quarter of 2022. HRC prices sharply rebounded to above $1,150 per net ton by the end of the first quarter of 2023 after falling below $700 per net ton in the fourth quarter of 2022, the lowest level since October 2020. Demand for steel from automotive manufacturers improved as supply chain issues continue to ease and light vehicle sales increase, reducing the availability of steel supply to the spot market. Additionally, steel imports remained unattractive for the majority of the first quarter of 2023. Looking forward, we expect domestic steel demand to remain healthy to the extent that these conditions persist.
The CHIPS Act and Inflation Reduction Act should provide meaningful support for overall domestic steel demand throughout 2023 and beyond. Our extensive portfolio of products should result in increased steel demand from some of our end markets. The CHIPS Act promotes semiconductor manufacturing in the U.S., which should help support non-residential construction as well as machinery and equipment. Additionally, on-shoring manufacturing in the U.S. should reduce risk of supply chain issues in the future. The Inflation Reduction Act provides a tax credit for consumers who buy new EVs, which further incentivizes consumers to purchase vehicles in an environment where pent-up demand is still very strong from recent supply chain issues and low dealer inventory levels. The Inflation Reduction Act also provides incentives for the use of domestic steel for investments in clean energy projects, including wind and solar projects, which consume a substantial amount of steel. Additional projects arising out of this recent legislation could create incremental demand for our galvanized, GOES, NOES and other steel products. We expect to benefit from the spending related to this recently passed legislation during 2023 and beyond.
The largest market for our steel products is the automotive industry in North America, which makes light vehicle production a key driver of demand. During the first quarter of 2023, North American light vehicle production was approximately 3.9 million units, the highest quarterly production volume since 2020. Full-year 2023 North American light vehicle production is estimated to exceed 15 million units, which would be the highest level since 2019. Inventory levels have recently reached the highest level since April 2021, with 1.8 million units of gross stock at the end of March 2023, but remain significantly below historical average inventory levels of 2.5 to 3.0 million units of gross stock. Additionally, the average age of cars on the road in the U.S. reached an all-time high during 2022, which should support demand as older vehicles need to be replaced. As the largest supplier of automotive-grade steel in the U.S., we expect to benefit from increased vehicle production in 2023 and beyond.
The ongoing conflict between Russia and Ukraine has disrupted raw material sourcing for our EAF competitors and has further increased the volatility in their steelmaking input costs. Approximately two-thirds of all U.S. imported pig iron, an important feedstock for flat-rolled steel producing EAFs, had historically been sourced from Russia and Ukraine. Imported pig iron prices averaged $550 per metric ton during the first quarter of 2023, which is above the historical average of $487 per metric ton from September 2017 to December 2022. The price continued to increase throughout the first quarter and was $593 per metric ton as of March 31, 2023. Increases in finished steel and scrap prices since the beginning of the year have also contributed to higher pig iron pricing. Higher than historical imported pig iron costs should continue to support a higher HRC price. Unlike other flat-rolled steel producers, we are not reliant on imported pig iron, as we produce pig iron in-house at our blast furnaces, using our own iron ore and HBI as the primary raw materials.
The price for busheling scrap, a necessary input for flat-rolled steel production in EAFs in the U.S., has continued to average well above the historical ten-year average of $380 per long ton since 2021. The busheling price averaged $513 per long ton during the first quarter of 2023 after it fell to $350 per long ton during the fourth quarter of 2022, as domestic steel capacity utilization rates declined below 80% and competitors worked through excess raw material inventory. We expect the supply of busheling scrap to further tighten due to decreasing prime scrap generation from original equipment manufacturers and the growth of EAF capacity in the U.S., along with a push for expanded scrap use globally. As we are fully integrated and have primarily a blast furnace footprint, increased prices for busheling scrap in the U.S. bolster our competitive advantage, as we source the majority of our iron feedstock from our stable-cost mining and pelletizing operations in Minnesota and Michigan.
As for iron ore, the Platts 62% price averaged $126 per metric ton in the first quarter of 2023, which is 29% higher than the historical ten-year average. While higher iron ore prices play a role in increased steel prices, we also directly benefit from higher iron ore prices for the portion of iron ore pellets we sell to third parties.
The U.S. Federal Reserve has pushed interest rates to the highest level in more than 15 years in an attempt to slow demand and reduce inflation. Though we are a firm believer that the U.S. is the most resilient manufacturing economy in the world, rising interest rates could cause a significant economic downturn and impact various end markets that we serve and overall domestic steel demand. While we believe there is strong pent-up demand for light vehicles in the U.S., automotive sales could be negatively impacted due to higher interest rates. The non-residential construction market could also see delays in construction as increased rates drive caution on new business. If continued rising rates in the U.S. result in a recession, we believe that end-user demand for steel intensive products could be negatively impacted as a recession would likely result in higher unemployment, lower wages and less disposable income for consumers.
During 2022, we experienced higher costs than the prior year due to inflationary pressures on input and energy costs, as well as lower production volume and higher repair and maintenance spending. We started to benefit from lower costs in the first quarter of 2023 and expect that to continue throughout 2023 and beyond, as most inflationary pressures have started to ease, production volume has improved, and repair and maintenance expenses have begun to normalize.
COMPETITIVE STRENGTHS
As the largest flat-rolled steel producer in North America, we benefit from having the size and scale necessary in a competitive, capital intensive business. Our sizeable operating footprint provides us with the operational leverage and flexibility to achieve competitive margins throughout the business cycle. We also have a unique vertically integrated profile from mined raw materials,
direct reduced iron, and ferrous scrap to primary steelmaking and downstream finishing, stamping, tooling and tubing. This positioning gives us more predictable costs throughout our supply chain and more control over both our manufacturing inputs and our end product destination.
Our primary competitive strength lies within our automotive steel business. We are the largest supplier of automotive-grade steel in the U.S. Compared to other steel end markets, automotive steel is generally higher quality, more operationally and technologically intensive to produce, and requires significantly more devotion to customer service than other steel end markets. This dedication to service and the infrastructure in place to meet our automotive customers’ demanding needs took decades to develop and we believe is unmatched in our industry. We have continued to invest capital and resources to meet the requirements needed to serve the automotive industry and intend to maintain our position as the industry leader going forward.
Due to its demanding nature, the automotive steel business typically generates higher through-the-cycle margins, making it a desirable end market. Over the past two years, we have been able to increase the fixed prices for our automotive contracts significantly. Demand for our automotive-grade steel is expected to increase in the coming years as a result of pent-up automotive demand arising out of supply chain issues and the replacement of older vehicles.
Our integrated footprint provides us with a significant competitive advantage in supplying automotive and other highly demanding end markets, as we are able to produce a wide range of high-quality products. Our integrated facilities utilize domestic internally sourced iron ore as the primary feedstock, which allows us to produce a higher quality product with low residual content. We also operate EAF facilities, which gives us insight into the limitations of our competitors who predominantly operate only EAF facilities. Companies that are primarily EAF producers are limited in their product range as their equipment is designed to utilize scrap as the main feedstock, which often contains high residual or impure content, such as copper, limiting their ability to meet certain high grades of steel that demand virgin iron. We also believe companies that primarily operate EAFs do not possess our breadth and depth of customer service, technical support, and research and development capabilities.
Since the acquisition of our steelmaking assets, we have dedicated significant resources to maintain and upgrade our facilities and equipment. The quality of our assets gives us a unique advantage in product offerings and operational efficiencies. In 2022, we brought our facilities and equipment up to the standard required to maintain and improve the quality and reliability of our supply to the automotive industry, as well as other end markets. The necessary resources that we have invested in our footprint are expected to keep our assets at an automotive-grade quality and reliability for years to come.
Our industry leading portfolio of fixed price contracts provides us a competitive advantage, as the steel industry is often viewed as volatile and subject to the market price of steel. Our fixed price contracts mitigate pricing volatility and support us in achieving healthy margins through the cycle. We were able to achieve consecutive fixed price contract increases in 2022 and 2023. We expect to have continued success in resetting our annual fixed price contracts throughout the remainder of 2023 and in the coming years.
Our ability to source our primary feedstock domestically and internally is a competitive strength. This model reduces our exposure to volatile pricing and unreliable global sourcing. The ongoing conflict between Russia and Ukraine has displayed the importance of our U.S.-centric footprint, as our competitors who primarily operate EAF facilities rely on imported pig iron to produce flat-rolled steel, the supply of which has been disrupted by that conflict. The best example is our legacy business of producing iron ore pellets. By controlling our iron ore pellet supply, our primary steelmaking raw material feedstock can be secured at a stable and predictable cost and not be subject to as many factors outside of our control.
We believe we offer the most comprehensive flat-rolled steel product selection in the industry, along with several complementary products and services. A sampling of our offering includes advanced high-strength steel, hot-dipped galvanized, aluminized, galvalume, electrogalvanized, galvanneal, HRC, cold-rolled coil, plate, tinplate, GOES, NOES, stainless steels, tool and die, stamped components, rail, slab and cast ingot. Across the quality spectrum and the supply chain, our customers can frequently find the solutions they need from our product selection. Our broad range of product offerings also gives us a competitive advantage in commercial negotiations as our customers can source the majority, if not all, of their steel product needs from us.
We are currently the only producer of electrical steels referred to as GOES and NOES in the U.S. In November 2021, the Infrastructure and Jobs Act was passed in the U.S., which provides funding to be used for the modernization of the electrical grid and the infrastructure needed to allow for increased EV adoption, both of which require electrical steels. As a result, with increased demand for both transformers and motors for EVs, we expect to benefit from this position in what is currently a rapidly growing market. In 2023, our electrical steel business is expected to post the highest profitability in over a decade. We also expect to complete our NOES expansion at our Zanesville facility in the second half of 2023, which will increase our capacity by approximately 70,000 net tons.
We are the first and the only producer of HBI in the Great Lakes region. Construction of our Toledo direct reduction plant was completed in the fourth quarter of 2020 and reached full run-rate nameplate annual capacity of 1.9 million metric tons during the middle of 2021. From this modern plant, we produce a high-quality, low-cost and low-carbon intensive HBI product that can be used in our blast furnaces as a productivity enhancer, or in our BOFs and EAFs as a premium scrap alternative. We use HBI to stretch our hot metal production, lowering carbon intensity and reliance on coke. With increasing tightness in the scrap and metallics markets combined with our own internal needs, we expect our Toledo direct reduction plant to support healthy margins for us going forward.
STRATEGY
MAXIMIZE OUR COMMERCIAL STRENGTHS
We offer a full suite of flat steel products encompassing all steps of the steel manufacturing process. We have an industry-leading market share in the automotive sector, where our portfolio of high-end products delivers a broad range of differentiated solutions for this highly sought after customer base.
As a result of our exposure to these high-end markets, we have the highest fixed price contractual volumes in our industry. Approximately 45% of our volumes are sold under these contracts. These contracts reduce volatility and allow for more predictable through-the-cycle margins. Our fixed contract values are expected to significantly improve throughout 2023 compared to 2022. In addition to our fixed price contracts, we anticipate having more volumes under index-linked contracts in 2023 and beyond, which should reduce our reliance on spot sales and allow us to improve our efficiency with increased volumes.
Our unique capabilities, driven by our portfolio of assets and technical expertise, give us an advantage in our flat-rolled product offering. We offer products that have superior formability, surface quality, strength and corrosion resistance for the automotive industry. We are also the only producer of GOES and NOES in the U.S. In addition, our state-of-the-art Research and Innovation Center in Middletown, Ohio gives us the ability to collaborate with our customers and create new products and develop new and efficient steel manufacturing processes. During 2022, we introduced our MOTOR-MAX™ product line of NOES for high frequency motors and generators. These unique product offerings and customer service capabilities enable us to remain the leading steel supplier to the automotive industry.
TAKE ADVANTAGE OF OUR U.S.-CENTRIC, INTERNALLY SOURCED SUPPLY CHAIN
The ongoing conflict between Russia and Ukraine has reinforced the unique advantage of our vertically integrated business model. Two-thirds of U.S. imports of pig iron, a critical raw material for flat-rolled EAFs, had historically been sourced from Russia and Ukraine. This supply remains largely disrupted, driving volatility in input costs and reducing availability for our competitors’ ferrous inputs. We, on the other hand, produce our pig iron and liquid steel entirely in the U.S., supported by internally sourced iron ore and HBI and supplemented with internally sourced scrap. In addition, our internally produced pig iron is more environmentally friendly than imported pig iron, which is often made from sintered iron ore fines and with higher coke rates, for example. While competitors are forced to scramble for materials, we are able to take advantage of our vertically integrated footprint.
We began construction of our HBI plant in 2017, in part because of the uncertainty of the industry sourcing metallics from Russia and Ukraine. Russia had previously invaded the Crimea peninsula in 2014, and we saw a need for more on-shore metallics capacity in the U.S. HBI, which is a lower-carbon alternative to imported pig iron, has now become a critical component of our decarbonization strategy.
OPTIMIZE OUR FULLY-INTEGRATED STEELMAKING FOOTPRINT
We are a fully-integrated steel enterprise with the size and scale to achieve margins above industry averages for flat-rolled steel. Our focus remains on realizing our inherent cost advantage in flat-rolled steel while also lowering carbon emissions. The combination of our ferrous raw materials, including iron ore, scrap and HBI, allows us to do so relative to peers who must rely on more unpredictable and unreliable raw material sourcing strategies.
We have ample access to scrap along with internally sourced iron ore pellets and HBI. Our ability to optimize use of these raw materials in our blast furnaces and BOFs ultimately boosts liquid steel output, reduces coke needs and lowers carbon emissions from our operations. As a result of the successful operational improvements, we announced the indefinite idle of the Indiana Harbor #4 blast furnace in the first quarter of 2022. The indefinite idle reduced our operational blast furnaces from eight to seven.
We used 2022 as an opportunity to optimize our steelmaking footprint by dedicating significant resources to bring our facilities and equipment up to the standard required to maintain and improve our supply to the automotive industry. The necessary resources that we have invested in our footprint are expected to keep our assets at automotive-grade quality and reliability for years to come. With our facilities and equipment in the best shape since the acquisition of our steelmaking assets and no major investments expected until at least 2025, we are well positioned to benefit from operating efficiencies and improved capabilities in the coming years.
ADVANCE OUR PARTICIPATION IN THE GREEN ECONOMY
We are seeking to expand our customer base with the rapidly growing and desirable EV market. At this time, we believe the North American automotive industry is approaching a structural inflection point, with the adoption of electrical motors in passenger vehicles. As this market grows, it will require more advanced steel applications to meet the needs of EV producers and consumers. These features include the strength and formability of our flat-rolled steel used for battery enclosures in EVs. With our unique technical capabilities and leadership in the automotive industry, we believe we are positioned better than any other North American steelmaker to supply the steel and parts necessary to fill these needs.
We also have the right products to meet the growing demand for renewable energy as well as for the modernization of the U.S. electrical grid. We offer plate products that can be used in windmills, which we estimate contain 130 tons of steel per megawatt of electricity. In addition, panels for solar power are heavy consumers of galvanized steel, where we are a leading producer. We estimate solar panels consume 40 tons of steel per megawatt of electricity.
We are currently the sole producer of electrical steel in the U.S., which can facilitate the modernization of the U.S. electrical grid. Along with charging networks, electrical steels are also needed in the motors of EVs.
ENHANCE OUR ENVIRONMENTAL SUSTAINABILITY
Our commitment to operating our business in a more environmentally responsible manner remains constant. One of the most important issues impacting our industry, our stakeholders and our planet is climate change. In early 2021, we announced our commitment to reduce GHG emissions 25% from 2017 levels by 2030. This goal represents combined Scope 1 (direct emissions) and Scope 2 (indirect emissions from purchased electricity or other forms of energy) GHG emission reductions across all of our operations. Our 2022 absolute Scope 1 and Scope 2 GHG emissions were below our reduction goal well ahead of our 2030 target year. On a per ton basis, we reduced our integrated Scope 1 and Scope 2 GHG intensity from 1.67 per metric ton of crude steel produced in 2021 to 1.60 in 2022.
We plan to further our efforts towards our GHG emissions reduction goal by focusing on actionable, commercially viable technologies and solutions while supporting research for breakthrough technologies for the primary iron and steel sector. In an effort to build on our GHG emissions reduction progress, we have continued our partnership with the U.S. Department of Energy as part of the Better Climate Challenge initiative, which was established in December 2021. We have continued to pursue opportunities such as carbon capture and the use of hydrogen within our facilities. Additionally, we have started forming partnerships to develop alternative energy sources - such as wind and solar - which will benefit our own environmental footprint while combating the global impacts of climate change.
Our future GHG emissions reductions are expected to be driven by the use of direct reduced iron in blast furnaces, the stretching of hot metal with additional scrap, driving more productivity out of fewer blast furnaces, implementing hydrogen use where possible, utilizing carbon capture, procuring more clean energy and operating with higher energy efficiency.
IMPROVE FINANCIAL FLEXIBILITY
Given the cyclicality of our business, it is important to us to be in the financial position to easily withstand economic cycles. Since the acquisition of our steelmaking assets, we have demonstrated our ability to generate healthy free cash flow and use it to reduce substantial amounts of debt, return capital to shareholders through our share repurchase program and make investments to both improve and grow our business. During 2022, we reduced outstanding debt by approximately $1.1 billion while returning $240 million in capital to shareholders via share repurchases. In the past 12 months, we were able to take advantage of volatility in the debt markets to repurchase $351 million aggregate principal amount of assorted series of notes at an average price of 92% of par.
Given strong market conditions, we expect to have ample opportunities to reduce our debt with our own free cash flow generation through the remainder of 2023 and in the coming years.
On April 14, 2023, we issued $750 million aggregate principal amount of 6.750% 2030 Senior Notes. The proceeds from the 6.750% 2030 Senior Notes were used to repay a portion of the borrowings under our existing ABL Facility. The transaction increased our financial flexibility and liquidity, extended our debt maturity profile, and was effectively leverage and interest expense neutral. Following the transaction, we maintained in excess of $1 billion in pre-payable debt on the ABL Facility and another $1.5 billion in callable debt that we expect to continue to reduce with our free cash flow generation.
STEELMAKING RESULTS
The following is a summary of our Steelmaking segment operating results for the three months ended March 31, 2023 and 2022 (dollars in millions, except for average selling price and shipments in thousands of net tons):
| | | | | | | | | | | | | | | | | | | | |
| Total Revenue | | Gross Margin | | Adjusted EBITDA | | Steel Shipments (nt) |
| | | | | | | | | | | | | | | | | | | | | | | | | | | | | | | | |
| 2023 | 2022 | | 2023 | 2022 | | 2023 | 2022 | | 2023 | 2022 |
| | | | | | |
| STEEL PRODUCT REVENUE: | | GROSS MARGIN %: | | ADJUSTED EBITDA %: | | AVERAGE SELLING PRICE PER TON OF STEEL PRODUCTS: |
| $ | 4,609 | | $ | 5,259 | | | 2% | 21% | | 5% | 25% | | $1,128 | $1,446 |
REVENUES
The following tables represent our steel shipments by product and total sales by market:
| | | | | | | | | | | | | | | | | | | | | | | | | | |
| Three Months Ended March 31, | | | |
| 2023 | | 2022 | | Variance |
| (In thousands of net tons) | Volume | % | | Volume | % | | Volume | % |
| Steel shipments by product: | | | | | | | | |
| Hot-rolled steel | 1,490 | | 36 | % | | 903 | | 25 | % | | 587 | | 65 | % |
| Cold-rolled steel | 597 | | 15 | % | | 651 | | 18 | % | | (54) | | (8) | % |
| Coated steel | 1,168 | | 29 | % | | 1,242 | | 34 | % | | (74) | | (6) | % |
| Stainless and electrical steel | 174 | | 4 | % | | 189 | | 5 | % | | (15) | | (8) | % |
| Plate | 198 | | 5 | % | | 221 | | 6 | % | | (23) | | (10) | % |
| Slab and other steel products | 458 | | 11 | % | | 431 | | 12 | % | | 27 | | 6 | % |
| Total steel shipments by product | 4,085 | | | | 3,637 | | | | 448 | | 12 | % |
| | | | | | | | |
| Three Months Ended March 31, | | | |
| 2023 | | 2022 | | Variance |
| (In millions) | Revenue | % | | Revenue | % | | Revenue | % |
| Steelmaking revenues by market: | | | | | | | | |
| Direct automotive | $ | 1,870 | | 36 | % | | $ | 1,607 | | 28 | % | | $ | 263 | | 16 | % |
| Infrastructure and manufacturing | 1,297 | | 25 | % | | 1,542 | | 27 | % | | (245) | | (16) | % |
| Distributors and converters | 1,258 | | 25 | % | | 1,829 | | 31 | % | | (571) | | (31) | % |
| Steel producers | 701 | | 14 | % | | 816 | | 14 | % | | (115) | | (14) | % |
| Total Steelmaking revenues by market | $ | 5,126 | | | | $ | 5,794 | | | | $ | (668) | | (12) | % |
Revenues decreased by 12% during the three months ended March 31, 2023, as compared to the prior-year period, primarily due to:
•A decrease of $816 million, or 24%, in revenues from the infrastructure and manufacturing and distributors and converters markets, predominantly due to the average HRC price declining $340 per net ton, or 28%, which was partially offset by increased hot-rolled steel shipments.
•These decreases were partially offset by an increase in the direct automotive market of $263 million, or 16%, predominantly due to increases in selling prices as a result of favorable renewals of annual fixed price contracts.
GROSS MARGIN
Gross margin decreased by $1,128 million, or 92%, during the three months ended March 31, 2023, as compared to the prior-year period, primarily due to:
•A decrease in selling prices (approximately $1.2 billion impact) predominantly due to lower spot prices.
•This decrease was partially offset by an increase in sales volume (approximately $200 million impact).
ADJUSTED EBITDA
Adjusted EBITDA from our Steelmaking segment for the three months ended March 31, 2023, decreased by $1,184 million, as compared to the three months ended March 31, 2022, primarily due to the decreased gross margin from our operations. Additionally, our Steelmaking Adjusted EBITDA included $119 million and $114 million of Selling, general and administrative expenses for the three months ended March 31, 2023 and 2022, respectively.
RESULTS OF OPERATIONS
REVENUES & GROSS MARGIN
During the three months ended March 31, 2023, our consolidated Revenues decreased by $660 million, compared to the prior-year period. The decrease was primarily due to the decrease in the average steel product selling price of $318 per net ton, partially offset by the increase of 0.4 million net tons of steel shipments from our Steelmaking segment.
During the three months ended March 31, 2023, our consolidated gross margin decreased by $1,150 million, as compared to the prior-year period. See "— Steelmaking Results" above for further detail on our operating results.
MISCELLANEOUS - NET
During the three months ended March 31, 2023, Miscellaneous – net decreased by $30 million, as compared to the prior-year period. The decrease in miscellaneous expense was primarily related to an impairment expense in 2022, which was not repeated during 2023.
INCOME TAXES
Our effective tax rate is impacted by state income tax expense and permanent items, primarily depletion. It also is affected by discrete items that may occur in any given period but are not consistent from period to period. The following represents a summary of our tax provision and corresponding effective rates:
| | | | | | | | | | | | | | | |
| | Three Months Ended March 31, |
| (In millions) | | | | | 2023 | | 2022 |
| Income tax benefit (expense) | | | | | $ | 13 | | | $ | (237) | |
| Effective tax rate | | | | | 23 | % | | 23 | % |
The change from income tax expense to income tax benefit for the three months ended March 31, 2023, as compared to the prior-year period, is directly related to the change in pre-tax income (loss).
Our 2023 estimated annual effective tax rate before discrete items at March 31, 2023 is 22%. This estimated annual effective tax rate exceeds the U.S. statutory rate of 21%, as state income tax expense exceeds the percentage depletion in excess of cost depletion. The 2022 estimated annual effective tax rate before discrete items at March 31, 2022 was 22%.
LIQUIDITY, CASH FLOWS AND CAPITAL RESOURCES
OVERVIEW
Our capital allocation decision-making process is focused on preserving healthy liquidity levels while maintaining the strength of our balance sheet and creating financial flexibility to manage through the cyclical demand for our products and volatility in commodity prices. We are focused on maximizing the cash generation of our operations, reducing debt, returning capital to shareholders and aligning capital investments with our strategic priorities and the requirements of our business plan, including regulatory and permission-to-operate related projects.
The following table provides a summary of our cash flows:
| | | | | | | | | | | |
| Three Months Ended March 31, |
| (In millions) | 2023 | | 2022 |
| Cash flows provided by (used in): | | | |
| Operating activities | $ | (39) | | | $ | 533 | |
| Investing activities | (185) | | | (235) | |
| Financing activities | 257 | | | (311) | |
| Net increase (decrease) in cash and cash equivalents | $ | 33 | | | $ | (13) | |
| | | |
Free cash flow1 | $ | (227) | | | $ | 297 | |
| | | |
1See "— Non-GAAP Financial Measures" for a reconciliation of our free cash flows. |
Given the recently improving market conditions at the end of the first quarter of 2023, we expect to have opportunities to reduce our debt and return capital to shareholders with our own free cash flow generation during the remainder of 2023. As of March 31, 2023, we had principal long-term debt of $4,613 million with maturities starting in 2025. As of March 31, 2023, there was $760 million remaining under the authorization of our share repurchase program.
On April 14, 2023, we issued $750 million aggregate principal amount of 6.750% 2030 Senior Notes in an offering exempt from the registration requirements of the Securities Act. The proceeds from the 6.750% 2030 Senior Notes were used to repay a portion of the borrowings under our existing ABL facility. The transaction increased our financial flexibility and liquidity, extended our debt maturity profile, and was effectively leverage and interest expense neutral. Following the transaction, we maintained in excess of $1 billion in pre-payable debt on our ABL Facility and another $1.5 billion in callable debt that we expect to continue to reduce with our free cash flow generation.
These actions give us additional financial flexibility and will better prepare us to navigate more easily through potentially volatile industry conditions in the future.
CASH FLOWS
OPERATING ACTIVITIES
| | | | | | | | | | | | | | | | | |
| Three Months Ended March 31, | | |
| (In millions) | 2023 | | 2022 | | Variance |
| Net income (loss) | $ | (42) | | | $ | 814 | | | $ | (856) | |
| Non-cash adjustments to net income (loss) | 237 | | | 399 | | | (162) | |
| Working capital: | | | | | |
| Accounts receivable, net | (257) | | | (512) | | | 255 | |
| Inventories | 207 | | | (372) | | | 579 | |
| Income taxes | 15 | | | 180 | | | (165) | |
| Pension and OPEB payments and contributions | (30) | | | (60) | | | 30 | |
| Payables, accrued employment and accrued expenses | (90) | | | 109 | | | (199) | |
| Other, net | (79) | | | (25) | | | (54) | |
| Total working capital | (234) | | | (680) | | | 446 | |
| Net cash provided (used) by operating activities | $ | (39) | | | $ | 533 | | | $ | (572) | |
The variance was driven by:
•A $1,018 million decrease in net income (loss) after adjustments for non-cash items primarily due to lower gross margins from lower steel sales prices. See "— Steelmaking Results" above for further detail on our operating results.
•A $446 million decrease in cash used for working capital. This was primarily due to a decrease in inventories, as a result of higher sales volumes and lower costs during the three months ended March 31, 2023, as compared to the prior-year period, where we had an increase in inventory costs due to increased raw material and production costs. During the three months ended March 31, 2023, we also experienced lower increases in accounts receivable due to lower pricing, as compared to the prior-year period.
INVESTING ACTIVITIES
| | | | | | | | | | | | | | | | | |
| Three Months Ended March 31, | | |
| (In millions) | 2023 | | 2022 | | Variance |
| Purchase of property, plant and equipment | $ | (188) | | | $ | (236) | | | $ | 48 | |
| | | | | |
| Other | 3 | | | 1 | | | 2 | |
| Net cash used by investing activities | $ | (185) | | | $ | (235) | | | $ | 50 | |
Our cash used for capital expenditures decreased $48 million due to the completion of our major maintenance cycle in 2022. Our capital expenditures primarily relate to sustaining capital spend, which includes infrastructure, mobile equipment, fixed equipment, product quality, environmental, and health and safety.
We anticipate total cash used for capital expenditures during the next 12 months to be between $675 and $725 million, which primarily consists of sustaining capital spend. With our facilities and equipment in the best shape since our 2020 transformational acquisitions, we do not expect any major investments until at least 2025.
FINANCING ACTIVITIES
| | | | | | | | | | | | | | | | | |
| Three Months Ended March 31, | | |
| (In millions) | 2023 | | 2022 | | Variance |
| | | | | |
| Repayments of debt | $ | — | | | $ | (360) | | | $ | 360 | |
| Borrowings under credit facilities, net | 307 | | | 106 | | | 201 | |
| Repurchase of common shares | — | | | (19) | | | 19 | |
| Other | (50) | | | (38) | | | (12) | |
| Net cash provided (used) by financing activities | $ | 257 | | | $ | (311) | | | $ | 568 | |
The variance was driven by:
•A $561 million decrease in cash used resulting from higher net repayments of debt during the three months ended March 31, 2022, along with increased borrowings on our ABL Facility during the three months ended March 31, 2023, as compared to the prior-year period.
LIQUIDITY AND CAPITAL RESOURCES
Our primary sources of liquidity are Cash and cash equivalents, cash generated from our operations, availability under our ABL Facility and access to capital markets. We generally maintain minimal cash balances and utilize our access to our ABL Facility to cover fluctuations in our cash requirements. Cash and cash equivalents, which totaled $59 million as of March 31, 2023, include cash on hand and on deposit. The combination of cash and availability under our ABL Facility gives us $2.2 billion in liquidity as of March 31, 2023. Subsequent to the three months ended March 31, 2023, we issued $750 million in aggregate principal amount of 6.750% 2030 Senior Notes. We used the net proceeds from the offering to repay a portion of the borrowings under our ABL Facility, increasing our liquidity. We believe our liquidity and access to capital markets will be adequate to fund our cash requirements for the next 12 months and for the foreseeable future.
Our ABL Facility, which matures in March 2025, has a maximum borrowing base of $4.5 billion, determined by applying customary advance rates to eligible accounts receivable, inventory and certain mobile equipment. Our ABL Facility includes a $555 million sublimit for the issuance of letters of credit and a $200 million sublimit for swingline loans. As of March 31, 2023, outstanding letters of credit totaled $147 million, which reduced availability. We issue standby letters of credit with certain financial institutions in order to support business obligations, including, but not limited to, workers' compensation, employee severance, insurance, operating agreements and environmental obligations. Our ABL Facility agreement contains various financial and other covenants. As of March 31, 2023, we were in compliance with all of our ABL Facility covenants.
We have the capability to issue additional unsecured notes and, subject to the limitations set forth in our existing senior notes indentures and ABL Facility, additional secured debt, if we elect to access the debt capital markets. However, our ability to issue additional notes could be limited by market conditions. We intend from time to time to seek to redeem or repurchase our outstanding senior notes with cash on hand, borrowings from existing credit sources or new debt financings and/or exchanges for debt or equity securities, in open market purchases, privately negotiated transactions or otherwise. Such redemptions or repurchases, if any, will depend on prevailing market conditions, our liquidity requirements, contractual restrictions and other factors, and the amounts involved may be material.
Refer to NOTE 7 - DEBT AND CREDIT FACILITIES for more information on our ABL Facility and debt.
NON-GAAP FINANCIAL MEASURES
ADJUSTED EBITDA
We evaluate performance on an operating segment basis, as well as a consolidated basis, based on Adjusted EBITDA, which is a non-GAAP measure. This measure is used by management, investors, lenders and other external users of our financial statements to assess our operating performance and to compare operating performance to other companies in the steel industry. In addition, management believes Adjusted EBITDA is a useful measure to assess the earnings power of the business without the impact of capital structure and can be used to assess our ability to service debt and fund future capital expenditures in the business.
The following table provides a reconciliation of our Net income (loss) to Adjusted EBITDA:
| | | | | | | | | | | | | | | |
| | | Three Months Ended March 31, |
| (In millions) | | | | | 2023 | | 2022 |
| Net income (loss) | | | | | $ | (42) | | | $ | 814 | |
| Less: | | | | | | | |
| Interest expense, net | | | | | (77) | | | (77) | |
| Income tax benefit (expense) | | | | | 13 | | | (237) | |
| Depreciation, depletion and amortization | | | | | (242) | | | (301) | |
| Total EBITDA | | | | | $ | 264 | | | $ | 1,429 | |
| Less: | | | | | | | |
EBITDA of noncontrolling interests1 | | | | | $ | 23 | | | $ | 22 | |
| Loss on extinguishment of debt | | | | | — | | | (14) | |
| | | | | | | |
| Asset impairment | | | | | — | | | (29) | |
| Other, net | | | | | (2) | | | (2) | |
| Total Adjusted EBITDA | | | | | $ | 243 | | | $ | 1,452 | |
| | | | | | | |
1 EBITDA of noncontrolling interests includes the following: |
| Net income attributable to noncontrolling interests | | | | | $ | 15 | | | $ | 13 | |
| Depreciation, depletion and amortization | | | | | 8 | | | 9 | |
| EBITDA of noncontrolling interests | | | | | $ | 23 | | | $ | 22 | |
The following table provides a summary of our Adjusted EBITDA by segment:
| | | | | | | | | | | | | | | |
| | | Three Months Ended March 31, |
| (In millions) | | | | | 2023 | | 2022 |
| Adjusted EBITDA: | | | | | | | |
| Steelmaking | | | | | $ | 240 | | | $ | 1,424 | |
| Other Businesses | | | | | 8 | | | 29 | |
| Corporate and eliminations | | | | | (5) | | | (1) | |
| Total Adjusted EBITDA | | | | | $ | 243 | | | $ | 1,452 | |
FREE CASH FLOW
Free cash flow is a non-GAAP measure defined as operating cash flows less purchase of property, plant and equipment. Management believes it is an important measure to assess the cash generation available to service debt, strategic initiatives or other financing activities.
The following table provides a reconciliation of our operating cash flows to free cash flows:
| | | | | | | | | | | |
| Three Months Ended March 31, |
| (In millions) | 2023 | | 2022 |
| Net cash provided (used) by operating activities | $ | (39) | | | $ | 533 | |
| Purchase of property, plant and equipment | (188) | | | (236) | |
| Free cash flows | $ | (227) | | | $ | 297 | |
INFORMATION ABOUT OUR GUARANTORS AND THE ISSUER OF OUR GUARANTEED SECURITIES
The accompanying summarized financial information has been prepared and presented pursuant to SEC Regulation S-X, Rule 3-10, “Financial Statements of Guarantors and Issuers of Guaranteed Securities Registered or Being Registered,” and Rule 13-01 "Financial Disclosures about Guarantors and Issuers of Guaranteed Securities and Affiliates Whose Securities Collateralized a Registrant's Securities." Certain of our subsidiaries (the "Guarantor subsidiaries") as of March 31, 2023 have fully and unconditionally, and jointly and severally, guaranteed the obligations under (a) the 5.875% 2027 Senior Notes, the 7.000% 2027 Senior Notes, the 4.625% 2029 Senior Notes and the 4.875% 2031 Senior Notes issued by Cleveland-Cliffs Inc. on a senior unsecured basis and (b) the 6.750% 2026 Senior Secured Notes issued by Cleveland-Cliffs Inc. on a senior secured basis. See NOTE 7 - DEBT AND CREDIT FACILITIES for further information.
The following presents the summarized financial information on a combined basis for Cleveland-Cliffs Inc. (parent company and issuer of the guaranteed obligations) and the Guarantor subsidiaries, collectively referred to as the obligated group. Transactions between the obligated group have been eliminated. Information for the non-Guarantor subsidiaries was excluded from the combined summarized financial information of the obligated group.
Each Guarantor subsidiary is consolidated by Cleveland-Cliffs Inc. as of March 31, 2023. Refer to Exhibit 22, incorporated herein by reference, for the detailed list of entities included within the obligated group as of March 31, 2023. As of March 31, 2023, the guarantee of a Guarantor subsidiary with respect to Cliffs' 6.750% 2026 Senior Secured Notes, the 5.875% 2027 Senior Notes, the 7.000% 2027 Senior Notes, the 4.625% 2029 Senior Notes and the 4.875% 2031 Senior Notes will be automatically and unconditionally released and discharged, and such Guarantor subsidiary’s obligations under the guarantee and the related indentures (the “Indentures”) will be automatically and unconditionally released and discharged, upon the occurrence of any of the following, along with the delivery to the trustee of an officer’s certificate and an opinion of counsel, each stating that all conditions precedent provided for in the applicable Indenture relating to the release and discharge of such Guarantor subsidiary’s guarantee have been complied with:
(a) any sale, exchange, transfer or disposition of such Guarantor subsidiary (by merger, consolidation, or the sale of) or the capital stock of such Guarantor subsidiary after which the applicable Guarantor subsidiary is no longer a subsidiary of the Company or the sale of all or substantially all of such Guarantor subsidiary’s assets (other than by lease), whether or not such Guarantor subsidiary is the surviving entity in such transaction, to a person which is not the Company or a subsidiary of the Company; provided that (i) such sale, exchange, transfer or disposition is made in compliance with the applicable Indenture, including the covenants regarding consolidation, merger and sale of assets and, as applicable, dispositions of assets that constitute notes collateral, and (ii) all the obligations of such Guarantor subsidiary under all debt of the Company or its subsidiaries terminate upon consummation of such transaction;
(b) designation of any Guarantor subsidiary as an “excluded subsidiary” (as defined in the Indentures); or
(c) defeasance or satisfaction and discharge of the Indentures.
Each entity in the summarized combined financial information follows the same accounting policies as described in the consolidated financial statements. The accompanying summarized combined financial information does not reflect investments of the obligated group in non-Guarantor subsidiaries. The financial information of the obligated group is presented on a combined basis; intercompany balances and transactions within the obligated group have been eliminated. The obligated group's amounts
due from, amounts due to, and transactions with, non-Guarantor subsidiaries and related parties have been presented in separate line items.
SUMMARIZED COMBINED FINANCIAL INFORMATION OF THE ISSUER AND GUARANTOR SUBSIDIARIES:
The following table is summarized combined financial information from the Statements of Unaudited Condensed Consolidated Financial Position of the obligated group:
| | | | | | | | | | | |
| (In millions) | March 31, 2023 | | December 31, 2022 |
| Current assets | $ | 7,653 | | | $ | 7,063 | |
| Non-current assets | 9,821 | | | 9,935 | |
| Current liabilities | (4,176) | | | (3,866) | |
| Non-current liabilities | (6,863) | | | (6,630) | |
| | | |
The following table is summarized combined financial information from the Statements of Unaudited Condensed Consolidated Operations of the obligated group:
| | | | | |
| Three Months Ended |
| (In millions) | March 31, 2023 |
| Revenues | $ | 4,883 | |
| Cost of goods sold | (4,820) | |
| Loss from continuing operations | (73) | |
| Net loss | (73) | |
| Net loss attributable to Cliffs shareholders | (73) | |
The obligated group had the following balances with non-Guarantor subsidiaries and other related parties:
| | | | | | | | | | | |
| (In millions) | March 31, 2023 | | December 31, 2022 |
| Balances with non-Guarantor subsidiaries: | | | |
| Accounts receivable, net | $ | 171 | | | $ | 163 | |
| Accounts payable | (643) | | | (527) | |
| | | |
| Balances with other related parties: | | | |
| Accounts receivable, net | $ | 4 | | | $ | 8 | |
| | | |
| Accounts payable | (12) | | | (13) | |
| | | |
Additionally, for the three months ended March 31, 2023, the obligated group had Revenues of $32 million and Cost of goods sold of $24 million, in each case, with other related parties.
MARKET RISKS
We are subject to a variety of risks, including those caused by changes in commodity prices and interest rates. We have established policies and procedures to manage such risks; however, certain risks are beyond our control.
PRICING RISKS
In the ordinary course of business, we are exposed to market risk and price fluctuations related to the sale of our products, which are impacted primarily by market prices for HRC and other related spot pricing indices, and the purchase of energy and raw materials used in our operations, which are impacted by market prices for natural gas, electricity, ferrous and stainless steel scrap, chrome, metallurgical coal, coke, zinc and nickel. Our strategy to address market risk has generally been to obtain competitive prices for our products and services and allow operating results to reflect market price movements dictated by supply and demand; however, we make forward physical purchases and enter into hedge contracts to manage exposure to price risk related to the purchases of certain raw materials and energy used in the production process.
Our financial results can vary for our operations as a result of fluctuations in market prices. We attempt to mitigate these risks by aligning fixed and variable components in our customer pricing contracts, supplier purchasing agreements and derivative financial instruments.
Some customer contracts have fixed-pricing terms, which increase our exposure to fluctuations in raw material and energy costs. To reduce our exposure, we enter into annual, fixed-price agreements for certain raw materials. Some of our existing multi-year raw material supply agreements have required minimum purchase quantities. Under adverse economic conditions, those minimums may exceed our needs. Absent exceptions for force majeure and other circumstances affecting the legal enforceability of the agreements, these minimum purchase requirements may compel us to purchase quantities of raw materials that could significantly exceed our anticipated needs or pay damages to the supplier for shortfalls. In these circumstances, we would attempt to negotiate agreements for new purchase quantities. There is a risk, however, that we would not be successful in reducing
purchase quantities, either through negotiation or litigation. If that occurred, we would likely be required to purchase more of a particular raw material in a particular year than we need, negatively affecting our results of operations and cash flows.
Certain of our customer contracts include variable-pricing mechanisms that adjust selling prices in response to changes in the costs of certain raw materials and energy, while other of our customer contracts exclude such mechanisms. We may enter into multi-year purchase agreements for certain raw materials with similar variable-price mechanisms, allowing us to achieve natural hedges between the customer contracts and supplier purchase agreements. Therefore, in some cases, price fluctuations for energy (particularly natural gas and electricity), raw materials (such as scrap, chrome, zinc and nickel) or other commodities may be, in part, passed on to customers rather than absorbed solely by us. There is a risk, however, that the variable-price mechanisms in the sales contracts may not necessarily change in tandem with the variable-price mechanisms in our purchase agreements, negatively affecting our results of operations and cash flows.
Our strategy to address volatile natural gas rates and electricity rates includes improving efficiency in energy usage, identifying alternative providers and utilizing the lowest cost alternative fuels. If we are unable to align fixed and variable components between customer contracts and supplier purchase agreements, we use cash-settled commodity price swaps to hedge the market risk associated with the purchase of certain of our raw materials and energy requirements. Additionally, we routinely use these derivative instruments to hedge a portion of our natural gas, electricity, tin and zinc requirements. Our hedging strategy is designed to protect us from excessive pricing volatility. However, since we do not typically hedge 100% of our exposure, abnormal price increases in any of these commodity markets might still negatively affect operating costs.
The following table summarizes the negative effect of a hypothetical change in the fair value of our derivative instruments outstanding as of March 31, 2023, due to a 10% and 25% change in the market price of each of the indicated commodities:
| | | | | | | | | | | | | | |
| Commodity Derivative (In millions) | | 10% Change | | 25% Change |
| Natural gas | | $ | 50 | | | $ | 126 | |
| Electricity | | 9 | | | 22 | |
| | | | |
| Tin | | — | | | 1 | |
Any resulting changes in fair value would be recorded as adjustments to AOCI, net of income taxes, or recognized in net earnings, as appropriate. These hypothetical losses would be partially offset by the benefit of lower prices paid for the related commodities.
VALUATION OF GOODWILL AND OTHER LONG-LIVED ASSETS
GOODWILL
We assign goodwill arising from acquired companies to the reporting units that are expected to benefit from the synergies of the acquisition. Goodwill is tested on a qualitative or quantitative basis for impairment at the reporting unit level on an annual basis (October 1) and between annual tests if an event occurs or circumstances change that would more likely than not reduce the fair value of a reporting unit below its carrying value. These events or circumstances could include a significant change in the business climate, legal factors, operating performance indicators, competition, or sale or disposition of a significant portion of a reporting unit. We have an unconditional option to bypass the qualitative test for any reporting unit in any period and proceed directly to performing the quantitative test. Should our qualitative test indicate that it is more likely than not that the fair value of a reporting unit is less than its carrying value, we perform a quantitative test to determine the amount of impairment, if any, to the carrying value of the reporting unit and its associated goodwill.
Application of the goodwill impairment test requires judgment, including the identification of reporting units, assignment of assets and liabilities to reporting units, assignment of goodwill to reporting units and if a quantitative assessment is deemed necessary in determination of the fair value of each reporting unit. The fair value of each reporting unit is estimated using the guideline public company method, the discounted cash flow methodology, or a combination of both, which considers forecasted cash flows discounted at an estimated weighted average cost of capital. Assessing the recoverability of our goodwill requires significant assumptions regarding the estimated future cash flows and other factors to determine the fair value of a reporting unit, including, among other things, estimates related to forecasts of future revenues, expected Adjusted EBITDA, expected capital expenditures and working capital requirements, which are based upon our long-range plan estimates. The assumptions used to calculate the fair value of a reporting unit may change from year to year based on operating results, market conditions and other factors. Changes in these assumptions could materially affect the determination of fair value for each reporting unit.
Our Tooling and Stamping reporting unit fair value was not substantially in excess of its carrying values as of March 31, 2023. A slower than anticipated resolution of the supply chain issues related to the global semiconductor shortages that have hampered the automotive industry, higher than expected capital requirements, and/or an increase in the discount rate could result in future impairment indicators.
OTHER LONG-LIVED ASSETS
Long-lived assets are reviewed for impairment upon the occurrence of events or changes in circumstances that would indicate that the carrying value of the assets may not be recoverable. Such indicators may include: a significant decline in expected future cash flows; a sustained, significant decline in market pricing; a significant adverse change in legal or environmental factors or in the business climate; changes in estimates of our recoverable reserves; and unanticipated competition. Any adverse change in these factors could have a significant impact on the recoverability of our long-lived assets and could have a material impact on our consolidated statements of operations and statements of financial position.
A comparison of each asset group's carrying value to the estimated undiscounted net future cash flows expected to result from the use of the assets, including cost of disposition, is used to determine if an asset is recoverable. Projected future cash flows reflect management's best estimate of economic and market conditions over the projected period, including growth rates in revenues and costs, and estimates of future expected changes in operating margins and capital expenditures. If the carrying value of the asset group is higher than its undiscounted net future cash flows, the asset group is measured at fair value and the difference is recorded as a reduction to the long-lived assets. We estimate fair value using a market approach, an income approach or a cost approach. For the three months ended March 31, 2023, we concluded that there were no additional triggering events resulting in the need for an impairment assessment.
INTEREST RATE RISK
Interest payable on our senior notes is at fixed rates. Interest payable under our ABL Facility is at a variable rate based upon the applicable base rate plus the applicable base rate margin depending on the excess availability. As of March 31, 2023, we had $2,171 million outstanding under our ABL Facility. An increase in prevailing interest rates would increase interest expense and interest paid for any outstanding borrowings under our ABL Facility. For example, a 100 basis point change to interest rates under our ABL Facility at the March 31, 2023 borrowing level would result in a change of $22 million to interest expense on an annual basis.
SUPPLY CONCENTRATION RISKS
Many of our operations and mines rely on one source each of electric power and natural gas. A significant interruption or change in service or rates from our energy suppliers could materially impact our production costs, margins and profitability.
FORWARD-LOOKING STATEMENTS
This report contains statements that constitute "forward-looking statements" within the meaning of the federal securities laws. As a general matter, forward-looking statements relate to anticipated trends and expectations rather than historical matters. Forward-looking statements are subject to uncertainties and factors relating to our operations and business environment that are difficult to predict and may be beyond our control. Such uncertainties and factors may cause actual results to differ materially from those expressed or implied by the forward-looking statements. These statements speak only as of the date of this report, and we undertake no ongoing obligation, other than that imposed by law, to update these statements. Investors are cautioned not to place undue reliance on forward-looking statements. Uncertainties and risk factors that could affect our future performance and cause results to differ from the forward-looking statements in this report include, but are not limited to:
•continued volatility of steel, iron ore and scrap metal market prices, which directly and indirectly impact the prices of the products that we sell to our customers;
•uncertainties associated with the highly competitive and cyclical steel industry and our reliance on the demand for steel from the automotive industry, which has been experiencing supply chain disruptions, such as the semiconductor shortage, and higher consumer interest rates, which could result in lower steel volumes being demanded;
•potential weaknesses and uncertainties in global economic conditions, excess global steelmaking capacity, oversupply of iron ore, prevalence of steel imports and reduced market demand, including as a result of inflationary pressures, the COVID-19 pandemic, conflicts or otherwise;
•severe financial hardship, bankruptcy, temporary or permanent shutdowns or operational challenges of one or more of our major customers, including customers in the automotive market, key suppliers or contractors, which, among other adverse effects, could disrupt our operations or lead to reduced demand for our products, increased difficulty collecting receivables, and customers and/or suppliers asserting force majeure or other reasons for not performing their contractual obligations to us;
•disruptions to our operations relating to an infectious disease outbreak or the COVID-19 pandemic, including workforce challenges and the risk that novel variants will prove resistant to existing vaccines or that new or continuing pandemic lockdowns in China will impact our ability to source certain critical supplies in a timely and predictable manner;
•risks related to U.S. government actions with respect to Section 232, the USMCA and/or other trade agreements, tariffs, treaties or policies, as well as the uncertainty of obtaining and maintaining effective antidumping and countervailing duty orders to counteract the harmful effects of unfairly traded imports;
•impacts of existing and increasing governmental regulation, including potential environmental regulations relating to climate change and carbon emissions, and related costs and liabilities, including failure to receive or maintain required operating and environmental permits, approvals, modifications or other authorizations of, or from, any governmental or regulatory authority and costs related to implementing improvements to ensure compliance with regulatory changes, including potential financial assurance requirements, and reclamation and remediation obligations;
•potential impacts to the environment or exposure to hazardous substances resulting from our operations;
•our ability to maintain adequate liquidity, our level of indebtedness and the availability of capital could limit our financial flexibility and cash flow necessary to fund working capital, planned capital expenditures, acquisitions, and other general corporate purposes or ongoing needs of our business;
•our ability to reduce our indebtedness or return capital to shareholders within the currently expected timeframes or at all;
•adverse changes in credit ratings, interest rates, foreign currency rates and tax laws, including adverse impacts as a result of the Inflation Reduction Act;
•the outcome of, and costs incurred in connection with, lawsuits, claims, arbitrations or governmental proceedings relating to commercial and business disputes, antitrust claims, environmental matters, government investigations, occupational or personal injury claims, property damage, labor and employment matters, or suits involving legacy operations and other matters;
•uncertain availability or cost, due to inflation or otherwise, of critical manufacturing equipment and spare parts;
•supply chain disruptions or changes in the cost, quality or availability of energy sources, including electricity, natural gas and diesel fuel, or critical raw materials and supplies, including iron ore, industrial gases, graphite electrodes, scrap metal, chrome, zinc, coke and metallurgical coal;
•problems or disruptions associated with transporting products to our customers, moving manufacturing inputs or products internally among our facilities, or suppliers transporting raw materials to us;
•the risk that the cost or time to implement a strategic or sustaining capital project may prove to be greater than originally anticipated;
•uncertainties associated with natural or human-caused disasters, adverse weather conditions, unanticipated geological conditions, critical equipment failures, infectious disease outbreaks, tailings dam failures and other unexpected events;
•cybersecurity incidents relating to, disruptions in, or failures of, information technology systems that are managed by us or third parties that host or have access to our data and systems, including the loss, theft or corruption of sensitive or essential business or personal information and the inability to access or control systems;
•liabilities and costs arising in connection with any business decisions to temporarily or indefinitely idle or permanently close an operating facility or mine, which could adversely impact the carrying value of associated assets and give rise to impairment charges or closure and reclamation obligations, as well as uncertainties associated with restarting any previously idled operating facility or mine;
•our level of self-insurance and our ability to obtain sufficient third-party insurance to adequately cover potential adverse events and business risks;
•uncertainties associated with our ability to meet customers’ and suppliers’ decarbonization goals and reduce our GHG emissions in alignment with our own announced targets;
•challenges to maintaining our social license to operate with our stakeholders, including the impacts of our operations on local communities, reputational impacts of operating in a carbon-intensive industry that produces GHG emissions, and our ability to foster a consistent operational and safety track record;
•our actual economic mineral reserves or reductions in current mineral reserve estimates, and any title defect or loss of any lease, license, easement or other possessory interest for any mining property;
•our ability to maintain satisfactory labor relations with unions and employees;
•unanticipated or higher costs associated with pension and OPEB obligations resulting from changes in the value of plan assets or contribution increases required for unfunded obligations;
•uncertain availability or cost of skilled workers to fill critical operational positions and potential labor shortages caused by experienced employee attrition or otherwise, as well as our ability to attract, hire, develop and retain key personnel;
•the amount and timing of any repurchases of our common shares; and
•potential significant deficiencies or material weaknesses in our internal control over financial reporting.
For additional factors affecting our business, refer to Part II – Item 1A. Risk Factors of this Quarterly Report on Form 10-Q. You are urged to carefully consider these risk factors.
Forward-looking and other statements in this Quarterly Report on Form 10-Q regarding our GHG reduction plans and goals are not an indication that these statements are necessarily material to investors or required to be disclosed in our filings with the SEC. In addition, historical, current and forward-looking GHG-related statements may be based on standards for measuring progress that are still developing, internal controls and processes that continue to evolve and assumptions that are subject to change in the future.
| | |
|
| ITEM 3. QUANTITATIVE AND QUALITATIVE DISCLOSURES ABOUT MARKET RISK |
Information regarding our market risk is presented under the caption "Market Risks," which is included in our Annual Report on Form 10-K for the year ended December 31, 2022, and Part I – Item 2. Management's Discussion and Analysis of Financial Condition and Results of Operations of this Quarterly Report on Form 10-Q.
| | |
|
| ITEM 4. CONTROLS AND PROCEDURES |
We maintain disclosure controls and procedures that are designed to ensure that information required to be disclosed in our Exchange Act reports is recorded, processed, summarized and reported within the time periods specified in the SEC’s rules and forms, and that such information is accumulated and communicated to our management, including our President and Chief Executive Officer and Chief Financial Officer, as appropriate, to allow timely decisions regarding required disclosure based solely on the definition of “disclosure controls and procedures” in Rule 13a-15(e) promulgated under the Exchange Act. In designing and evaluating the disclosure controls and procedures, management recognized that any controls and procedures, no matter how well designed and operated, can provide only reasonable assurance of achieving the desired control objectives, and management necessarily was required to apply its judgment in evaluating the cost-benefit relationship of possible controls and procedures.
As of the end of the period covered by this report, we carried out an evaluation under the supervision and with the participation of our management, including our President and Chief Executive Officer and our Chief Financial Officer, of the effectiveness of the design and operation of our disclosure controls and procedures. Based on the foregoing, our President and Chief Executive Officer and Chief Financial Officer concluded that our disclosure controls and procedures were effective.
There was no change in the Company’s internal control over financial reporting during the quarter ended March 31, 2023 that materially affected, or is reasonably likely to materially affect, our internal control over financial reporting.
PART II - OTHER INFORMATION
| | |
|
| ITEM 1. LEGAL PROCEEDINGS |
Environmental Matters. SEC regulations require us to disclose certain information about administrative or judicial proceedings involving the environment and to which a governmental authority is a party if we reasonably believe that such proceedings may result in monetary sanctions above a stated threshold. Pursuant to SEC regulations, we use a threshold of $1 million for purposes of determining whether disclosure of any such proceedings is required. We believe that this threshold is reasonably designed to result in disclosure of any such proceedings that are material to our business or financial condition.
We have described the other material pending legal proceedings, including administrative or judicial proceedings involving the environment, to which we are a party in our Annual Report on Form 10-K for the year ended December 31, 2022, and in NOTE 17 - COMMITMENTS AND CONTINGENCIES to the consolidated financial statements in Part I – Item 1. Financial Statements of this Quarterly Report on Form 10-Q, which is incorporated herein by reference.
We caution readers that our business activities involve risks and uncertainties that could cause actual results to differ materially from those currently expected by management. We described the most significant risks that could impact our results in Part I, Item 1A, "Risk Factors" in our Annual Report on Form 10-K for the year ended December 31, 2022.
| | |
|
| ITEM 2. UNREGISTERED SALES OF EQUITY SECURITIES AND USE OF PROCEEDS |
The following table presents information with respect to repurchases by the Company of our common shares during the periods indicated:
ISSUER PURCHASES OF EQUITY SECURITIES
| | | | | | | | | | | | | | | | | | | | | | | | | | |
| Period | | Total Number of Shares (or Units) Purchased1 | | Average Price Paid per Share (or Unit) | | Total Number of Shares (or Units) Purchased as Part of Publicly Announced Plans or Programs | | Maximum Number (or Approximate Dollar Value) of Shares (or Units) that May Yet Be Purchased Under the Plans or Programs2 |
| January 1 - 31, 2023 | | 940,192 | | | $ | 17.22 | | | — | | | $ | 760,216,700 | |
| February 1 - 28, 2023 | | 1,169 | | | $ | 18.36 | | | — | | | $ | 760,216,700 | |
| March 1 - 31, 2023 | | 113,181 | | | $ | 19.85 | | | — | | | $ | 760,216,700 | |
| Total | | 1,054,542 | | | $ | 17.50 | | | — | | | |
| | | | | | | | |
1 Includes 940,192 shares that were delivered to us in January 2023, 1,169 shares that were delivered to us in February 2023, and 113,181 shares that were delivered to us in March 2023 to satisfy tax withholding obligations due upon the vesting or payment of stock awards. |
2 On February 11, 2022, we announced that our Board of Directors authorized a program to repurchase our outstanding common shares in the open market or in privately negotiated transactions, which may include purchases pursuant to Rule 10b5-1 plans or accelerated share repurchases, up to a maximum of $1 billion. We are not obligated to make any purchases, and the program may be suspended or discontinued at any time. The share repurchase program does not have a specific expiration date. |
| | |
|
| ITEM 4. MINE SAFETY DISCLOSURES |
We are committed to protecting the occupational health and well-being of each of our employees. Safety is one of our core values and we strive to ensure that safe production is the first priority for all employees. Our internal objective is to achieve zero injuries and incidents across the Company by focusing on proactively identifying needed prevention activities, establishing standards and evaluating performance to mitigate any potential loss to people, equipment, production and the environment. We have implemented intensive employee training that is geared toward maintaining a high level of awareness and knowledge of safety and health issues in the work environment through the development and coordination of requisite information, skills and attitudes. We believe that through these policies, we have developed an effective safety management system.
Under the Dodd-Frank Act, each operator of a coal or other mine is required to include certain mine safety results within its periodic reports filed with the SEC. As required by the reporting requirements included in §1503(a) of the Dodd-Frank Act and Item 104 of Regulation S-K, the information concerning mining safety and health or other regulatory matters for each of our mine locations that are covered under the scope of the Dodd-Frank Act are included in Exhibit 95 of Part II – ITEM 6. EXHIBITS of this Quarterly Report on Form 10-Q.
| | |
|
| ITEM 5. OTHER INFORMATION |
None.All documents referenced below have been filed pursuant to the Securities Exchange Act of 1934 by Cleveland-Cliffs Inc., file number 1-09844, unless otherwise indicated.
| | | | | | | | |
Exhibit
Number | | Exhibit |
| | * Form of Cleveland-Cliffs Inc. 2021 Equity and Incentive Compensation Plan Restricted Stock Unit Award Memorandum and Restricted Stock Unit Award Agreement (filed herewith). |
| | * Form of Cleveland-Cliffs Inc. 2021 Equity and Incentive Compensation Plan Performance Share Award Memorandum (TSR) and Performance Share Award Agreement (filed herewith). |
| | * Form of Cleveland-Cliffs Inc. 2021 Equity and Incentive Compensation Plan Cash Incentive Award Memorandum (TSR) and Cash Incentive Award Agreement (TSR) (filed herewith). |
| | Schedule of the obligated group, including the parent and issuer and the subsidiary guarantors that have guaranteed the obligations under the 6.75% 2026 Senior Secured Notes, the 5.875% 2027 Senior Notes, the 7.00% 2027 Senior Notes, the 4.625% 2029 Senior Notes and the 4.875% 2031 Senior Notes issued by Cleveland-Cliffs Inc. (filed herewith). |
| | Certification Pursuant to 15 U.S.C. Section 7241, as Adopted Pursuant to Section 302 of the Sarbanes-Oxley Act of 2002, signed and dated by Lourenco Goncalves as of April 26, 2023 (filed herewith). |
| | Certification Pursuant to 15 U.S.C. Section 7241, as Adopted Pursuant to Section 302 of the Sarbanes-Oxley Act of 2002, signed and dated by Celso L. Goncalves Jr. as of April 26, 2023 (filed herewith). |
| | Certification Pursuant to 18 U.S.C. Section 1350, as Adopted Pursuant to Section 906 of the Sarbanes-Oxley Act of 2002, signed and dated by Lourenco Goncalves, Chairman, President and Chief Executive Officer of Cleveland-Cliffs Inc., as of April 26, 2023 (filed herewith). |
| | Certification Pursuant to 18 U.S.C. Section 1350, as Adopted Pursuant to Section 906 of the Sarbanes-Oxley Act of 2002, signed and dated by Celso L. Goncalves Jr., Executive Vice President, Chief Financial Officer of Cleveland-Cliffs Inc., as of April 26, 2023 (filed herewith). |
| | Mine Safety Disclosures (filed herewith). |
| 101 | | The following financial information from Cleveland-Cliffs Inc.'s Quarterly Report on Form 10-Q for the quarterly period ended March 31, 2023 formatted in Inline XBRL (Extensible Business Reporting Language) includes: (i) the Statements of Unaudited Condensed Consolidated Financial Position, (ii) the Statements of Unaudited Condensed Consolidated Operations, (iii) the Statements of Unaudited Condensed Consolidated Comprehensive Income (Loss), (iv) the Statements of Unaudited Condensed Consolidated Cash Flows, (v) the Statements of Unaudited Condensed Consolidated Changes in Equity, and (vi) Notes to the Unaudited Condensed Consolidated Financial Statements. |
| 104 | | The cover page from this Quarterly Report on Form 10-Q, formatted in Inline XBRL and contained in Exhibit 101. |
| | |
| * | | Indicates management contract or other compensatory arrangement. |
SIGNATURES
Pursuant to the requirements of the Securities Exchange Act of 1934, the Registrant has duly caused this report to be signed on its behalf by the undersigned, thereunto duly authorized.
| | | | | | | | | | | | | | | | | | | | | | | |
| | | CLEVELAND-CLIFFS INC. |
| | | | |
| | | By: | | /s/ Kimberly A. Floriani |
| | | | | Name: | | Kimberly A. Floriani |
| | | | | Title: | | Senior Vice President, Controller & Chief Accounting Officer |
| | | | | | | |
| Date: | April 26, 2023 | | | | | | |