UNITED STATES SECURITIES AND EXCHANGE COMMISSION
Washington, D.C. 20549
FORM 10-K
ANNUAL REPORT
PURSUANT TO SECTIONS 13 OR 15(d) OF THE
SECURITIES EXCHANGE ACT OF 1934
| x | ANNUAL REPORT PURSUANT TO SECTION 13 OR 15(d) OF THE SECURITIES EXCHANGE ACT OF 1934 |
For the fiscal year ended December 31, 2006
OR
| ¨ | TRANSITION REPORT PURSUANT TO SECTION 13 OR 15(d) OF THE SECURITIES EXCHANGE ACT OF 1934 |
For the transition period from to
Commission File Number: 1-8944
Cleveland-Cliffs Inc
(Exact name of registrant as specified in its charter)
| Ohio | 34-1464672 | |
| (State or other jurisdiction of incorporation) |
(I.R.S. Employer Identification No.) | |
| 1100 Superior Avenue, Cleveland, Ohio |
44114-2544 | |
| (Address of principal executive offices) | (Zip Code) | |
Registrant’s telephone number, including area code: (216) 694-5700
Securities Registered Pursuant to Section 12(b) of the Act:
| Title of Each Class |
Name of Each Exchange on Which Registered | |
| Common Shares, par value $.25 per share | New York Stock Exchange and Chicago Stock Exchange | |
| Rights to Purchase Common Shares | New York Stock Exchange and Chicago Stock Exchange | |
Securities Registered Pursuant to Section 12(g) of the Act:
NONE
Indicate by check mark if the registrant is a well-known seasoned issuer, as defined in Rule 405 of the Securities Act. Yes x No ¨
Indicate by check mark if the registrant is not required to file reports pursuant to Section 13 or Section 15(d) of the Act. Yes ¨ No x
Indicate by check mark whether the registrant: (1) has filed all reports required to be filed by Section 13 or 15(d) of the Securities Exchange Act of 1934 during the preceding 12 months (or for such shorter period that the registrant was required to file such reports), and (2) has been subject to such filing requirements for the past 90 days. Yes ¨ No x
Indicate by check mark if disclosure of delinquent filers pursuant to Item 405 of the Regulation S-K is not contained herein, and will not be contained, to the best of registrant’s knowledge, in definitive proxy or information statements incorporated by reference in Part III of this Form 10-K or any amendment to this Form 10-K. ¨
Indicate by check mark whether the registrant is a large accelerated filer, an accelerated filer, or a non-accelerated filer.
Large accelerated filer x Accelerated filer ¨ Non-accelerated filer ¨.
Indicate by check mark whether the registrant is a shell company (as defined in Rule 12b-2 of the Exchange Act). Yes ¨ No x
As of June 30, 2006, the aggregate market value of the voting and non-voting stock held by non-affiliates of the registrant, based on the closing price of $39.65 per share as reported on the New York Stock Exchange — Composite Index was $1,670,340,942 (excluded from this figure is the voting stock beneficially owned by the registrant’s officers and directors).
The number of shares outstanding of the registrant’s Common Shares, par value $.25 per share, was 41,026,089 as of May 18, 2007.
| Page No. | ||||
| 2 | ||||
| Part I |
||||
| Item 1. |
5 | |||
| Item 1A. |
15 | |||
| Item 1B. |
25 | |||
| Item 2. |
25 | |||
| Item 3. |
36 | |||
| Item 4. |
40 | |||
| Part II |
||||
| Item 5. |
42 | |||
| Item 6. |
44 | |||
| Item 7. |
Management’s Discussion and Analysis of Financial Condition and Results of Operations |
46 | ||
| Item 7A. |
66 | |||
| Item 8. |
67 | |||
| Item 9. |
Changes in and Disagreements With Accountants on Accounting and Financial Disclosure |
118 | ||
| Item 9A. |
118 | |||
| Item 9B. |
119 | |||
| Part III |
||||
| Item 10. |
120 | |||
| Item 11. |
122 | |||
| Item 12. |
Security Ownership of Certain Beneficial Owners and Management and Related Stockholder Matters |
153 | ||
| Item 13. |
Certain Relationships and Related Transactions, and Director Independence |
157 | ||
| Item 14. |
158 | |||
| Part IV |
||||
| Item 15. |
159 | |||
| 160 | ||||
The following abbreviations or acronyms are used in the text. References in this report to the “Company”, “we”, “us”, “our” and “Cliffs” are to Cleveland-Cliffs Inc and subsidiaries, collectively. References to “A$” refer to Australian currency, “C$” to Canadian currency and “$” to United States currency.
| Abbreviation or acronym |
Term | |
| Acme |
Acme Metals Incorporated | |
| Algoma |
Algoma Steel Inc. | |
| AOC |
Administrative Order by Consent | |
| APBO |
Accumulated other postretirement benefit obligation | |
| Arcelor |
Arcelor S.A. | |
| ARS |
Auction rate securities | |
| BACT |
Best Available Control Technology | |
| Bethlehem |
Bethlehem Steel Corporation | |
| BHP |
BHP Billiton | |
| CAL |
Cliffs and Associates Limited | |
| CCAA |
Companies’ Creditors Arrangement Act | |
| Centennial Amapa |
Centennial Asset Participacoes Amapa S.A. | |
| CERCLA |
Comprehensive Environmental Response, Compensation and Liability Act | |
| Cliffs Asia Pacific |
Cliffs Asia-Pacific Pty Limited | |
| Cockatoo Island |
Cockatoo Island Joint Venture | |
| CVRD |
Companhia Vale do Rio Doce | |
| Dofasco |
Dofasco Inc | |
| DRI |
Direct Reduced Iron | |
| EITF |
Emerging Issues Task Force | |
| Empire |
Empire Iron Mining Partnership | |
| EPA |
United States Environmental Protection Agency | |
| EPS |
Earnings per share | |
| Eveleth Mines |
Eveleth Mines LLC | |
| FASB |
Financial Accounting Standards Board | |
| Ferrominera |
C.V.G. Ferrominera Orinoco C.A. of Venezuela | |
| F.O.B. |
Free on board | |
| FSP |
FASB Staff Position | |
| GAAP |
accounting principles generally accepted in the United States | |
| GAM |
Group Annuity Mortality | |
| HAP |
Hazardous air pollutants | |
| HBI |
Hot Briquette Iron | |
| Hibbing |
Hibbing Taconite Company | |
| HLE |
HLE Mining Limited Partnership | |
| HWE |
Henry Walker Eltin | |
| ISG |
International Steel Group Inc. | |
| Ispat |
Ispat Inland Steel Company | |
| JORC |
Joint Ore Reserves Code | |
| Kobe Steel |
Kobe Steel, LTD. | |
| Laiwu |
Laiwu Steel Group, Ltd. | |
| LIBOR |
London Interbank Offered Rate | |
| LTI |
Lost Time Injuries | |
| LTIFR |
Lost Time Injury Frequency Rate | |
| LTVSMC |
LTV Steel Mining Company | |
| MACT |
Maximum Achievable Control Technology |
2
| Abbreviation or acronym |
Term | |
| Mittal |
Mittal Steel Company N.V. | |
| Mittal Steel USA |
Mittal Steel USA Inc. | |
| MMBTU |
Million Million British Thermal Units | |
| MSHA |
Mine Safety and Health Administration | |
| NDEP |
Nevada Department of Environmental Protection | |
| Northshore |
Northshore Mining Company | |
| NRD |
Natural Resource Damages | |
| OPEB |
Other postretirement benefits | |
| PBO |
Projected Benefit Obligation | |
| PCB |
Polychlorinated Biphenyl | |
| PolyMet |
PolyMet Mining Inc. | |
| Portman |
Portman Limited | |
| PPI |
Producers Price Indices | |
| PRP |
Potentially responsible party | |
| PSD |
Prevention of Significant Deterioration | |
| Reserve |
Reserve Mining Co. | |
| Rouge |
Rouge Industries, Inc. | |
| RTWG |
Rio Tinto Working Group | |
| SEC |
United States Securities and Exchange Commission | |
| Severstal |
Severstal North America, Inc. | |
| SFAS |
Statement of Financial Accounting Standards | |
| Steel Dynamics |
Steel Dynamics, Inc. | |
| Stelco |
Stelco Inc. | |
| Tilden |
Tilden Mining Company L.C. | |
| Tonne |
Metric ton | |
| United Taconite |
United Taconite LLC | |
| USW |
United Steelworkers of America | |
| VEBA |
Voluntary Employee Benefit Association trusts | |
| VNQDC |
Voluntary Non-Qualified Deferred Compensation Plan | |
| Wabush |
Wabush Mines Joint Venture | |
| WCI |
WCI Steel Inc. | |
| Weirton |
Weirton Steel Corporation | |
| WEPCO |
Wisconsin Electric Power Company |
3
Explanatory Note
The filing of the Company’s Form 10-K for the year-ended December 31, 2006 was late due to a comprehensive review of the Company’s application of SFAS 133, Accounting for Derivative Instruments and Hedging Activities, in relation to its long-term North American pellet supply agreements. The filing was initially delayed due to a review undertaken in connection with a concern raised anonymously through the Company’s Ethics Hotline. The concern focused on a specific contract revenue accounting item that allegedly affected the fourth quarter of 2006. The Company’s Audit Committee, following an investigation by internal audit and outside legal counsel, found no merit or substance to the allegation.
While the Hotline allegation was found to be without merit, a review of revenue recognition policies was undertaken. The Company, with the assistance of outside consultants, conducted a detailed review of price adjustment factors contained in the Company’s North American long-term pellet supply agreements to determine whether any of those factors meet the definition of embedded derivatives that are required be accounted for as derivatives separate from the supply agreement under the provisions of SFAS 133. The identification of and accounting for derivative instruments under SFAS 133 can be extremely detailed and complex. However, it was determined after the review that price adjustment variables included in our supply agreements are clearly and closely related to the underlying sales contracts, and therefore need not be bifurcated and separately accounted for. As a result, no significant accounting adjustments were required.
4
PART I
Introduction
Founded in 1847, Cleveland-Cliffs Inc is the largest producer of iron ore pellets in North America. We sell substantially all of our pellets to integrated steel companies in the United States and Canada. On April 19, 2005, Cliffs Asia Pacific, a wholly owned subsidiary of the Company, completed the acquisition of 80.4 percent of Portman, an iron ore mining company in Australia. The acquisition was initiated on March 31, 2005 by the purchase of 68.7 percent of the outstanding shares of Portman. The acquisition increased our customer base in China and Japan and established our presence in the Australian mining industry.
Prior to 2002, we primarily held a minority interest in the mines we managed, with the majority interest in the mines held by various North American steel companies. Our earnings were principally comprised of royalties and management fees paid by the partnerships, along with sales of our equity share of the mine pellet production. Faced with marked deterioration in the financial condition of many of our partners and customers, we embarked on a strategy to reposition ourselves from a manager of iron ore mines on behalf of steel company partners to primarily a merchant of iron ore through increasing our ownership interests in our managed mines.
Our successful navigation of numerous customer and partner bankruptcies and the corresponding consolidation of the industry in recent years have resulted in our emerging with new long-term supply agreements, at more favorable pricing, with steel company partners and customers that are financially stronger than their predecessors. One example is the former ISG, which consolidated several bankrupt steel companies. We entered into a 15-year term sales agreement to supply all of ISG’s pellet requirements for its Cleveland and Indiana Harbor plants. In 2002, we also invested $13.0 million in ISG to support its acquisition of bankrupt LTV Corporation’s idled steelmaking assets, receiving a seven percent stake in return. Later in 2002, we invested another $4.4 million to support ISG’s acquisition of the steelmaking assets of Acme and invested another $10.7 million of pension trust assets in 2003 to support ISG’s acquisition of Bethlehem’s assets. In conjunction with its acquisition of Bethlehem, ISG acquired Bethlehem’s 62.3 percent equity interest in Hibbing. Through these investments, we received 5.9 million shares (5.1 million shares directly-held and .8 million shares held in our pension trust) in return for our original investment. Also in 2004, ISG acquired the bankrupt assets of Weirton and Georgetown Steel Corporation. In conjunction with its acquisition of Weirton, ISG assumed our term supply agreement with Weirton with some modifications.
ISG agreed to merge with Mittal, the parent company of Ispat, in 2005, resulting in the world’s largest steel company. Effective January 3, 2006, Ispat was merged with and into Mittal Steel USA ISG Inc. and renamed Mittal Steel USA. In June 2006, Mittal further extended its position in the steel industry when it merged with Arcelor, creating a steelmaker with an estimated capacity in excess of 100 million tonnes.
In 2004, we also significantly improved our liquidity initially through our January, 2004 offering of $172.5 million of redeemable cumulative convertible perpetual preferred stock. The proceeds from the issuance were utilized to repay the remaining $25 million balance of our unsecured notes and to fund $76.1 million into our underfunded salaried and hourly pension funds and VEBAs. Additionally, the proceeds from the sale of ISG stock and cash flow from operations provided us with the liquidity for capital expenditures to maintain and expand our production capacity and to complete the acquisition of Portman.
On March 5, 2007, we acquired a 30 percent interest in MMX Amapa Mineracao LTDA., a Brazilian limited liability company developing an iron ore project (Amapa Project), through the acquisition of 100 percent of the shares of Centennial Amapa. The remaining 70 percent of the Amapa Project is owned by MMX Mineracao e Metallicos S.A., which is providing corporate and institutional support, while we will supply technical support for construction and operations. The purchase price for our 30 percent interest was $133 million, paid with cash on hand. Total capital expenditures are estimated to be $357 million, of which approximately $268 million will be funded with project debt. Capital contributions of $89.3 million were paid by Cliffs and MMX to fund the project; Cliffs 30 percent share was $26.8 million. We may be responsible for 30 percent of any additional capital contributions.
5
The Amapa Project consists of a significant iron ore deposit, a 192-kilometer railway connecting the mine location to an existing port facility and 71 hectares of real estate on the banks of the Amazon River, reserved for a loading terminal. The Amapa Project is currently under construction and is expected to produce 6.5 million tonnes of iron ore concentrate annually once fully operational. Iron ore concentrate is expected to be sold, pursuant to a long-term supply agreement, to an operator of an iron oxide pelletizing plant in the Kingdom of Bahrain. Production is expected to begin in late 2007.
On April 18, 2007, we completed the acquisition at an effective 45 percent interest in the Sonoma Coal Project in Queensland, Australia. As of May 3, 2007, we invested $15.6 million toward the purchase of mining tenements and $19.4 million toward the construction of a washplant. We will operate and own 100 percent of the washplant and 8.3 percent of the mining leases, resulting in a 45 percent economic interest in Sonoma.
The Sonoma Coal Project is expected to initially produce two million tonnes of marketable coal annually, beginning late in 2007. Production from Sonoma will include an approximately equal mix of hard coking coal and thermal coal. Plans call for annual production to increase to between three million and four million tonnes during 2008. The Sonoma Coal Project has a current resource estimate of 107 million tonnes.
We are evaluating opportunities to proceed with development of a commercial-scale reduced iron plant, which will convert taconite into nearly pure iron in nugget form utilizing Kobe Steel’s ITmk3 technology. The high-iron-content product could be utilized to replace steel scrap as a raw material for electric steel furnaces or basic oxygen furnaces of integrated steel producers or as feedstock for the foundry industry.
We intend to continue to pursue investment and operations management opportunities to broaden our scope as a supplier of iron ore or other raw materials to the integrated steel industry through the acquisition of additional mining interests to strengthen our market position. We are particularly focused on expanding our international investments to capitalize on global demand for steel and iron ore.
Our strategic redirection and acceptance of additional risks of increased mine ownership followed by significant increases in iron ore demand and pricing culminated in record operating income in 2004, 2005 and 2006, solid financial condition, and a strong base for future growth. In the last five years, our revenues have increased over 220 percent from $.6 billion in 2002 to $1.9 billion in 2006. Our net income increased to $280 million in 2006 from a loss of $188 million in 2002.
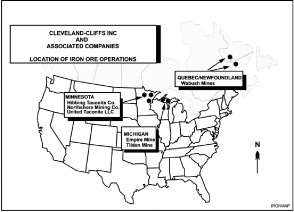
North America
We manage and operate six North American iron ore mines located in Michigan, Minnesota and Eastern Canada that currently have a rated capacity of 37.0 million tons of iron ore pellet production annually, representing approximately 46 percent of total North American pellet production capacity. Based on our percentage ownership of the North American mines we operate, our share of the rated pellet production capacity is currently 22.9 million tons annually, representing approximately 28 percent of total North American annual pellet capacity.
6
The following chart summarizes the estimated annual production capacity and percentage of total North American pellet production capacity for each of the North American iron ore pellet producers as of December 31, 2006:
North American Iron Ore Pellet
Annual Rated Capacity Tonnage
| Current Estimated Capacity (Gross Tons of Raw Ore in Millions) |
Percent of Total North American Capacity |
||||
| All Cliffs’ managed mines |
37.0 | 45.6 | % | ||
| Other U.S. mines |
|||||
| U.S. Steel’s Minnesota ore operations |
|||||
| Minnesota Taconite |
14.6 | 18.0 | |||
| Keewatin Taconite |
5.4 | 6.6 | |||
| Total U.S. Steel |
20.0 | 24.6 | |||
| Mittal Steel USA Minorca mine |
2.9 | 3.6 | |||
| Total Other U.S. mines |
22.9 | 28.2 | |||
| Other Canadian mines |
|||||
| Iron Ore Company of Canada |
12.3 | 15.2 | |||
| Quebec Cartier Mining Co. |
8.9 | 11.0 | |||
| Total Other Canadian mines |
21.2 | 26.2 | |||
| Total North American mines |
81.1 | 100.0 | % | ||
We sell our share of North American iron ore production to integrated steel producers, generally pursuant to term supply agreements with various price adjustment provisions.
For the year ended December 31, 2006, we produced a total of 33.6 million tons of iron ore pellets, including 20.8 million tons for our account and 12.8 million tons on behalf of steel company owners of the mines.
Australia
Portman was founded in 1925 and had undergone a number of management and business changes before establishing itself as a mineral producer in the early 1990’s. Following the sale of its Queensland-based coking coal operations in 1999, Portman focused on its Western Australia iron ore deposits at the Koolyanobbing operations and Cockatoo Island. Portman’s 100 percent owned Koolyanobbing mining operations and its 50 percent equity interest in Cockatoo Island represent Portman’s only significant operations. Portman serves the Asian iron ore markets with direct-shipping fines and lump ore. Portman’s 2006 production (excluding its .7 million tonne share of Cockatoo Island) was approximately seven million tonnes. Portman completed a $62 million project to increase its wholly owned production capacity to eight million tonnes per year in the first half of 2006. Portman’s production is fully committed to steel companies in China and Japan through 2009.
Business Segments
We primarily evaluate performance based on segment operating income, defined as revenues less expenses identifiable to each segment. We have classified certain administrative expenses as unallocated corporate expense. As a result of the Portman acquisition, we organized into two operating and reporting segments: North America and Australia. The North America segment is comprised of our mining operations in the United States and Canada. The Australia segment is comprised of our 80.4 percent Portman interest in Western Australia.
Financial information about our segments is included in Item 7 and NOTE 4 — SEGMENT REPORTING — included in Item 8 of this Annual Report on Form 10-K.
North America Segment
The North America segment is comprised of our six iron ore mining operations in Michigan, Minnesota and Eastern Canada. We produce 13 grades of iron ore pellets, including standard, fluxed and high manganese, for
7
use in our customers’ blast furnaces as part of the steelmaking process. The variation in grades results from the specific chemical and metallurgical properties of the ores at each mine and whether or not fluxstone is added in the process. Although the grade or grades of pellets currently delivered to each customer are based on that customer’s preferences, which depend in part on the characteristics of the customer’s blast furnace operation, in many cases our iron ore pellets can be used interchangeably. Industry demand for the various grades of iron ore pellets depends on each customer’s preferences and changes from time to time. In the event that a given mine is operating at full capacity, the terms of most of our pellet supply agreements allow some flexibility to provide our customers iron ore pellets from different mines.
Standard pellets require less processing, are generally the least costly pellets to produce and are called “standard” because no ground fluxstone (i.e., limestone, dolomite, etc.) is added to the iron ore concentrate before turning the concentrates into pellets. In the case of fluxed pellets, fluxstone is added to the concentrate, which produces pellets that can perform at higher productivity levels in the customer’s specific blast furnace and will minimize the amount of fluxstone the customer may be required to add to the blast furnace. “High manganese” pellets are the pellets produced at our Canadian Wabush operation where there is more natural manganese in the crude ore than is found at our other operations. The manganese contained in the iron ore mined at Wabush cannot be entirely removed during the concentrating process. Wabush produces pellets with two levels of manganese, both in standard and fluxed grades.
It is not possible to produce pellets with identical physical and chemical properties from each of our mining and processing operations. The grade or grades of pellets purchased by and delivered to each customer are based on that customer’s preferences and availability.
Each of our North American mines is located near the Great Lakes or, in the case of Wabush, near the St. Lawrence Seaway, which is connected to the Great Lakes. The majority of our iron ore pellets are transported via railroads to loading ports for shipment via vessel to Canada, the United States or other international destinations or shipped as concentrates for sinter feed.
North American Iron Ore Customers
More than 98 percent of our North American revenues are derived from sales of iron ore pellets to the North American integrated steel industry, consisting of eight customers. Generally, we have multi-year supply agreements with our customers. Sales volume under these agreements is largely dependent on customer requirements, and in many cases, we are the sole supplier of iron ore pellets to the customer. Each agreement has a base price that is adjusted annually using one or more adjustment factors. Factors that can adjust price include measures of general industrial inflation, steel prices and international pellet prices. One of our supply agreements has a provision that limits the amount of price increase or decrease in any given year.
During 2006, 2005 and 2004, we sold 20.4 million, 22.3 million and 22.6 million tons of iron ore pellets, respectively, from our share of the production from our North American iron ore mines. Sales in 2006 were to eight North American, one European, one Japanese and four Chinese steel producers.
The following five customers together accounted for a total of 91, 93 and 94 percent of North American Revenues from product sales and services for the years 2006, 2005 and 2004, respectively:
| Percent of Sales Revenues* |
|||||||||
| Customer |
2006 | 2005 | 2004 | ||||||
| Mittal Steel USA |
44 | % | 43 | % | 56 | % | |||
| Algoma |
20 | 22 | 14 | ||||||
| Severstal |
13 | 12 | 13 | ||||||
| WCI |
9 | 8 | 6 | ||||||
| Stelco |
5 | 8 | 5 | ||||||
| Total |
91 | % | 93 | % | 94 | % | |||
| * | Excluding freight and venture partners’ cost reimbursements. |
8
Our term supply agreements expire between the end of 2010 and the end of 2018. The weighted average remaining duration is eight years.
Our sales are influenced by seasonal factors in the first quarter of the year as shipments and sales are restricted by weather conditions on the Great Lakes. During the first quarter, we continue to produce our products, but we cannot ship those products via lake freighter until the Great Lakes are passable, which causes our first quarter inventory levels to rise. Our limited practice of shipping product to ports on the lower Great Lakes and/or to customers’ facilities prior to the transfer of title has somewhat mitigated the seasonal effect on first quarter inventories and sales. At December 31, 2006, we had approximately .8 million tons of pellets in inventory at lower lakes or customers’ facilities.
In 2006, 73 percent of our North American product revenues (68 percent and 80 percent in 2005 and 2004, respectively) were derived from sales to our U.S. customers.
Mittal Steel USA
On December 17, 2004, Ispat International N.V. completed its acquisition of LNM Holdings N.V. to form Mittal. On April 13, 2005, Mittal completed its acquisition of ISG, subsequently renamed Mittal Steel USA. At the time of the acquisition of ISG, we had three different supply agreements with steel companies that became part of Mittal Steel USA:
| • | Ispat. Ispat was a wholly owned subsidiary of Ispat International N.V. On December 31, 2002, we entered into a Pellet Sale and Purchase Agreement with Ispat (the “Ispat Contract”), which provides that we are the sole outside supplier of iron ore pellets to Ispat. The Ispat Contract runs through January 2015. |
| • | Mittal ISG. We entered into a Pellet Sale and Purchase Agreement with ISG on April 10, 2002, which runs through 2016 (the “ISG Contract”), under which we are the sole supplier of iron ore pellets for the former ISG’s Cleveland and Indiana Harbor Works. The ISG Contract was subsequently amended in December 2004. |
| • | Mittal Steel-Weirton (formerly Weirton). Prior to the acquisition of ISG by Mittal, ISG had acquired Weirton, which was in chapter 11 bankruptcy at the time. We were one of two suppliers of iron ore pellets to Weirton. At the time of ISG’s acquisition of Weirton, we entered into an Amended and Restated Pellet Sale and Purchase Agreement dated May 17, 2004, with both ISG and Weirton (the “Weirton Contract”). The Weirton Contract runs through 2018. |
In December 2005, Mittal merged Ispat into Mittal Steel USA and Mittal Steel USA assumed Ispat’s obligations under the Ispat Contract. Mittal Steel USA is a 62.3 percent equity participant in Hibbing and a 21 percent equity partner in Empire.
Our North American pellet sales totaled 20.4 million, 22.3 million and 22.6 million tons in 2006, 2005 and 2004, respectively, with pellet sales to Mittal Steel USA representing approximately 45, 48 and 51 percent of North American sales volume for the respective periods.
In 2005, Mittal Steel USA shut down Mittal Steel-Weirton’s blast furnace. The Weirton Contract had a minimum annual purchase obligation and required Mittal Steel-Weirton to purchase “for the years 2004 and 2005 the greater of 67 percent of Mittal Steel-Weirton’s total annual iron ore pellet requirements, or 1.5 million tons and, for the years 2006 through and including 2018, a tonnage amount equal to Mittal Steel-Weirton’s total annual iron ore pellet tonnage requirements, with a minimum annual purchase obligation of two million tons per year, required for consumption in Mittal Steel-Weirton’s iron and steelmaking facilities in any year at Mittal Steel-Weirton”. During 2005, Mittal Steel USA advised us that the Mittal Steel-Weirton blast furnace has been permanently shut down and will not be restarted.
On March 19, 2007, we executed an umbrella agreement with Mittal Steel USA that covers significant price and volume matters under three separate pre-existing iron ore pellet supply agreements with Cliffs for Mittal Steel USA’s Cleveland and Indiana Harbor West, Indiana Harbor East and Weirton facilities. This umbrella agreement formalizes a previously disclosed letter agreement dated April 12, 2006.
9
Under terms of the umbrella agreement, the Pellet Sale and Purchase Agreement dated as of April 10, 2002 for ISG Indiana Harbor, as previously amended, the Pellet Sale and Purchase Agreement, dated as of December 31, 2006 for Ispat Inland, and the Amended and Restated Pellet Sale and Purchase Agreement dated as of May 17, 2004 for ISG Weirton are modified to aggregate Mittal Steel USA’s purchases during the years 2006 through and including 2010 under the umbrella agreement. The pricing provisions are determined in accordance with the supply agreements for each of the covered facilities in the three agreements listed above.
During 2006 through 2010, Mittal Steel USA is obligated to purchase specified minimum tonnages of iron ore pellets on an aggregate basis. Mittal Steel USA is permitted under the umbrella agreement to transfer any of the committed volume for use at any iron and steel facility(s) owned directly or indirectly by Mittal Steel Company N.V., which enhances flexibility. The umbrella agreement also sets the minimum annual tonnage at Mittal Steel USA’s approximately budgeted usage levels through 2010, with pricing then in effect at the facility where the pellets are delivered. Beginning in 2007, the terms of the umbrella agreement allow Mittal Steel USA to manage its ore inventory levels through buydown provisions, which permit Mittal Steel USA to reduce its tonnage purchase obligation each year at a specified price per ton, and through deferral provisions, which permit Mittal Steel USA to defer a portion of its annual tonnage purchase obligation beginning in 2007. Mittal Steel USA has opted to defer the purchase of 550,000 tons from 2007 to 2008. The umbrella agreement also provides for consistent nomination procedures through 2010 across all three iron ore pellet supply agreements.
As a condition of approving Mittal’s merger with Arcelor, the U.S. Department of Justice mandated that Arcelor-Mittal sell one of its three North American steel plants in order to satisfy requirements involving antitrust concerns. On February 20, 2007, the Department of Justice announced that it would require Mittal Steel USA to divest its Sparrows Point facility, located in Baltimore, Maryland. We have not historically supplied iron ore to the Sparrows Point facility.
Algoma
Algoma is Canada’s third-largest steelmaker. We have a 15-year term supply agreement under which we are Algoma’s sole supplier of iron ore pellets through 2016 (the “Algoma Agreement”). Pricing under the Algoma Agreement is based on a formula linked to international pellet prices (the “Pricing Formula”). The Algoma Agreement also provides that in certain years either party may request a price negotiation (“Reopener Years”) if prices under the Algoma Agreement differ from a specified benchmark price. The Reopener Years are 2008, 2011, and 2014. We anticipate that Algoma will take the position that any change resulting from a requested price renegotiation would be retroactive to the beginning of the years preceding the Reopener Years, i.e., 2007, 2010, and 2013. Our position is that any price change would be retroactive to the beginning of the Reopener Years. If we are unable to reach agreement with Algoma on this issue, any dispute is likely to be resolved through binding arbitration which would occur in 2008. The amount of the variance, if any, between the Pricing Formula and the benchmark price for a particular Reopener Year depends on future events and is therefore currently not determinable. If Algoma were to prevail on the retroactivity issue, our 2007 revenues from sales to Algoma may be adversely affected. On April 15, 2007, Essar Global Limited, through its wholly owned subsidiary Essar Steel Holdings Limited, signed a definitive arrangement agreement to acquire Algoma for C$1.85 billion. We do not expect the merger to affect our term supply agreement with Algoma. We sold 3.5 million, 3.8 million and 3.3 million tons to Algoma in 2006, 2005 and 2004, respectively.
Severstal
On October 23, 2003, Rouge, a significant pellet sales customer of ours, filed for chapter 11 bankruptcy protection. On January 30, 2004, Rouge sold substantially all of its assets to Severstal. Severstal, as part of the acquisition of assets of Rouge, assumed our term supply agreement with Rouge with minimal modifications. On January 1, 2006, we entered into an amended and restated agreement whereby we will be the sole supplier of iron ore pellets through 2012, with certain minimum purchase requirements for certain years. We sold 3.7 million, 3.6 million and 3.3 million tons to Severstal in 2006, 2005 and 2004, respectively.
WCI
On September 16, 2003, WCI petitioned for protection under chapter 11 of the U.S. Bankruptcy Code. At the time of the filing, we had a trade receivable exposure of $4.9 million, which was fully reserved in the third quarter of 2003. On October 14, 2004, we and WCI reached agreement (the “2004 Pellet Agreement”) for us to
10
supply 1.4 million tons of iron ore pellets in 2005 and, in 2006 and thereafter, to supply 100 percent of WCI’s annual requirements up to a maximum of two million tons of iron ore pellets. The 2004 Pellet Agreement is for a ten-year term, which commenced on January 1, 2005 and provided for full recovery of our $4.9 million receivable plus $.9 million of subsequent pricing adjustments. The 2004 Pellet Agreement was approved by the bankruptcy court on November 16, 2004. The receivable and subsequent pricing adjustments were to be paid in three equal annual installments of approximately $1.9 million. The first payment, due on November 16, 2005, was received and classified as Customer bankruptcy recoveries (exposures) on the Statements of Consolidated Operations.
On May 1, 2006, an entity controlled by the secured noteholders of WCI acquired the steelmaking assets and business of WCI (“New WCI”). New WCI assumed the 2004 Pellet Agreement, including the obligation to cure the remaining two unpaid installments on the bankruptcy recovery. During the third quarter of 2006, WCI paid the remaining $3.9 million balance in full, resulting in complete recovery of our reserve. We sold 1.6 million, 1.4 million and 1.7 million tons to WCI in 2006, 2005 and 2004, respectively.
Stelco
On January 29, 2004, Stelco, a Canadian corporation, applied and obtained Bankruptcy Court protection from creditors in Ontario Superior Court under the CCAA. Stelco is a 44.6 percent participant in Wabush, and U.S. subsidiaries of Stelco (which had not filed for bankruptcy protection) own 14.7 percent of Hibbing and 15 percent of Tilden. At the time of the filing, we had no trade receivable exposure to Stelco.
Throughout the fall of 2005, Stelco worked to come to agreement with key stakeholders on a reorganization plan. On December 9, 2005, the Third Amended and Restated Plan of Compromise and Arrangement (the “Plan”) was agreed. On December 10, 2005, the creditors affected by the Plan approved the Plan by substantially more than the statutorily-mandated minimum approval levels. On January 20, 2006, on motion by Stelco, the Superior Court of Ontario sanctioned the Plan as being fair and reasonable in all the circumstances. On February 14, 2006, the Superior Court of Ontario issued an order approving the proposed reorganization.
On March 31, 2006, Stelco emerged from protection from its creditors under the CCAA, which had been mandated by the Ontario Superior Court of Justice on January 29, 2004. Pursuant to Stelco’s plan of reorganization, C$350 million of new financing was invested in Stelco. The investor required, as a condition of such financing, that Stelco be reorganized into limited — partnership operating subsidiaries, one of which was a “mining” subsidiary, HLE. By way of a consent made as of March 31, 2006, our subsidiaries including Cliffs Mining Company and Wabush Iron Co. Limited, among others, consented to the transfer of Stelco’s interest in the Wabush Mines Joint Venture, and its subsidiaries’ shareholdings in the Hibbing and Tilden operations, to HLE. The Consent Order was conditional upon the completion of a number of items on or before June 30, 2006:
| a. | the execution and delivery of a Reorganization Agreement and related documentation with respect to the joint venture operations; and |
| b. | Stelco’s execution and delivery of HLE’s obligations with respect to the joint ventures, and guarantees of HLE’s obligations by Stelco under its guarantee from each of the other limited partnerships into which Stelco’s other business interests were organized pursuant to the restructuring. |
Stelco has been unable to complete the necessary documentation. If, however, the conditions are not satisfied, the Consent dictates that the consent provided therein is to be deemed not to have been given.
In December 2006, we executed a binding pellet supply term sheet with respect to a seven-year supply agreement with Stelco to provide Stelco’s Lake Erie Steel and Hamilton Steel facilities excess pellet requirements above the amount supplied from Stelco’s ownership interest at Hibbing, Tilden and Wabush. A definitive pellet sales and purchase agreement is being finalized. Pellet sales to Stelco totaled .9 million, 1.4 million and 1.2 million tons in 2006, 2005 and 2004, respectively.
AK Steel
We entered into a seven-year supply agreement with AK Steel in November 2006. The agreement, which begins January 1, 2007, runs through 2013. Under the terms of the agreement, we will supply between .9 million
11
and 1.4 million tons of pellets annually. The agreement supplants prior spot-sales agreements with AK Steel, which totaled .4 million tons of pellet sales in 2006.
Republic Engineered Products, Inc.
We entered into a five-year supply agreement with Republic Engineered Products, Inc. (“Republic”) in November 2006. The agreement, which began October 1, 2006, runs through December 31, 2011. Under the contract terms, we will supply a portion of Republic’s total annual pellet requirements. The tonnage is estimated to be between .4 million tons and .8 million tons annually. The agreement supplanted previous spot-sales arrangements. For 2006, sales to Republic totaled .4 million tons, including both spot sales and sales made under the new agreement.
Australia Segment
The Portman operations include the Koolyanobbing operations and a 50 percent equity interest in a joint venture at Cockatoo Island. These two operations supply a total of five direct shipping export products to Asia via the global seaborne trade market. Koolyanobbing produces a standard lump and fines product as well as low grade lump and fines products. Cockatoo Island produces and exports a single premium fines product. Portman lump products are directly charged to the blast furnace, while the fines products are used as sinter feed. The variation in Portman’s five export product grades reflects the inherent chemical and physical characteristics of the ore bodies mined as well as the supply requirements of the customers.
The Koolyanobbing operation is a collective term for the operating deposits at Koolyanobbing, Mt Jackson and Windarling. The Koolyanobbing Project is located 425 kilometers east of Perth and approximately 50 kilometers northeast of the town of Southern Cross. There are approximately 100 kilometers separating the three mining areas. Banded iron formation hosts the mineralization which is predominately hematite and goethite. Each deposit is characterized with different chemical and physical attributes and in order to achieve customer product quality; ore in varying quantities from each deposit must be blended together.
Blending is undertaken at Koolyanobbing, where the crushing and screening plant is located. Standard and low grade products are produced in separate campaigns. Once the blended ore has been crushed and screened into a direct shipping product, it is transported by rail approximately 575 kilometers south to the Port of Esperance for shipment to Asian customers.
Cockatoo Island is located off the Kimberley coast of Western Australia, approximately 1,900 kilometers north of Perth and is only accessible by sea and air. Cockatoo Island produces a single high iron product known as Cockatoo Island Premium Fines. The deposit is almost pure hematite and contains very few contaminants enabling the shipping grade to be above 68 percent iron. Ore is mined below the sea level on the southern edge of the island. This is facilitated by a sea wall which enables mining to a depth of 40 meters below sea level. Ore is crushed and screened to the final product sizing. Vessels berth at the island and the fines product is loaded directly to the ship. Cockatoo Island Premium Fines are highly sought in the global marketplace due to its extremely high iron grade and low gangue levels. The Cockatoo Island operation is scheduled to close in late 2007.
Australia Iron Ore Customers
A limited spot market exists for seaborne iron ore as most production is sold under long-term contracts with annual benchmark prices driven from negotiations between the major suppliers and Chinese, Japanese and other Asian steel mills. The three major iron ore producers, CVRD, Rio Tinto and BHP, dominate the seaborne iron ore trade and together account for approximately three-fourths of the global supply to the seaborne market.
Portman has long-term supply agreements with steel producers in China and Japan that account for approximately 80 percent and 20 percent, respectively, of sales. Sales volume under the agreements is partially dependent on customer requirements. Each agreement is priced based on benchmark pricing established for Australian producers.
During 2006 and 2005, we sold 7.4 million and 4.9 million tonnes of iron ore, respectively, from our Western Australia mines. (Sales for 2005 represent amounts since the March 31, 2005 acquisition). Sales in 2006
12
were to 15 Chinese and three Japanese customers. No customer comprised more than 15 percent of Portman sales or 10 percent of our consolidated sales in 2006 or 2005. Portman’s five largest customers accounted for approximately 46 percent of Portman’s sales in 2006 (50 percent in 2005).
The iron ore and steel industries
Almost all iron ore is used in steelmaking and therefore is dependent on the steel industry. The steel industry has historically been cyclical and has recently been characterized by a period of rising production. Global crude steel production broke the 100 million tonne per month level for the first time in March 2006. Production in 2006 for the 62 countries reporting to the International Iron and Steel Institute increased approximately nine percent over 2005. The growing level of international production is largely due to the rapid industrial growth in China.
China produced approximately 418 million tonnes of crude steel in 2006, up 18 percent over 2005, accounting for approximately 34 percent of global production. Production in China has increased from approximately 12 million tonnes per month in 2001 to average nearly 35 million tonnes per month in 2006. During the first half of 2006, steel production resulted in China becoming the world’s largest steel exporting country. China’s exports of steel have grown rapidly, approximating 12 percent of Chinese production in 2006.
The rapid growth in steel production in China has only been partially met by a corresponding increase in domestic Chinese iron ore production. Chinese iron ore deposits, although substantial, are of a lower grade (less than half of the equivalent iron ore content) than the current iron ore supplied from Brazil and Australia. China has moved from a position where demand was largely satisfied by domestic supply in the early 1990’s to becoming a net importer of iron ore. Although domestic iron ore supply is expanding, it approximates only 45 percent of China’s total iron ore requirements. Chinese iron ore imports, accounting for 55 percent of its requirements, reached 326 million tonnes in 2006, increasing approximately 19 percent from 2005.
The world price of iron ore is influenced by international demand. The rapid growth in Chinese demand, particularly in more recent years, has created a market imbalance and has led to demand outstripping supply. This market imbalance has recently led to high spot prices for iron ore and increases of 19 percent and 71.5 percent in 2006 and 2005, respectively, in benchmark prices for Brazilian and Australian suppliers of iron ore. In December 2006, CVRD agreed with Baosteel, negotiating on behalf of the Chinese steelmaking industry, to a 9.5 percent increase in the annual iron ore fines price for 2007. CVRD also established a 5.28 percent increase in the price of blast furnace pellets for 2007 with their European customers. The increased demand for iron ore has resulted in the major iron ore suppliers expending efforts to increase their capacity.
Our strategic objectives are to:
Seek Additional Investment Opportunities
Much of the current increase in global demand for steel is due to industrialization in countries such as China. China is seeking foreign supplies of the raw materials it needs to produce steel to build infrastructure, factories, hotels and other buildings and to manufacture motor vehicles and appliances. China’s increased demand for materials, including iron ore and coal, has been a factor in increasing raw material prices around the globe. Currently, China is the world’s largest steel producer, with approximately one-third of global steel production, and China’s steel production is expected to continue to grow. Chinese iron ore imports rose approximately 19 percent in 2006 and are expected to further increase in 2007. China is the largest consumer of iron ore, steel and copper. We are attempting to capitalize on China’s industrial growth by acquiring well-located iron ore and/or metallurgical coal properties and obtaining agreements to supply iron ore and coal to international steel producers.
Expand Our Leadership Position as a Supplier to the North American Steel Industry
Primarily in 2002, we substantially restructured the ownership interests in our mines largely by converting mine partners into customers with term supply agreements. Under our operating strategy, royalty and management fee income has largely been replaced by profit margin on pellet sales. It is our goal to continue to expand our leadership position in the industry by focusing on high product quality, technical excellence, superior relationships with our customers and partners and improved operational efficiency through year-over-year cost
13
savings. By developing creative solutions for our customers during the industry restructuring, we have been able to generate term supply agreements with many of these companies, which have benefited our market position. Our creative solutions included acquisition of our partners’ interests in the mines largely for the assumption of certain mine liabilities, thereby allowing partners to focus on their core steelmaking business and become our customers by entering into long term supply agreements with us.
Achieve Demonstrated Savings Through Productivity Improvements, Enterprise-Wide Cost Reductions and Strategic Sourcing
Rising costs are a threat to profits and limit our strategic flexibility. Our North American mining costs have increased 31 percent between 2004 and 2006. In particular, we have seen large increases in energy, supplies, capital and employment costs. This recent trend has affected the global mining industry as well. To mitigate the effect of these cost increases, we have implemented an aggressive business improvement and mine optimization program focusing on cost reduction, asset productivity, energy usage, alternative fuels and strategic sourcing. In building the foundation for success going forward, we are utilizing improvement processes designed around Six Sigma and Rapid Results, investments in assets and people, and through the building of bench strength and talent management.
Strive to Continuously Improve Iron Ore Pellet Quality and Develop Alternative Metallic Products
With the overall goal of achieving cost savings and quality improvements through pioneering process development at the mines that we manage, we operate a fully-equipped research and development facility.
As part of our efforts to develop alternative metallic products, we are evaluating opportunities to develop, with Kobe Steel, a commercial-scale reduced iron plant, which will convert taconite into nearly pure iron in nugget form utilizing Kobe Steel’s ITmk3 technology. This innovative technology has the potential to open new markets by offering an economically competitive supply of iron material for electric arc furnaces, which use scrap steel, pig iron and/or HBI/DRI, not iron ore pellets, in their electric arc furnaces.
Information regarding Operations, Competition, Environment, Energy, Research and Development and Employees is presented under the captions “Operations”, “Competition”, “Environment”, “Energy”, “Research and Development”, and “Employees”, respectively, all of which are included in Item 2 and are incorporated by reference and made a part hereof.
Available Information
Our headquarters are located at 1100 Superior Avenue, Cleveland, Ohio 44114-2544, and our telephone number is (216) 694-5700. We are subject to the reporting requirements of the Exchange Act and its rules and regulations. The Exchange Act requires us to file reports, proxy statements and other information with the SEC. Copies of these reports and other information can be read and copied at:
| SEC Public Reference Room 100 F Street N.E. Washington, D.C. 20549 |
Information on the operation of the Public Reference Room may be obtained by calling the SEC at 1-800-SEC-0330.
The SEC maintains a website that contains reports, proxy statements and other information regarding issuers that file electronically with the SEC. These materials may be obtained electronically by accessing the SEC’s home page at http://www.sec.gov.
We make available, free of charge on our website, our Annual Report on Form 10-K, Quarterly Reports on Form 10-Q, Current Reports on Form 8-K and amendments to these reports filed or furnished pursuant to Section 13(a) or 15(d) of the Exchange Act, as soon as reasonably practicable after we electronically file these documents with, or furnish them to, the SEC. These documents are posted on our website at www.cleveland-cliffs.com — under “Investor Relations”.
14
We also make available, free of charge on our website, the charters of the Audit Committee, Board Affairs Committee, Compensation and Organization Committee, Finance Committee and Strategic Advisory Committee, as well as the Corporate Governance Guidelines and the Code of Business Conduct & Ethics adopted by our Board of Directors. These documents are posted on our website at www.cleveland-cliffs.com — under “Investor Relations”, select the “Corporate Governance” link.
References to our website do not constitute incorporation by reference of the information contained on our website and such information is not part of this Form 10-K.
Copies of the above referenced information will also be made available, free of charge, by calling (216) 694-5700 or upon written request to:
| Cleveland-Cliffs Inc Investor Relations 1100 Superior Avenue Cleveland, OH 44114-2544 |
If the rate of steel consumption in China slows, the demand for iron ore and coal could decrease.
The world price of iron ore and coal are strongly influenced by international demand. The current growing level of international demand for raw materials for steel production is largely due to the rapid industrial growth in China. If the economic growth rate in China slows, which may be difficult to forecast, less steel may be used in construction and manufacturing, which could decrease demand for iron ore and coal. This could adversely impact the world iron ore and coal markets, impact the North American and Asian markets, and adversely impact our North American and Australian operations. A slowing of the economic growth rate in China could also result in greater exports of steel out of China, which if imported into North America could decrease demand for domestically produced steel, thereby decreasing the demand for iron ore supplied in North America. China became a modest net exporter of steel products in 2005 and during 2006 became the world’s largest exporter of steel.
Excess global capacity and the availability of competitive substitute materials may result in intense competition in the steel industry, which may reduce steel prices and decrease steel production and our customers’ demand for iron ore products. Increased imports of steel into the United States could also adversely impact North American steel sales.
Global overcapacity in steel manufacturing may have a negative impact on North American steel sales and reduce the production of steel and consequently the demand for North American iron ore. A weakening of certain foreign economies, particularly in Eastern Europe, Asia and Latin America, may negatively impact steel prices in those foreign economies and result in increased levels of steel imports from those countries into the United States at depressed prices. China’s domestic crude steel production is expected to climb 23 percent in 2007 from an estimated 418 million tonnes in 2006. Based on the American Iron and Steel Institute’s Apparent Steel Supply (excluding semi-finished steel products), imports of steel into the United States constituted 27.2 percent, 21.3 percent and 22.3 percent of the domestic steel market supply for 2006, 2005 and 2004, respectively. Significant imports of steel into the United States could substantially reduce sales, margins and profitability of North American steel producers, and consequently, reduce demand for North American iron ore. Further, production of steel by North American integrated steel manufacturers may be replaced, to some extent, by production of substitute materials by other manufacturers. In the case of some product applications, North American steel manufacturers compete with manufacturers of other materials, including plastic, aluminum, graphite composites, ceramics, glass, wood and concrete. Most of our term supply agreements for the sale of iron ore products are requirements-based or provide for flexibility of volume above a minimum level. Reduced demand for and consumption of iron ore products by integrated steel producers have had and may continue to have a significant negative impact on our sales, margins and profitability.
15
The North American and global steel industries continue to undergo a restructuring process that has resulted in industry consolidation that could result in a reduction of integrated steelmaking capacity over time, and thereby reduce iron ore consumption.
The North American steel industry has undergone consolidation, and that consolidation is likely to continue as evidenced by the recently announced acquisition of Algoma Steel by Essar Global. Consolidation is also occurring globally, as evidenced by Mittal Steel’s merger with Arcelor and Tata Steel Limited’s acquisition of Corus Group plc. Consolidation in the North American and global steel industries will result in fewer customers for iron ore and coal. The restructuring process may reduce integrated steelmaking capacity, which would reduce demand for our iron ore and coal products and may adversely affect our sales.
Our sales and earnings are subject to significant fluctuations as a result of the cyclical nature of the North American steel industry.
In 2006, 2005 and 2004, 20.2 million, 21.9 million and 22.2 million tons, respectively, of our North American iron ore pellet sales were sold to North American steel manufacturers, while only ..2 million, .4 million and .4 million tons of our pellets were sold outside of North America in each year. The North American steel industry has historically been cyclical in nature, influenced by a combination of factors, including periods of economic growth or recession, strength or weakness of the U.S. dollar, worldwide demand and production capacity, the strength of the U.S. automotive industry, levels of steel imports and applicable tariffs. The demand for steel products is generally affected by macroeconomic fluctuations in North America and the global economies in which steel companies sell their products. For example, future economic downturns, stagnant economies or currency fluctuations could decrease the demand for steel products globally or increase the amount of imports of steel or iron ore into the United States.
In addition, a disruption or downturn in the oil and gas, gas transmission, construction, commercial equipment, rail transportation, appliance, agricultural, automotive or durable goods industries, all of which are significant markets for steel products and are somewhat cyclical, could negatively impact sales of steel by North American producers. These trends could decrease the demand for North American iron ore products and significantly adversely affect our North American sales, margins and profitability.
If steelmakers use methods other than blast furnace production to produce steel, or if their blast furnaces shut down or otherwise reduce production, the demand for our iron ore products may decrease.
Demand for our iron ore products is determined by the operating rates for the blast furnaces of steel companies. However, not all finished steel is produced by blast furnaces; finished steel also may be produced by other methods that do not require iron ore products. For example, steel “mini-mills,” which are steel recyclers, generally produce steel primarily by using scrap steel and other iron products, not iron ore pellets, in their electric furnaces. Production of steel by steel mini-mills was approximately 57 percent of North American total finished steel production in 2006. Steel producers also can produce steel using imported iron ore or semi-finished steel products, which eliminates the need for domestic iron ore. Environmental restrictions on the use of blast furnaces also may reduce our customers’ use of their blast furnaces. Maintenance of blast furnaces can require substantial capital expenditures. Our customers may choose not to maintain their blast furnaces, and some of our customers may not have the resources necessary to adequately maintain their blast furnaces. If our customers use methods to produce steel that do not use iron ore products, demand for our iron ore products will decrease, which could adversely affect our sales, margins and profitability.
Natural disasters, equipment failures and other unexpected events may lead our steel industry customers to curtail production or shut down their operations.
Operating levels at our steel industry customers are subject to conditions beyond their control, including raw material shortages, weather conditions, natural disasters, interruptions in electrical power or other energy services, equipment failures, and other unexpected events. Any of those events could also affect other suppliers to the steel industry. In either case, those events could cause our steel industry customers to curtail production or shut down a portion or all of their operations, which could reduce their demand for our iron ore products. For
16
example, in 2005, Mittal Steel USA permanently shut down its Weirton blast furnaces. Mittal Steel USA also shut down the Indiana Harbor facility for 30 days in 2006 due to a molten iron spill and resultant fire. In September 2005, Steel Dynamics suspended orders for some steel products that require the use of hydrogen gas due to the effects of hurricane Katrina on its hydrogen gas supplier. Decreased demand for our iron ore products could adversely affect our sales, margins and profitability.
We operate in very competitive industries.
The iron mining and coal businesses are highly competitive, with producers in all regions where we operate. Some of our competitors may have greater financial resources than we have and may be better able to withstand changes in conditions within the steel industry than we are. In the future, we may face increasing competition. As a result, we may face pressures on sales prices and volumes of our products from competitors and large customers.
Capacity expansions could lead to lower global iron ore prices.
The increased demand for iron ore, particularly from China, has resulted in the major iron ore suppliers increasing their capacity. In 2007, CVRD’s board of directors approved a capital expenditure budget of $6.3 billion, the largest capital budget for organic growth in its history and $1.8 billion higher than the previous year’s total. In March 2007, BHP approved a second expansion project in Western Australia; and along with a current expansion project in Brazil, are increasing their iron ore capacity by a combined 54 million tonnes. An increase in our competitors’ capacity could result in excess supply of iron ore, resulting in downward pressure on iron ore prices. A decrease in pricing would adversely impact our sales, margins and profitability.
Our sales and competitive position depend on the ability to transport our products to our customers at competitive rates and in a timely manner.
Disruption of the lake freighter and rail transportation services because of weather-related problems, including ice and winter weather conditions on the Great Lakes, strikes, lock-outs or other events, could impair our ability to supply iron ore pellets to our customers at competitive rates or in a timely manner and, thus, could adversely affect our sales and profitability. Further, reduced levels of government funding may result in a lesser level of dredging, particularly at Great Lakes ports. Less dredging results in lower water levels, which restricts the tonnage freighters can haul over the Great Lakes, resulting in higher freight rates.
Portman is in direct competition with the major world seaborne exporters of iron ore and its customers face higher transportation costs than most other Australian producers to ship its products to the Asian markets because of the location of its major shipping port on the south coast of Australia. Further, increases in transportation costs, or changes in such costs relative to transportation costs incurred by our competitors, could make our products less competitive, restrict our access to certain markets and have an adverse effect on our sales, margins and profitability.
A substantial majority of our sales are made under term supply agreements, which are important to the stability and profitability of our operations.
In 2006, more than 98 percent of our North American sales volume was sold under term supply agreements. All of our Australian sales are made under existing contracts that have approximately three years remaining. If a substantial portion of our term supply agreements were modified or terminated, we could be materially adversely affected to the extent that we are unable to renew the agreements or find alternate buyers for our iron ore at the same level of profitability. We cannot be certain that we will be able to renew or replace existing term supply agreements at the same prices or with similar profit margins when they expire. A loss of sales to our existing customers could have a substantial negative impact on our sales, margins and profitability.
In North America, we depend on a limited number of customers.
Five customers together accounted for more than 90 percent of our North American sales revenues measured as a percent of product revenues for each of the past three years. If one or more of these customers
17
were to significantly reduce their purchases of iron ore products from us, or if we were unable to sell iron ore products to them on terms as favorable to us as the terms under our current term supply agreements, our North American sales, margins and profitability could suffer materially due to the high level of fixed costs and the high costs to idle or close mines. The majority of the iron ore we manage and produce is for our own account, and therefore we rely on sales to our joint venture partners and other third-party customers for most of our revenues.
Changes in demand for our products by our customers could cause our sales, margins and profitability to fluctuate.
Our North American term supply agreements include both agreements which are requirements contracts and agreements with minimum purchase provisions, some of which provide for flexibility of volume above minimum levels. Portman sales contracts are for fixed annual tonnages with customer options to increase or decrease annual purchases. A decrease in one or more of our customers’ requirements could cause our sales to decline, as we may not be able to find other customers to purchase our iron ore products. In addition, if our customers’ requirements decline, since many of our production costs are fixed, our production costs per ton may rise, which may affect our margins and profitability. Unmitigated loss of sales would have a greater percentage impact on margins and profitability than on revenues, due to the high level of fixed costs in the iron ore mining business and the high cost to idle or close mines.
The provisions of our term supply agreements could cause our sales, margins and profitability to fluctuate.
Our term supply agreements typically contain force majeure provisions allowing temporary suspension of performance by the customer during specified events beyond the customer’s control, including raw material shortages, power failures, equipment failures, adverse weather conditions and other events. For example, one of our large customers notified us in January 2004 that it was reducing its requirements for iron ore pellets in the first quarter of 2004 by 180,000 long tons pursuant to the force majeure provisions of its term supply agreement with us. That customer invoked the force majeure provision due to a failure of its coke supplier to ship the quantity of coke that the customer had ordered due to shortages caused by a fire at a mine that supplied coal to the supplier.
Price escalators in our term supply agreements also expose us to short-term price volatility, which can adversely affect our margins and profitability. Our term supply agreements also contain provisions requiring us to deliver iron ore pellets meeting quality thresholds for certain characteristics, such as chemical makeup. Failure to meet these specifications could result in economic penalties. All of these contractual provisions could adversely affect our sales, margins and profitability.
We may have contractual disputes with our customers or significant suppliers of energy, materials, or services.
Most of our North American and Australian sales are under multi-year term supply agreements. Sales volume under these agreements is largely dependent on customer requirements, and in many cases, we are the sole supplier of iron ore pellets to the customer. Each agreement has a base price that is adjusted annually using one or more adjustment factors. Factors that could result in price adjustment include measures of general industrial inflation, steel prices and international pellet prices. One of our supply agreements has a provision that limits the amount of price increase or decrease in any given year. Australian benchmark prices are driven from negotiations between the three major iron producers, CVRD, Rio Tinto and BHP, and the Chinese and Japanese steel mills. Contractual disputes with any of our significant customers could result in lower sales volume or lower sales prices.
Additionally, we have significant contracts with suppliers of energy, materials and services in North America and Australia. Contractual disputes with significant suppliers could result in production curtailments or significant cost increases which could adversely impact our profitability.
Mine closures entail substantial costs, and if we close one or more of our mines sooner than anticipated, our results of operations and financial condition may be significantly and adversely affected.
If we close any of our mines, our revenues would be reduced unless we were able to increase production at our other mines, which may not be possible. The closure of an open-pit mine involves significant fixed closure
18
costs, including accelerated employment legacy costs, severance-related obligations, reclamation and other environmental costs, and the costs of terminating long-term obligations, including energy contracts and equipment leases. We base our assumptions regarding the life of our mines on detailed studies we perform from time to time, but those studies and assumptions do not always prove to be accurate. We recognize the costs of reclaiming open pits, stockpiles, tailings ponds, roads and other mining support areas based on the estimated mining life of our property. If we were to significantly reduce the estimated life of any of our mines, the mine-closure costs would be applied to a shorter period of production, which would increase production costs per ton produced and could significantly and adversely affect our results of operations and financial condition. For example, we significantly decreased our ore reserve estimates for the Empire mine from 116 million tons at December 31, 2001 to 63 million tons at December 31, 2002 and further to 29 million tons at December 31, 2003. As of December 31, 2006, Empire’s estimated ore reserves decreased to approximately 13 million tons, primarily as a result of production in 2004, 2005 and 2006.
A North American mine permanent closure could significantly increase and/or accelerate employment legacy costs, including our expense and funding costs for pension and other postretirement benefit obligations. A number of employees would be eligible for immediate retirement under special eligibility rules that apply upon a mine closure. At the Tilden and Empire mines, there are Range Wide seniority rights for permanent closures that would significantly mitigate if not entirely eliminate the number of employees that would become eligible for special early retirements if only one of the mines closed. Second, all employees eligible for immediate retirement under the pension plans at the time of the permanent mine closure also would be eligible for postretirement health and life insurance benefits, thereby accelerating our obligation to provide these benefits. Third, a closure of Hibbing, Tilden or Empire would precipitate a pension closure liability significantly greater than an ongoing operation liability. Fourth, closure of United Taconite could create a withdrawal liability since it is a member of a multiemployer pension plan, but is not the plan sponsor. Finally, a permanent mine closure could trigger severance-related obligations, which can equal up to eight weeks of pay per employee, depending on length of service. No employee entitled to an immediate pension upon closure of a mine is entitled to severance. As a result, the closure of one or more of our mines could adversely affect our financial condition and results of operations.
The Cockatoo Island operation in Australia is scheduled to close in late 2007 and plans are in process to obtain all required governmental approvals. Since all of the employees are contractors, the cost of mine closure is significantly lower in Australia than in North America. Performance bonds are in place covering the estimated closure costs.
Applicable statutes and regulations require that mining properties be reclaimed following a mine closure in accordance with specified standards and approved reclamation plans. The plans address matters such as removal of facilities and equipment, regrading, prevention of erosion and other forms of water pollution, revegetation and post-mining land use. We may be required to post a surety bond or other form of financial assurance equal to the cost of reclamation as set forth in the approved reclamation plan. The establishment of the final mine closure reclamation liability is based upon permit requirements and requires various estimates and assumptions, principally associated with reclamation costs and production levels. Although our management believes, based on currently available information, we are making adequate provisions for all expected reclamation and other costs associated with mine closures for which we will be responsible, our business, results of operations and financial condition would be adversely affected if such accruals were later determined to be insufficient.
We rely on estimates of our recoverable reserves.
We regularly evaluate our iron ore reserves based on revenues and costs and update them as required in accordance with SEC Industry Guide 7. Portman has published reserves which follow JORC in Australia, which is similar to United States requirements. Changes to the reserve value to make them comply with SEC requirements have been made. There are numerous uncertainties inherent in estimating quantities of reserves of our mines, many of which have been in operation for several decades, including many factors beyond our control. Estimates of reserves and future net cash flows necessarily depend upon a number of variable factors and assumptions, such as production capacity, effects of regulations by governmental agencies and future prices for iron ore, future industry conditions and operating costs, severance and excise taxes, development costs and costs
19
of extraction and reclamation, all of which may in fact vary considerably from actual results. For these reasons, estimates of the economically recoverable quantities of mineralized deposits attributable to any particular group of properties, classifications of such reserves based on risk of recovery and estimates of future net cash flows prepared by different engineers or by the same engineers at different times may vary substantially as the criteria change. Estimated ore reserves could be affected by future industry conditions, geological conditions and ongoing mine planning. Actual production, revenues and expenditures with respect to our reserves will likely vary from estimates, and if such variances are material, our sales and profitability could be adversely affected.
The price adjustment provisions of our North American term supply agreements may prevent us from increasing our prices to match international ore contract prices or to pass increased costs of production on to our customers.
Our North American term supply agreements contain a number of price adjustment provisions, or price escalators, including adjustments based on general industrial inflation rates, the price of steel and the international price of iron ore pellets, among other factors, that allow us to adjust the prices under those agreements generally on an annual basis. Our price adjustment provisions are weighted and some are subject to annual collars, which limit our ability to raise prices to match international levels and fully capitalize on strong demand for iron ore. Most of our North American term supply agreements do not allow us to increase our prices and to directly pass through higher production costs to our customers. An inability to increase prices or pass along increased costs could adversely affect our margins and profitability.
Our ability to collect payments from our customers depends on their creditworthiness.
Our ability to receive payment for iron ore products sold and delivered to our customers depends on the creditworthiness of our customers. In North America, we ship iron ore products to some of our customers’ yards in advance of payment for those products. Our rationale for shipping iron ore products to customers in advance of payment for, and transfer title for the product is to more closely relate timing of payment to consumption, thereby providing additional liquidity to our customers, and to reduce our financial risk to customer insolvency as title and risk of loss with respect to those products does not pass to the customer until payment for the pellets is received. Accordingly, there is typically a period of time in which pellets, as to which we have reserved title, are within our customers’ control. Several of our customers have previously petitioned for protection under bankruptcy or other similar laws. Failure to receive payment from our customers for products that we have delivered could adversely affect our results of operations.
Our change from a manager of iron ore mines on behalf of steel company owners to primarily a merchant of iron ore to steel company customers has increased our obligations with respect to those mines and has made our revenues, earnings and profit margins more dependent on sales of iron ore products and more susceptible to product demand and pricing fluctuations.
Prior to 2002, we had principally acted as a manager of iron ore mines on behalf of steel company owners, and in that capacity had been generally entitled to management fees, royalties on reserves that we have leased or subleased to the Empire and Tilden mines, and income from our sales of iron ore products to our customers, including the other mine owners. Our current business model increased ownership in our co-owned mines. In accordance with our revised business model, in 2002 we increased our ownership in (1) the Empire mine from 47 percent to 79 percent, (2) the Tilden mine from 40 percent to 85 percent, (3) the Hibbing mine from 15 percent to 23 percent, and (4) the Wabush mine from 23 percent to 27 percent. While we have gained greater control of the mines we operate, we have also increased our share of the operating costs, employment legacy costs and financial obligations associated with those mines. Our increased ownership of those mines has caused the management fees and royalties due to us from our partners in the mines to decline from $29.8 million in 2001 to $11.7 million in 2006. The decline in royalties and management fees has made our revenues, earnings and profit margins more volatile and more dependent on sales of our iron ore products to third-party customers.
We rely on our joint venture partners in our mines to meet their payment obligations.
We co-own five of our six North American mines with various joint venture partners that are integrated steel producers or their subsidiaries, including Dofasco, Mittal Steel USA, Laiwu and Stelco. While we are the
20
manager of each of the mines we co-own, we rely on our joint venture partners to make their required capital contributions and to pay for their share of the iron ore pellets that we produce. Most of our venture partners are also our customers and are subject to the creditworthiness risks described above. If one or more of our venture partners fail to perform their obligations, the remaining venturers, including ourselves, may be required to assume additional material obligations, including significant pension and postretirement health and life insurance benefit obligations. The premature closure of a mine due to the failure of a joint venture partner to perform its obligations could result in significant fixed mine-closure costs, including severance, employment legacy costs and other employment costs, reclamation and other environmental costs, and the costs of terminating long-term obligations, including energy contracts and equipment leases.
Unanticipated geological conditions and natural disasters could increase the cost of operating our business.
A portion of our production costs are fixed regardless of current operating levels. Our operating levels are subject to conditions beyond our control that can delay deliveries or increase the cost of mining at particular mines for varying lengths of time. These conditions include weather conditions (for example, extreme winter weather, floods and availability of process water due to drought) and natural disasters, pit wall failures, unanticipated geological conditions, including variations in the amount of rock and soil overlying the deposits of iron ore, variations in rock and other natural materials and variations in geologic conditions and ore processing changes. Portman’s Cockatoo Island operation is located in an area affected by tropical storms and operates a pit below sea level that is protected by a constructed seawall. Storms in this area could affect both our operation and the operations of our major Australia competitors. These conditions could impair our ability to fulfill our plan to operate our mines at full capacity, which could materially adversely affect our ability to meet the expected demand for our iron ore products.
Many of our mines are dependent on a single-source energy supplier.
Many of our mines are dependent on one source for electric power and for natural gas. For example, Minnesota Power is the sole supplier of electric power to our Hibbing and United Taconite mines; WEPCO is the sole supplier of electric power to our Tilden and Empire mines; and our Northshore mine is largely dependent on its wholly owned power facility for its electrical supply. A significant interruption in service from our energy suppliers due to terrorism, weather conditions, natural disasters, or any other cause can result in substantial losses that may not be fully recoverable, either from our business interruption insurance or responsible third parties. For example, in May 2003, we lost production when our Empire and Tilden mines were idled for approximately five weeks due to loss of power stemming from the failure of a dam in the Upper Peninsula of Michigan. One natural gas pipeline serves all of our Minnesota and Michigan mines and a pipeline failure may idle those operations. Any substantial unmitigated interruption of our business due to these conditions could materially adversely affect our sales, margins and profitability.
Our mines and processing facilities have been in operation for several decades. Equipment failures and other unexpected events at our facilities may lead to production curtailments or shutdowns.
Interruptions in production capabilities will inevitably increase our production costs and reduce our profitability. We do not have meaningful excess capacity for current production needs, and we are not able to quickly increase production at one mine to offset an interruption in production at another mine. In addition to equipment failures, our facilities are also subject to the risk of loss due to unanticipated events such as fires, explosions or adverse weather conditions. Two electrical explosions at our United Taconite facility on October 12, 2006 resulted in a temporary production curtailment as a result of a loss of electrical power. Full production did not resume until January 2007. The manufacturing processes that take place in our mining operations, as well as in our crushing, concentrating and pelletizing facilities, depend on critical pieces of equipment, such as drilling and blasting equipment, crushers, grinding mills, pebble mills, thickeners, separators, filters, mixers, furnaces, kilns and rolling equipment, as well as electrical equipment, such as transformers. This equipment may, on occasion, be out of service because of unanticipated failures. In addition, many of our mines and processing facilities have been in operation for several decades, and the equipment is aged. In the future, we may experience additional material plant shutdowns or periods of reduced production because of equipment
21
failures. Material plant shutdowns or reductions in operations could materially adversely affect our sales, margins and profitability. Further, remediation of any interruption in production capability may require us to make large capital expenditures that could have a negative effect on our profitability and cash flows. Our business interruption insurance would not cover all of the lost revenues associated with equipment failures. Longer-term business disruptions could result in a loss of customers, which could adversely affect our future sales levels, and therefore our profitability.
We are subject to extensive governmental regulation, which imposes, and will continue to impose, significant costs and liabilities on us, and future regulation could increase those costs and liabilities or limit our ability to produce iron ore products.
We are subject to various federal, provincial, state and local laws and regulations on matters such as employee health and safety, air quality, water pollution, plant and wildlife protection, reclamation and restoration of mining properties, the discharge of materials into the environment, and the effects that mining has on groundwater quality and availability. Numerous governmental permits and approvals are required for our operations. We cannot be certain that we have been or will be at all times in complete compliance with such laws, regulations and permits. If we violate or fail to comply with these laws, regulations or permits, we could be fined or otherwise sanctioned by regulators.
Prior to commencement of mining, we must submit to, and obtain approval from, the appropriate regulatory authority of plans showing where and how mining and reclamation operations are to occur. These plans must include information such as the location of mining areas, stockpiles, surface waters, haul roads, tailings basins and drainage from mining operations. All requirements imposed by any such authority may be costly and time-consuming and may delay commencement or continuation of exploration or production operations. See Item 2. Properties. — Environment.
In addition, new legislation and/or regulations and orders, including proposals related to climate change and protection of the environment, to which we would be subject or that would further regulate and/or tax our customers, namely the North American integrated steel producer customers, may also require us or our customers to reduce or otherwise change operations significantly or incur additional costs. Such new legislation, regulations or orders (if enacted) could have a material adverse effect on our business, results of operations, financial condition or profitability. The Company’s U.S. operations are subject to MACT emissions standards for particulate matter promulgated by the EPA under the Clean Air Act effective October 31, 2006. Improved emission controls and monitoring systems have been installed at a capital cost of $4.3 million in 2006 to meet these new requirements. EPA’s decision not to regulate emissions of mercury or asbestos in the MACT Rule is the subject of a court remand, and the outcome cannot be predicted. The Company joined in a Petition to Delist the taconite emissions sources from the MACT Rule, but this has yet to be acted upon by EPA.
Further, we are subject to a variety of potential liability exposures arising at certain sites where we do not currently conduct operations. These sites include sites where we formerly conducted iron ore mining or processing or other operations, inactive sites that we currently own, predecessor sites, acquired sites, leased land sites and third-party waste disposal sites. We may be named as a responsible party at other sites in the future and we cannot be certain that the costs associated with these additional sites will not be material.
We also could be held liable for any and all consequences arising out of human exposure to hazardous substances used, released or disposed of by us or other environmental damage, including damage to natural resources. In particular, we and certain of our subsidiaries are involved in various claims relating to the exposure of asbestos and silica to seamen who sailed on the Great Lakes vessels formerly owned and operated by certain of our subsidiaries. The full impact of these claims, as well as whether insurance coverage will be sufficient and whether other defendants named in these claims will be able to fund any costs arising out of these claims, continues to be unknown. See Item 3. Legal Proceedings.
22
Our expenditures for postretirement benefit and pension obligations could be materially higher than we have predicted if our underlying assumptions prove to be incorrect, if there are mine closures or our joint venture partners fail to perform their obligations that relate to employee pension plans.
We provide defined benefit pension plans and OPEB benefits to eligible union and non-union employees, including our share of expense and funding obligations with respect to unconsolidated ventures. Our pension expense and our required contributions to our pension plans are directly affected by the value of plan assets, the projected and actual rate of return on plan assets and the actuarial assumptions we use to measure our defined benefit pension plan obligations, including the rate at which future obligations are discounted.
We cannot predict whether changing market or economic conditions, regulatory changes or other factors will increase our pension expenses or our funding obligations, diverting funds we would otherwise apply to other uses.
We have calculated the unfunded obligation based on a number of assumptions. Discount rate, return on plan assets, and mortality assumptions parallel those utilized for pensions. If our assumptions do not materialize as expected, cash expenditures and costs that we incur could be materially higher. Moreover, we cannot be certain that regulatory changes will not increase our obligations to provide these or additional benefits. These obligations also may increase substantially in the event of adverse medical cost trends or unexpected rates of early retirement, particularly for bargaining unit retirees for whom there is currently no retiree healthcare cost cap. Early retirement rates likely would increase substantially in the event of a mine closure.
We are a related party to certain companies that were operators and are required under the Coal Industry Retiree Health Benefit Act of 1992 (the “Coal Retiree Act”) to make premium payments to the United Mine Workers Association Combined Benefit Fund (the “Combined Fund”), and our obligations to the Combined Fund could increase if other coal mine operators file for bankruptcy protection or become insolvent.
We are a related-party to certain companies that were coal mine operators. As a result we are subject to the Coal Retiree Act and are obligated to make premium payments to the Combined Fund for health and death benefits paid by the Combined Fund to retired coal miners. At December 31, 2006, the net present value of our estimated liability to the Combined Fund was $4.5 million. We are assessed premiums for unassigned or “orphan” retirees on a pro rata basis with other coal mine operators and related parties. If other coal mine operators and related parties file for bankruptcy protection or become insolvent, our pro rata portion of the liability to the Combined Fund could increase, which could have an adverse effect on our results of operations and financial condition.
Our profitability could be negatively affected if we fail to maintain satisfactory labor relations.
The USW represents all hourly employees at our Empire, Hibbing, Tilden and United Taconite mines, as well as Wabush in Canada. The USW has also been attempting to organize our employees at our Northshore mine. A four-year labor agreement was reached in August 2004 with our U.S. labor force and a five-year agreement that runs until March 2009 was reached with our Canadian work force. Hourly employees at the railroads we own that transport products among our facilities are represented by multiple unions with labor agreements that expire at various dates. If the collective bargaining agreements relating to the employees at our mines or railroad are not successfully renegotiated prior to their expiration, we could face work stoppages or labor strikes.
Our operating expenses could increase significantly if the price of electrical power, fuel or other energy sources increases.
Operating expenses at our mining locations are sensitive to changes in electricity prices and fuel prices, including diesel fuel and natural gas prices, which represent 25 percent of our North American operating costs. Prices for electricity, natural gas and fuel oils can fluctuate widely with availability and demand levels from other users. During periods of peak usage, supplies of energy may be curtailed and we may not be able to purchase them at historical rates. While we have some long-term contracts with electrical suppliers, we are exposed to
23
fluctuations in energy costs that can affect our production costs. We enter into forward fixed-price supply contracts for natural gas and diesel fuel for use in our operations. Those contracts are of limited duration and do not cover all of our fuel needs, and price increases in fuel costs could cause our profitability to decrease significantly.
Equipment and supply shortages may impact our production.
We have recently experienced longer lead times on equipment, tires, and supply needs due to the increased demand for these resources. As the global mining industry increases its capacity, demand for these resources will increase, potentially resulting in higher prices, equipment shortages, or both.
We may encounter labor shortages for critical operational positions, which could affect our ability to produce iron ore products.
At our North American locations, many of our mining operational employees are approaching retirement age. As these experienced employees retire, we may have difficulty replacing them at competitive wages. In Western Australia, the large number of expansion projects currently in progress has created turnover principally for our contractors’ employees. As a result, wages are increasing to address the turnover.
Our profitability could be affected by the failure of outside contractors to perform.
Portman uses contractors to handle many of the operational phases of its mining and processing operations and therefore is subject to the performance of outside companies on key production areas.
Our failure to maintain effective internal control over financial reporting may not allow us to accurately report our financial results, which could cause our financial statements to become materially misleading and adversely affect the trading price of our common shares.
We require effective internal control over financial reporting in order to provide reasonable assurance with respect to our financial reports and to effectively prevent fraud. Internal control over financial reporting may not prevent or detect misstatements because of its inherent limitations, including the possibility of human error, the circumvention or overriding of controls, or fraud. Therefore, even effective internal controls can provide only reasonable assurance with respect to the preparation and fair presentation of financial statements. If we cannot provide reasonable assurance with respect to our financial statements and effectively prevent fraud, our financial statements could become materially misleading, which could adversely affect the trading price of our common shares. Our management determined that we had a material weakness in our internal control over financial reporting due to the failure to maintain a sufficient complement of personnel with an appropriate level of technical accounting knowledge, experience and training to consistently perform independent secondary reviews and to appropriately interpret and apply complex accounting standards. We are enhancing our internal controls in order to remediate the material weakness. Implementing new internal controls and testing the internal control framework will require the dedication of additional resources, management time and expense. If we fail to correct the material weakness with our internal control over financial reporting, including any failure to implement required new or improved controls, or if we experience difficulties in their implementation, our business, financial condition and operating results could be harmed.
We may be unable to successfully identify, acquire and integrate strategic acquisition candidates.
Our ability to grow successfully through acquisitions depends upon our ability to identify, negotiate, complete and integrate suitable acquisitions and to obtain necessary financing. It is possible that we will be unable to successfully complete potential acquisitions. In addition, the costs of acquiring other businesses could increase if competition for acquisition candidates increases. Additionally, the success of an acquisition is subject to other risks and uncertainties, including our ability to realize operating efficiencies expected from an acquisition, the size or quality of the resource, delays in realizing the benefits of an acquisition, difficulties in retaining key employees, customers or suppliers of the acquired businesses, difficulties in maintaining uniform controls, procedures, standards and policies throughout acquired companies, the risks associated with the assumption of contingent or undisclosed liabilities of acquisition targets, the impact of changes to our allocation of purchase price, and the ability to generate future cash flows or the availability of financing.
24
We are subject to risks involving foreign operations.
We have a strategy to broaden our scope as a supplier of iron ore and other raw materials to the integrated steel industry in North American and international markets. The 2005 acquisition of Portman was the first step in our strategy. We completed the acquisition of Centennial Amapa, giving us a 30 percent interest in the Amapa Project in Brazil and invested in the Sonoma Coal Project in Australia. We are also pursuing other projects. As we expand beyond our traditional North American base business, we will be exposed to additional risks beyond those risks relating to our North American iron ore operations, such as fluctuations in the U.S. Dollar relative to other currencies; legal and tax limitations on our ability to repatriate earnings into the U.S. in an efficient manner; potential negative international impacts resulting from U.S. foreign and domestic policies, including government embargoes or foreign trade restrictions; the imposition of duties, tariffs, import and export controls and other trade barriers impacting the seaborne iron ore and coal markets; difficulties in staffing and managing multi-national operations; and uncertainties in the international enforcement of legal rights and remedies. If we are unable to manage successfully the risks associated with expanding our global business, these risks could have a material adverse effect on our business, results of operations or financial condition.
Item 1B. Unresolved Staff Comments.
We have no unresolved comments from the SEC.
The following map shows the locations of our North American mines:
We directly or indirectly own and operate interests in the following six North American iron ore mines:
| Location and Name |
Ownership interest as of December 31, 2006, 2005 & 2004 |
||
| Empire |
79.0 | % | |
| Tilden |
85.0 | ||
| Hibbing |
23.0 | ||
| Northshore |
100.0 | ||
| United Taconite |
70.0 | ||
| Wabush |
26.8 |
Empire Mine
The Empire mine is located on the Marquette Iron Range in Michigan’s Upper Peninsula approximately 15 miles west-southwest of Marquette, Michigan and is accessed via a paved road off State Highway 35. The mine has been in operation since 1963. Over the past five years, the Empire mine has produced between 3.6 million and 5.4 million tons of iron ore pellets annually.
25
We entered into an agreement with Ispat effective December 31, 2002, that restructured the ownership of the Empire mine and increased our ownership from 46.7 percent to 79 percent in exchange for assumption of all mine liabilities. Under the terms of the agreement, we acquired the 25 percent interest rejected by LTV Corporation in its chapter 11 bankruptcy proceedings and a 19 percent interest from Ispat. We indemnified Ispat from obligations of Empire in exchange for certain future payments to Empire and to us by Ispat of $120.0 million, recorded at a present value of $54.9 million at December 31, 2006 ($59.8 million at December 31, 2005) with $42.9 million classified as Long-term receivable with the balance current, over the 12-year life of the supply agreement. A subsidiary of Mittal Steel USA has retained a 21 percent ownership in Empire, which it has a unilateral right to put to us at the end of 2007. We are the sole outside supplier of pellets purchased under the Ispat agreement, assumed by Mittal Steel USA, for the term of the supply agreement. We manage the mine. We and Mittal Steel USA take our respective share of production pro rata; however, provisions in the partnership agreement allow additional or reduced production to be delivered under certain circumstances. We own directly approximately one-half of the remaining ore reserves at the Empire mine and lease them to Empire. The Empire mine leases the balance of its reserves from the other owners of such reserves.
Tilden Mine
The Tilden mine is located on the Marquette Iron Range in Michigan’s Upper Peninsula approximately five miles south of Ishpeming, Michigan. The main entrance to the Tilden mine is accessed by means of a paved road off of County Road 476. The Tilden mine has been in operation since 1974. Over the past five years, the Tilden mine has produced between 6.9 million and 7.9 million tons of iron ore pellets annually.
On January 31, 2002, we increased our ownership of the Tilden mine to 85 percent by acquiring Algoma’s 45 percent interest in the mine for assumption of mine liabilities and executed a term supply agreement under which we are Algoma’s sole supplier of iron ore pellets for 15 years. The acquisition increased our share of annual production capacity by 3.5 million tons. Currently, we manage the mine and have an 85 percent interest and Stelco has a 15 percent interest in the mine. Each partner takes its share of production pro rata; however, provisions in the partnership agreement allow additional or reduced production to be delivered under certain circumstances. We own all of the ore reserves at the Tilden mine and lease them to Tilden.
The Empire and Tilden mines are located adjacent to each other. The increase in ownership of our Michigan mines facilitated consolidation of operations and management, which offer operational and cost benefits that were not achievable under the previous ownership structure. These benefits include a consolidated transportation system, more efficient employee and equipment operating schedules, reduction in redundant facilities and workforce and best practices sharing.
Hibbing Mine
The Hibbing mine is located in the center of Minnesota’s Mesabi Iron Range and is approximately ten miles north of Hibbing, Minnesota and five miles west of Chisholm, Minnesota. The main entrance to the Hibbing mine is accessed by means of a paved road and is located off County Road 5. The Hibbing mine has been in operation since 1976. Over the past five years, the Hibbing mine has produced between 7.7 million and 8.5 million tons of iron ore pellets annually.
In July 2002, we acquired (effective retroactive to January 1, 2002) an eight percent interest in Hibbing from Bethlehem for the assumption of mine liabilities associated with the interest. The acquisition increased our ownership of Hibbing from 15 percent to 23 percent. This transaction reduced Bethlehem’s ownership interest in Hibbing to 62.3 percent. In October 2001, Bethlehem filed for protection under chapter 11 of the U.S. Bankruptcy Code. At the time of the filing, we had a trade receivable of $1.0 million, which has been written off. In May 2003, ISG purchased the assets of Bethlehem, including Bethlehem’s 62.3 percent interest in Hibbing. We manage the mine. Mittal Steel USA, which acquired ISG, has a 62.3 percent interest and Stelco has a 14.7 percent interest in the mine. Each partner takes its share of production pro rata; however, provisions in the joint venture agreement allow additional or reduced production to be delivered under certain circumstances.
Northshore Mine
The Northshore mine is located in northeastern Minnesota, approximately two miles south of Babbitt, Minnesota on the northeastern end of the Mesabi Iron Range. Northshore’s processing facilities are located in
26
Silver Bay, Minnesota, near Lake Superior, on U.S. Highway 61. The main entrance to the Northshore mine is accessed by means of a gravel road and is located off County Road 20. The Northshore mine has been in continuous operation since 1990. Over the past five years, the Northshore mine has produced between 4.2 million and 5.1 million tons of iron ore pellets annually.
The Northshore mine began production under our management and ownership on October 1, 1994. We own 100 percent of the mine.
United Taconite
The United Taconite mine is located on Minnesota’s Mesabi Iron Range in and around the city of Eveleth, Minnesota, west of U.S. Highway 53. The main entrance to the United Taconite mine is accessed by means of a paved road and is located off Route 37. The mine has been operating since 1965. Over the past five years, the United Taconite mine has produced between 1.6 million and 4.9 million tons of iron ore pellets annually.
Effective December 1, 2003, United Taconite purchased the ore mining and pelletizing assets of Eveleth Mines. Eveleth Mines had ceased mining operations in May 2003 after filing for chapter 11 bankruptcy protection on May 1, 2003. Under the terms of the purchase agreement, United Taconite purchased all of Eveleth Mines’ assets for $3 million in cash and the assumption of certain liabilities, primarily mine closure-related environmental obligations. As a result of this transaction, we, after assigning appropriate values to assets acquired and liabilities assumed, recorded an extraordinary gain of $2.2 million, net of $.5 million tax and $1.2 million minority interest. In conjunction with this transaction, we and our Wabush Mines venture partners entered into pellet sales and trade agreements with Laiwu to optimize shipping efficiency. We manage the mine and hold a 70 percent interest; Laiwu holds a 30 percent interest. Sales to Laiwu under these contracts totaled .1 million tons and .3 million tons in 2006 and 2005, respectively.
Wabush Mines
The Wabush mine and concentrator is located in Wabush, Labrador, Canada, and the pellet plant is located in Pointe Noire, Quebec, Canada. The main entrance to the Wabush mine is accessed by means of a paved road and is located on Highway 530, about three miles west of the town of Wabush. The pellet plant is accessed by a paved road off Highway 138, about ten miles west of the town of Sept-Iles, Quebec. The Wabush mine has been in operation since 1965. Over the past five years, Wabush has produced between 3.8 million and 5.2 million tons of iron ore pellets annually.
In 1997, we acquired Ispat’s interest in the Wabush mine. In August 2002, we acquired our proportionate share (approximately 4.05 percent) of the 15.09 percent interest rejected by Acme in its bankruptcy proceedings. As a result of these two events, we increased our ownership in the mine from 7.7 percent to 26.83 percent. Acme had discontinued funding its Wabush obligations in August 2001. We also manage the mine. Stelco has a 44.6 percent interest and Dofasco has a 28.6 percent interest in the mine. Wabush successfully completed actions that increased annual pellet production to a 4.9 million ton rate by the end of 2006. Additionally, a C$1.4 million project was approved in 2006 to install a manganese reduction test circuit on one processing line in the Wabush concentrator. Successful operations of the test circuit could lead to the installation of manganese reduction on all Wabush processing lines. The capability to remove manganese from crude ore could allow the processing of ores previously classified as waste and potentially extend the life of the mine. Production for 2007 is estimated at 4.8 million tons of pellets.
27
The following map shows the locations of our Australia mines:
|
|
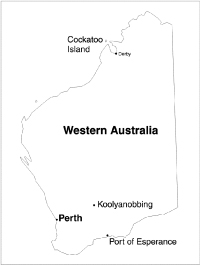 |
Koolyanobbing
The Koolyanobbing operations are located 425 kilometers east of Perth and approximately 50 kilometers northeast of the town of Southern Cross. Koolyanobbing produces lump and fine iron ore. A capacity expansion program was completed in 2006 to increase capacity from six to eight million tonnes per annum. The expansion was primarily driven by the development of iron ore resources at Mt. Jackson and Windarling, located 80 kilometers and 100 kilometers north of the existing Koolyanobbing operations, respectively. Over the past five years, the Koolyanobbing operation has produced between 4.1 million and 6.9 million tonnes annually.
Cockatoo Island
The Cockatoo Island operation is located six kilometers to the west of Yampi Peninsula, in the Buccaneer Archipelago, and 140 kilometers north of Derby in the West Kimberley region of Western Australia. The island has been mined for iron ore since 1951, with a break in operations between 1985 and 1993. Over the past five years, Cockatoo Island has produced between .3 million and 1.5 million tonnes annually at the 100 percent ownership level.
Portman commenced a beneficiation project in 1993 that was completed in mid-2000. Portman and HWE then formed a 50:50 joint venture to mine remnant iron ore deposits on mining tenements held by BHP and mined by BHP from 1951 to 1985. HWE’s interest in the operations was acquired out of receivership by Leighton in early 2006. Mining from this phase of the operation commenced in late 2000 and is expected to continue, based on current reserves, until late 2007. Studies are underway evaluating the technical and economic feasibility of developing a below-sea-level eastward resource extension of the Cockatoo deposit. Ore is hauled by haul truck to the stockpiles, crushed and screened and then transferred by conveyor to the shiploader.
Transportation
Two railroads, one of which is wholly owned by us, link the Empire and Tilden mines with Lake Michigan at the loading port of Escanaba, Michigan and with the Lake Superior loading port of Marquette, Michigan. From the Mesabi Range, Hibbing pellets are transported by rail to a shiploading port at Superior, Wisconsin. United Taconite pellets are shipped by railroad to the port of Duluth, Minnesota. At Northshore, crude ore is shipped by a wholly owned railroad from the mine to processing and dock facilities at Silver Bay, Minnesota. In Canada, there is an open-pit mine and concentrator at Wabush, Labrador, Newfoundland and a pellet plant and dock facility at Pointe Noire, Quebec. At the Wabush mine, concentrates are shipped by rail from the Scully mine at Wabush to Pointe Noire where they are pelletized for shipment via vessel to Canada, the United States and other international destinations or shipped as concentrates for sinter feed.
28
All of the ore mined at the Koolyanobbing operations is transported by rail to the Port of Esperance, 575 kilometers to the south for shipment to Asian customers. Direct ship premium fines mined at Cockatoo Island are loaded at a local dock.
Internal Control over Reserve Estimation
We have a corporate policy relating to internal control and procedures with respect to auditing and estimating ore reserves. The procedures include the calculation of ore reserves at each mine by mining engineers and geologists under the direction of our Chief Mining Engineer and Chief Long Range Planning Engineer. Our General Manager-Resource Analysis and Engineering compiles, reviews, and submits the calculations to the Corporate Accounting department, where the disclosures for our annual and quarterly reports are prepared based on those calculations. The draft disclosure is submitted to our General Manager-Resource Analysis and Engineering for further review and approval. The draft disclosures are then reviewed and approved by our Chief Financial Officer and Chief Executive Officer before inclusion in our annual and quarterly reports. Additionally, the long-range mine planning and ore reserve estimates are reviewed annually by our Audit Committee. Furthermore, all changes to ore reserve estimates, other than those due to production, are documented by our General Manager-Resource Analysis and Engineering and are submitted to our President and Chief Executive Officer for review and approval. Finally, we perform periodic reviews of long-range mine plans and ore reserve estimates at mine staff meetings and senior management meetings.
Operations
In North America, we produced 20.8 million tons, 22.1 million tons and 21.7 million tons of pellets in 2006, 2005 and 2004, respectively, for our account and 12.8 million tons, 13.8 million tons and 12.7 million tons, respectively, on behalf of the steel company owners of the mines. In Australia, we produced 7.7 million tonnes and 5.2 million tonnes in 2006 and 2005, respectively. Portman’s 2005 total represents production since the March 31, 2005 acquisition of Portman. See Production and Sales Volume in Item 7 for further information.
Our business is subject to a number of operational factors that can affect our future profitability. A more detailed description of these risks is contained in Item 1A — Risk Factors.
Mine Capacity and Iron Ore Reserves
Reserves are defined by SEC Industry Standard Guide 7 as that part of a mineral deposit that could be economically and legally extracted and produced at the time of the reserve determination. The estimate of proven and probable reserves is of demonstrated tons. All reserve estimates are supported by scheduled life of mine plans.
Our 2007 ore reserve estimates for our iron ore mines as of December 31, 2006 were estimated from fully-designed pits developed using three-dimensional modeling techniques. These fully designed pits incorporate design slopes, practical mining shapes and access ramps to assure the accuracy of our reserve estimates. The following tables reflect expected current annual capacity and economic ore reserves for our North American and Australian iron ore mines as of December 31, 2006.
29
| Mine |
Iron Ore Mineralization |
Tons in Millions (1) | Mineral Rights | Method of Reserve Estimation |
Operating Since |
Infrastructure | ||||||||||||||
| Current Annual Capacity |
Mineral Reserves (2) (3) |
|||||||||||||||||||
| Current Year |
Previous Year |
|||||||||||||||||||
| Owned | Leased | |||||||||||||||||||
| Empire |
Negaunee Iron | 5.5 | 13 | 17 | 57 | % | 43 | % | Geologic - Block | 1963 | Mine, Concentrator, | |||||||||
| Formation | Model | Pelletizer | ||||||||||||||||||
| (Magnetite) | ||||||||||||||||||||
| Tilden |
Negaunee Iron | 8.0 | 259 | 266 | 100 | % | 0 | % | Geologic - Block | 1974 | Mine, Concentrator, | |||||||||
| Formation | Model | Pelletizer, Railroad | ||||||||||||||||||
| (Hematite / Magnetite) | ||||||||||||||||||||
| Hibbing Taconite |
Biwabik Iron | 8.0 | 152 | 161 | 3 | % | 97 | % | Geologic - Block | 1976 | Mine, Concentrator, | |||||||||
| Formation | Model | Pelletizer | ||||||||||||||||||
| (Magnetite) | ||||||||||||||||||||
| Northshore |
Biwabik Iron | 4.8 | 318 | 310 | 0 | % | 100 | % | Geologic - Block | 1989 | Mine, Concentrator, | |||||||||
| Formation | Model | Pelletizer, Railroad | ||||||||||||||||||
| (Magnetite) | ||||||||||||||||||||
| United Taconite |
Biwabik Iron | 5.2 | 119 | 123 | 0 | % | 100 | % | Geologic - Block | 1965 | Mine, Concentrator, | |||||||||
| Formation | Model | Pelletizer | ||||||||||||||||||
| (Magnetite) | ||||||||||||||||||||
| Wabush |
Wabush Iron | 5.5 | 44 | 51 | 0 | % | 100 | % | Geologic - Block | 1965 | Mine, Concentrator, | |||||||||
| Formation | Model | Pelletizer, Railroad | ||||||||||||||||||
| (Hematite) | ||||||||||||||||||||
| Total | 37.0 | 905 | 928 | |||||||||||||||||
| (1) | Tons are long tons of pellets of 2,240 pounds. |
| (2) | Estimated standard equivalent pellets, including both proven and probable reserves based on life of mine operating schedules. |
| (3) | We regularly evaluate our ore reserve estimates and update them as required in accordance with the SEC Industry Guide 7. |
| Mine Project |
Iron Ore Mineralization |
Tons in Millions (1) | Mineral Rights | Method of Reserve Estimation |
Operating Since |
Infrastructure | ||||||||||||||
| Current Annual Capacity |
Mineral Reserves (2)(3) |
|||||||||||||||||||
| Current Year |
Previous Year |
|||||||||||||||||||
| Owned | Leased | |||||||||||||||||||
| Koolyanobbing (4) |
Banded Iron Formations Southern Cross Terrane Yilgarn Mineral Field (Hematite, Goethite) | 8.0 | 87.0 | 87.5 | 0 | % | 100 | % | Geologic - Block Model | 1994 | Mine, Train Haulage Road, Crushing-Screening Plant | |||||||||
| Cockatoo Island JV (5) |
Sandstone Yampi Formation Kimberley Mineral Field (Hematite) | 1.2 | .9 | 1.7 | 0 | % | 100 | % | Geologic - Block Model | 1994 | Mine, Crushing-Screening Plant, Shiploader | |||||||||
| Total |
9.2 | 87.9 | 89.2 | |||||||||||||||||
| (1) | Tonnes are metric tons of 2,205 pounds. |
| (2) | Reported ore reserves restricted to proven and probable tonnages based on life of mine operating schedules. Koolyanobbing reserves can be derived from up to 15 separate mineral deposits over a 100-kilometer operating distance. 7.4 million tonnes of the Koolyanobbing reserves are sourced from current long-term stockpiles. |
| (3) | Portman’s ore reserve estimates are regularly updated in accordance with SEC Industry Guide 7 and the 2004 Edition of the JORC code. |
| (4) | An expansion project was completed in 2006 that increased annual production capacity to eight million tonnes. |
| (5) | Portman has a 50 percent interest in the Cockatoo Island Joint Venture. Capacity and reserve totals represent 100 percent. |
We directly own approximately one-half of the remaining ore reserves at the Empire mine and approximately three percent of the reserves at the Hibbing mine, and lease or sublease the balance of the reserves in these mines from their owners. We own all of the ore reserves at the Tilden mine. The ore reserves at Northshore, United Taconite and Wabush are owned by others and leased or subleased directly to those mines. The Koolyanobbing operations and Cockatoo Island ore reserves are derived from Crown lands owned and managed by the Western Australia state government.
In 2006, there were no changes in reserve estimates at Empire, Hibbing, Tilden or United Taconite, except for production. A new ore reserve estimate was completed in September 2006 at Northshore, along with a new
30
pit design and production schedules. The updated ore reserve estimate calculated a four percent increase, or 13 million tons. The estimate included a complete remodeling of the mine geology, additional ore characterization data for improved definition of ore and waste, application of improved metallurgical grade cut-offs, updated financial inputs, ultimate pit design and life-of-mine scheduling.
The Wabush ore reserve has decreased by 3.5 million tons in addition to production. This is due to a reevaluation based on higher operating costs and pellet prices, a change in the manganese pellet production split from 60 percent low and 40 percent high manganese pellets to 40 percent low and 60 percent high, and decreasing the maximum pit depths due to water limitations. A new ore reserve base, completed during 2005, continues to be verified. The current estimate uses the ore reserve estimate generated in 2003, with no material changes occurring in the interim. This reserve has been scheduled to exhaustion to meet the 40/60 percent manganese pellet production mix and updated with current costs and pellet pricing. Final verification of the updated geological model and a complete ore reserve estimate is scheduled for 2007.
The 2006 Portman ore reserve estimates represent an increase of 7.6 million tonnes net of mine depletion. The increases reflect iron ore exploration success expanding the in-situ mineral resources at both the Koolyanobbing and Cockatoo operations as well as improved mining reconciliations with maturity of the operating pits. We are studying the use of existing technologies to beneficiate lower grade ores, which if successful, could increase the ore reserve base.
General Information about the Mines
Leases. Mining is conducted on multiple mineral leases having varying expiration dates. Mining leases are routinely renegotiated and renewed as they approach their respective expiration dates.
Exploration and Development. All mining operations are open-pit mines that are in production. Additional pit development is underway at each mine as required by long-range mine plans. Drilling programs are conducted periodically for the purpose of refining guidance related to ongoing operations. An exploration program targeting extensions to Portman’s known iron ore resources as well as regional exploration targets in the Yilgarn Mineral Field was active in 2006 and will continue in 2007. At Cockatoo Island, exploration drilling was completed in 2006 that successfully increased the resource base. Studies are underway evaluating the technical and economic feasibility of developing a below-sea-level eastward resource extension of the Cockatoo deposit.
The Biwabik, Negaunee, and Wabush Iron Formations are classified as Lake Superior type iron-formations that formed under similar sedimentary conditions in shallow marine basins approximately two billion years ago. Magnetite and/or hematite are the predominant iron oxide ore minerals present, with lesser amounts of goethite and limonite. Chert is the predominant waste mineral present, with lesser amounts of silicate and carbonate minerals. The ore minerals readily liberate from the waste minerals upon fine grinding.
The mineralization at the Koolyanobbing operations is predominantly hematite and goethite replacements in greenstone-hosted banded iron-formations. Individual deposits tend to be small with complex ore-waste contact relationships. The Koolyanobbing operations reserves are derived from 15 separate mineral deposits distributed over a 100-kilometer operating radius. The mineralization at Cockatoo Island is predominantly friable, hematite-rich sandstone that produces premium high grade, low impurity direct shipping fines.
Geologic models are developed for all mines to define the major ore and waste rock types. Computerized block models are then constructed that include all relevant geologic and metallurgical data. These are used to generate grade and tonnage estimates, followed by detailed mine design and life of mine operating schedules.
31
Mine Facilities and Equipment. Each of the North American mines has crushing, concentrating, and pelletizing facilities. There are crushing and screening facilities at Koolyanobbing and Cockatoo Island. The facilities at each site are in satisfactory condition, although they require routine capital and maintenance expenditures on an ongoing basis. Certain mine equipment generally is powered by electricity, diesel fuel or gasoline. The total cost of the property, plant and equipment, net of applicable accumulated amortization and depreciation as of December 31, 2006, for each of the mines is set forth in the chart below.
| (In Millions) | ||||
| Location and Name |
Total Historical Cost of Mine Plant and Equipment (Excluding Real Estate and Construction in Progress), Net of Applicable Accumulated Amortization and Depreciation |
|||
| Empire |
$ | 92.8 | (1) | |
| Tilden |
201.3 | (2) | ||
| Hibbing |
467.5 | (3) | ||
| Northshore |
83.1 | |||
| United Taconite |
61.8 | |||
| Wabush |
317.3 | (3) | ||
| Portman |
160.9 | |||
| (1) | Includes capitalized financing costs of $9.6 million, net of accumulated amortization. |
| (2) | Includes capitalized financing costs of $19.2 million, net of accumulated amortization. |
| (3) | Does not reflect depreciation, which is recorded by the individual venturers. |
Competition
We compete with several iron ore producers in North America, including Iron Ore Company of Canada, Quebec Cartier Mining Company and U.S. Steel, as well as other steel companies that own interests in iron ore mines that may have excess iron ore inventories. In addition, significant amounts of iron ore have, since the early 1980s, been shipped to the United States from Brazil and Venezuela in competition with iron ore produced by us.
As the North American steel industry continues to consolidate, a major focus of the consolidation is on the continued life of the integrated steel industry’s raw steelmaking operations, i.e., blast furnaces and basic oxygen furnaces that produce raw steel. Some steelmakers are importing semi-finished steel slabs as an alternative to using blast furnaces and basic oxygen furnaces to produce steel because of the costs associated with relining blast furnaces and maintaining coke ovens. These imported steel slabs can be converted and finished in the steelmaker’s downstream finishing facilities. In addition, other competitive forces have become a large factor in the iron ore business. Electric furnaces built by mini-mills, which are steel recyclers, generally produce steel by using scrap steel, not iron ore pellets, in their electric furnaces.
Competition among the sellers of iron ore pellets is predicated upon the usual competitive factors of price, availability of supply, product performance, service and transportation cost to the consumer.
Portman exports iron ore products to China and Japan in the world seaborne trade. Portman competes with major iron ore exporters from Australia, Brazil and India.
Environment
North America
In the construction of our facilities and in their operation, substantial costs have been incurred and will continue to be incurred to avoid undue effect on the environment. Our North American capital expenditures relating to environmental matters were $10.9 million, $8.3 million and $7.3 million in 2006, 2005 and 2004, respectively. It is estimated that approximately $10.5 million will be spent in 2007 for capital environmental control facilities.
32
Various legislative bodies and federal and state agencies are continually promulgating new laws and regulations affecting us, our customers, and our suppliers in many areas, including waste discharge and disposal, hazardous classification of materials and products, air and water discharges, and many other environmental, health and safety matters. Although we believe that our environmental policies and practices are sound and do not expect that the application of any current laws or regulations would reasonably be expected to result in a material adverse effect on our business or financial condition, we cannot predict the collective adverse impact of the expanding body of laws and regulations.
The iron ore industry has been identified by the EPA as an industrial category that emits pollutants established by the 1990 Clean Air Act Amendments. These pollutants included over 200 substances that are now classified as hazardous air pollutants (“HAP”). The EPA is required to develop rules that would require major sources of HAP to utilize MACT standards for their emissions. Pursuant to this statutory requirement, the EPA published a final rule on October 30, 2003 imposing emission limitations and other requirements on taconite iron ore processing operations. On December 15, 2005, we and Ispat-Inland Mining Company filed a Petition to Delete as a source category regulated by Section 112 of the Clean Air Act. EPA requested additional information, and a supplement was submitted to the EPA on August 22, 2006. A response is pending.
We were in compliance with the requirements of MACT as of the October 31, 2006 deadline. Our capital expenditures in 2006 to meet the MACT standards were $4.3 million. On January 23, 2004, the National Wildlife Federation, Minnesota Conservation Federation, Lake Superior Alliance and Save Lake Superior Association filed a petition for review of the EPA’s final MACT rule in the United States Court of Appeals for the District of Columbia. This petition challenges the EPA’s decision not to impose standards for mercury and asbestos and monitoring of formaldehyde from taconite indurating furnaces. We filed a petition to intervene in this case. Typically, the EPA’s consideration of a petition is an iterative process extending over several months, with a longer period for controversial subjects. Subsequently, the Court remanded to EPA the asbestos and mercury rules. The National Wildlife Federation, the Minnesota Conservation Federation and Save Lake Superior Association also voluntarily dismissed the petition with respect to the formaldehyde rules. The EPA has yet to respond to the remand.
On December 16, 2006, we submitted an administrative permit amendment application to the MPCA with respect to Northshore’s Title V operating permit. The proposed amendment requested the deletion of a 30 year old “control city” monitoring requirement which was used to assess the adequacy of air emission control equipment installed in the 1970s. MPCA had discontinued use of control city monitoring in the early 1980s, but had recently reinstituted monitoring. The control city monitoring compared ambient fiber levels in St. Paul, Minnesota to levels at Northshore and the surrounding area. The amendment application argued that the control city monitoring requirement is an obsolete and redundant standard given Northshore’s existing emission control equipment and applicable federal regulations, state rules, and permit requirements.
We have received a letter dated February 23, 2007 from the MPCA notifying us that our request for an administrative permit amendment has been denied. We have appealed the denial to the Minnesota Court of Appeals. We are also currently in negotiations with the MPCA on a compliance schedule. Subsequent to the filing of our appeal, the MPCA advised Northshore that the MPCA considered Northshore to be in violation of the control city standard. Without conceding MPCA’s allegations, we have entered into discussions with the MPCA with respect to the terms of a compliance schedule in which we would agree to take certain actions in settlement of the alleged violation. Discussions with the MPCA are currently ongoing. In addition, the Minnesota Center for Environmental Advocacy has since filed a motion with the Court of Appeals to intervene in our appeal of the denial of an administrative amendment to our Title V operating permit. If either our appeal is unsuccessful or if we are unable to negotiate an acceptable compliance schedule, Northshore could be subject to future enforcement actions with respect to its Title V permit if we are unable to meet the control city requirement as interpreted by MPCA.
Australia
Portman achieved significant progress in environmental management during 2005 and 2006. As production activity from the new operations at Mt. Jackson and Windarling consolidated, the emphasis in environmental
33
management shifted from control of mine establishment and construction activities to implementation and ongoing development of the Koolyanobbing Project Environmental Management System and conservation initiatives.
The key elements of a number of environmental management plans that were required under governmental approvals were consolidated into one system manual in 2005. The environmental management system was reviewed in October 2005 and determined to be on schedule to achieve certification to the ISO 14001 Standard within the following 18 months.
On May 14, 2007, the Australian Environmental Protection Authority (“AEPA”) published a study in which the AEPA recommended the establishment of “A class reserves” for the protection of certain allegedly environmentally sensitive areas of Western Australia. Some of the proposed A class reserves overlap with mining tenements granted to Portman (the “Overlapping Areas”). The AEPA study has been submitted to the Minister for the Environment and Heritage.
Portman originally received governmental approval to mine in the Overlapping Areas in June 2003. Since that time, Portman has met all applicable environmental requirements. Although we are currently reviewing the study and the effects of the designation of the Overlapping Areas as A class reserves, such categorization may have a material effect on Portman’s operations. It is unknown at this time whether the Minister for the Environment and Heritage will accept the recommendations of the AEPA. If the recommendations of the AEPA are accepted, Portman will challenge any such decision.
For additional information on our environmental matters, see Item 3. Legal Proceedings and NOTE 5 — ENVIRONMENTAL AND MINE CLOSURE OBLIGATIONS.
Energy
Electricity. The Empire and Tilden mines each have electric power supply contracts with WEPCO that are effective through 2007 and include an energy price cap and certain power curtailment features. We have resolved our dispute with WEPCO regarding certain pricing provisions of our contract. The Empire and Tilden mines also recently entered into settlement with WEPCO on tariff rates that will apply beginning in 2008. See Item 3. Legal Proceedings for further information.
Electric power for the Hibbing mine and the United Taconite mine is supplied by Minnesota Power, Inc., under agreements that continue to December 2008 and October 2008, respectively.
Silver Bay Power Company, an indirect wholly owned subsidiary of ours, with a 115 megawatt power plant, provides the majority of Northshore’s energy requirements, has an interconnection agreement with Minnesota Power, Inc. for backup power, and sells 40 megawatts of excess power capacity to Northern States Power Company under a contract that extends to 2011.
Wabush owns a portion of the Twin Falls Hydro Generation facility that provides power for Wabush’s mining operations in Newfoundland. We have a 20-year agreement with Newfoundland Power, which continues until December 31, 2014. This agreement allows an interchange of water rights in return for the power needs for Wabush’s mining operations. The Wabush pelletizing operations in Quebec are served by Quebec Hydro on an annual contract.
Koolyanobbing and its associated satellite mines draw power from independent diesel fuelled power stations and generators. Temporary diesel power generation capacity has been installed at the Koolyanobbing operations, allowing sufficient time for a detailed investigation into the viability of long-term options such as connecting into the Western Australian South West Interconnected System or provision of natural gas or dual fuel (natural gas and diesel) generating capacity. These options are not economic for the satellite mines, which will continue being powered by diesel generators.
Electrical supply on Cockatoo Island is diesel generated. The powerhouse adjacent to the processing plant powers the shiploader, fuel farm and the processing plant. The workshop and administration office is powered by a separate generator.
Process Fuel. We have contracts providing for the transport of natural gas for our United States iron ore operations. The Empire and Tilden mines have the capability of burning natural gas, coal, or, to a lesser extent, oil. The
34
Hibbing and Northshore mines have the capability to burn natural gas and oil. The United Taconite mine has the ability to burn coal, natural gas and coke breeze. Although all of the U.S. mines have the capability of burning natural gas, with higher natural gas prices, the pelletizing operations for the U.S. mines utilize alternate fuels when practicable. Wabush Mines has the capability to burn oil and coke breeze.
Research and Development
We have been a leader in iron ore mining technology for more than 150 years. We operated some of the first mines on Michigan’s Marquette Iron Range and pioneered early open-pit and underground mining methods. From the first application of electrical power in Michigan’s underground mines to the use today of sophisticated computers and global positioning satellite systems, we have been leaders in the application of new technology to the centuries-old business of mineral extraction.
We maintain research facilities in Ishpeming, Michigan at our Cliffs Technology Center. It was at these facilities that the current concentrating and pelletizing process was developed in the 1950s. This successful development allowed for what was once considered millions of tons of useless rock to be turned into an iron ore reserve that provides the basis for our operations today. Today our engineering and technical staffs are engaged in full-time technical support of our operations and improvement of existing products.
As part of our efforts to develop alternative metallic products, we are evaluating opportunities to develop, with Kobe Steel, a commercial-scale reduced iron plant, which will convert taconite into nearly pure iron in nugget form utilizing Kobe Steel’s ITmk3 technology. This innovative technology has the potential to open new markets by offering an economically competitive supply of iron material for electric arc furnaces.
Portman does not have any material research and development projects.
Employees
As of December 31, 2006, there were a total of 4,189 employees:
| Mining Operations |
Salaried | Hourly | Total | |||
| Empire |
115 | 496 | 611 | |||
| Tilden |
117 | 585 | 702 | |||
| LS&I Railroad |
13 | 121 | 134 | |||
| Hibbing |
145 | 572 | 717 | |||
| Northshore |
154 | 358 | 512 | |||
| Wabush |
174 | 615 | 789 | |||
| United Taconite |
90 | 396 | 486 | |||
| Portman |
70 | 10 | 80 | |||
| Corporate/Support Services |
156 | 2 | 158 | |||
| Total (1) |
1,034 | 3,155 | 4,189 | |||
| (1) | Includes our employees and the employees of the North American joint venturers |
Hourly employees at our North American mining operations (other than Northshore) are represented by the USW under collective bargaining agreements. The USW advised the Company with a “Written Notification” that they initiated an organizing campaign effective April 1, 2006 at Northshore. Under the terms of our collective bargaining agreements with the USW, we are required to remain neutral during the organizing campaign. Based upon subsequent conversations with USW representatives, the organizing campaign was postponed pending resolutions of issues related to the neutrality commitment in the collective bargaining agreement. Those issues were not resolved by discussion, and the Union has filed suit in Federal District Court in Minnesota to compel arbitration of the issues. The Company has filed a charge with the National Labor Relations Board seeking its intervention in the matter to clarify its requirements and prohibit any unlawful actions by the USW. At this time, the timing of when a campaign may begin and the outcome of the campaign, when and if it proceeds, cannot be predicted. Previous efforts to organize Northshore employees have not been successful.
35
In August 2004, employees at the Empire and Tilden mines in Michigan and the Hibbing Taconite and United Taconite mines in Minnesota, represented by the USW, ratified four-year labor agreements that were comparable to other USW contracts in the industry. The agreements provided employees three separate three percent wage increases over the four-year term and for us and our partners to increase funding into pension plans and VEBAs during the term of the contracts. Accelerated funding of these plans will better secure employee retiree benefits and reduce our future years’ employment legacy cost contribution requirements. The agreements also provide that, for employees retiring on or after September 1, 2004, our share of retirees’ healthcare premiums is capped at 2008 levels for 2009 and beyond. In addition, the union agreed to certain workforce flexibility provisions and other work rule modifications to improve productivity. These agreements will expire on September 1, 2008.
On July 5, 2004, the USW initiated a strike that idled Wabush mining and concentrating facilities in Labrador, Newfoundland and pelletizing and shipping facilities in Pointe Noire, Quebec. As a result of the work stoppage, Wabush lost approximately 1.7 million tons of production (our share .5 million tons). On October 10, 2004, a five-year labor agreement was ratified by employees who are represented by the USW. The expiration of the agreement is March 1, 2009. The agreement provides for increases in wages and benefits and increased worker flexibility provisions to allow for higher productivity. Operations resumed on October 11, 2004.
Wisconsin Electric Power Company. Two of the Company’s mines, Tilden and Empire (“the Mines”), currently purchase their electric power from WEPCO pursuant to the terms of special contracts specifying prices based on WEPCO’s “actual costs”. Effective April 1, 2005, WEPCO unilaterally changed its method of calculating the energy charges to the Mines. It was the Mines’ contention that WEPCO’s new billing methodology was inconsistent with the terms of the parties’ contracts and on September 20, 2005, the Mines filed a Demand for Arbitration with the American Arbitration Association with respect to the dispute. Pursuant to the terms of the relevant contracts, disputed amounts were deposited into an interest-bearing account maintained by a bank. An interim agreement was entered into effective May 5, 2006, between WEPCO and the Mines. Under the terms of the agreement, we received a net amount of $67.5 million, representing a rebate of amounts in excess of certain contractual caps paid either to WEPCO or placed in escrow. The agreement also temporarily adjusted the billing and payment provisions of the contracts during the pendency of the arbitration, without affecting the final outcome of the dispute. As of December 31, 2006, a total of approximately $32 million remained in the escrow accounts which represents a portion of WEPCO’s 2005 and 2006 billings, plus accrued interest. On May 3, 2007, the Mines and WEPCO settled their dispute. Under the terms of the Settlement Agreement and Release (the “Settlement”), the Mines received $32.5 million from escrow and paid $9.0 million to WEPCO. Additionally, WEPCO paid the Mines a rebate for over-the-cap payments of $2.6 million. As a result of the settlement, we will recognize a $10.3 million pre-tax gain in the second quarter of 2007. In addition, under the Settlement, the Mines will be billed for electric service from April 1, 2007 at the same rate as provided in the interim agreement. Upon termination of the special contracts on December 31, 2007, the Mines will be subject to the then applicable tariffs approved by the Michigan Public Service Commission.
In anticipation of the termination of these two power supply contracts, on September 8, 2006, the Mines filed a Complaint and Application for Emergency Relief with the Michigan Public Service Commission (the “Commission”), Case No. U-15039 (the “Application”), under which the Mines requested a special transitional rate equivalent to the midpoint between the rates payable under the current power agreements and the applicable industrial tariff rate. The Mines requested that the special transitional rate be available for ten years. On September 28, 2006, prior to the Commission taking any action on the Application, WEPCO filed a rate case with the Commission, MPCS Case No. U-15071 (the “Rate Case”), which included an industrial rate that would be applicable to the Mines. Subsequently, on October 12, 2006, the Commission issued an Order Combining Dockets, under which the Mines’ Application was combined with WEPCO’s rate case. The Order Combining Dockets also established a nine-month schedule for the combined proceedings, with a final order to be issued in July 2007.
On April 30, 2007, the Mines and WEPCO entered into a Settlement Agreement for Final Rate Relief and Tariff Approvals (the “Tariff Agreement”). Under the Tariff Agreement, the Mines and WEPCO reached an
36
agreement as to the tariff rate to be charged to the Mines under the industrial tariff. Any impact from the results of the combined proceeding will not occur until 2008, when the Power Supply Contracts terminate and it is anticipated that the Mines will be on an industrial tariff.
Maritime Asbestos Litigation. As has been previously disclosed, The Cleveland-Cliffs Iron Company and/or The Cleveland-Cliffs Steamship Company have been named defendants in 485 actions brought from 1986 to date by former seamen (or their administrators) in which the plaintiffs claim damages under federal law for illnesses allegedly suffered as the result of exposure to airborne asbestos fibers while serving as crew members aboard the vessels previously owned or managed by our entities until the mid-1980s. All of these actions have been consolidated into multidistrict proceedings in the Eastern District of Pennsylvania, whose docket now includes a total of over 30,000 maritime cases filed by seamen against ship-owners and other defendants. All of these cases have been administratively dismissed without prejudice, but can be reinstated upon application by plaintiffs’ counsel. The claims against our entities are insured, subject to self-insured retentions by the insured in amounts that vary by policy year; however, the manner in which these retentions will be applied remains uncertain. Our entities continue to vigorously contest these claims and have made no settlements on these claims.
In April 2007, a lawsuit was filed naming the Company, The Cleveland-Cliffs Iron Company, The Cleveland-Cliffs Steamship Company and other subsidiaries as defendants in a maritime asbestos lawsuit brought in the Court of Common Pleas in Cuyahoga County, Ohio. The plaintiff has alleged exposure to asbestos while serving as a crew member aboard vessels previously owned or managed by our entities between 1967 and 1971. Unlike previously referenced cases, this case is not subject to the multidistrict proceedings in the Eastern District of Pennsylvania and accordingly, is not subject to the administrative dismissal applicable to actions brought in Federal Court. The claim against our entities is insured, subject to self-insurance retentions by the insured in amounts that vary by policy year; however the manner in which these retentions will be applied remains uncertain. Our entities intend to vigorously contest this claim.
Milwaukee Solvay Coke. In September 2002, we received a draft of a proposed Administrative Order by Consent from the EPA, for clean-up and reimbursement of costs associated with the Milwaukee Solvay coke plant site in Milwaukee, Wisconsin. The plant was operated by a predecessor of ours from 1973 to 1983, which predecessor we acquired in 1986. In January 2003, we completed the sale of the plant site and property to a third party. Following this sale, an Administrative Order by Consent (“Solvay Consent Order”) was entered into with the EPA by us, the new owner and another third party who had operated on the site. In connection with the Solvay Consent Order, the new owner agreed to take responsibility for the removal action and agreed to indemnify us for all costs and expenses in connection with the removal action. In the third quarter of 2003, the new owner, after completing a portion of the removal, experienced financial difficulties. In an effort to continue progress on the removal action, we expended $.9 million in the second half of 2003, $2.1 million in 2004 and $.4 million in 2005 secured by a mortgage on the property. In September 2005, we received a notice of completion from the EPA documenting that all work had been fully performed in accordance with the Solvay Consent Order.
On August 26, 2004, we received a Request for Information pursuant to Section 104(e) of CERCLA relative to the investigation of additional contamination below the ground surface at the Milwaukee Solvay site. The Request for Information was also sent to 13 other PRPs. On July 14, 2005, we received a General Notice Letter from the EPA notifying us that the EPA believes we may be liable under CERCLA and requesting that we, along with other PRPs, voluntarily perform clean-up activities at the site. We have responded to the General Notice Letter indicating that there had been no communications with other PRPs but also indicating our willingness to begin the process of negotiation with the EPA and other interested parties regarding a Consent Order. Subsequently, on July 26, 2005, we received correspondence from the EPA with a proposed Consent Order and informing us that three other PRPs had also expressed interest in negotiating with the EPA. At this time, the nature and extent of the contamination, the required remediation, the total cost of the clean-up and the cost sharing responsibilities of the PRPs cannot be determined, although the EPA advised us that it incurred $.5 million in past response costs, which the EPA will seek to recover from us and the other PRPs.
On August 25, 2006 we completed the sale of our mortgage on the site to East Greenfield Investors, LLC, a successor to Kinnickinnic Development Group LLC (“East Greenfield”). East Greenfield acquired our mortgage on the site in consideration for the assumption of all our environmental obligations with respect to the site and a
37
cash payment of $2.25 million. In addition, East Greenfield deposited $4.5 million into an escrow account to fund any remaining environmental clean-up activities on the site and to purchase insurance coverage with a $5 million limit.
Rio Tinto. The Rio Tinto Mine Site is a historic underground copper mine located near Mountain City, NV, where tailings were placed in Mill Creek, a tributary to the Owyhee River. Site investigation and remediation work is being conducted in accordance with a Consent Order between the NDEP and the RTWG composed of the Company, Atlantic Richfield Company, Teck Cominco American Incorporated, and E. I. du Pont de Nemours and Company. The Consent Order provides for technical review by the U.S. Department of the Interior Bureau of Indian Affairs, the U.S. Fish & Wildlife Service, U.S. Department of Agriculture Forest Service, the NDEP and the Shoshone-Paiute Tribes of the Duck Valley Reservation (collectively, “Rio Tinto Trustees”). The Consent Order is currently projected to continue with the objective of supporting the selection of the final remedy for the Site. Costs are shared pursuant to the terms of a Participation Agreement between the parties of the RTWG, who have reserved the right to renegotiate any future participation or cost sharing following the completion of the Consent Order.
The Rio Tinto Trustees have made available for public comment their plans for the assessment of NRD. The RTWG commented on the plans and also are in discussions with the Rio Tinto Trustees informally about those plans. The notice of plan availability is a step in the damage assessment process. The studies presented in the plan may lead to a NRD claim under CERCLA. There is no monetized NRD claim at this time.
During 2006, the focus of the RTWG was on development of alternatives for remediation of the mine site. A draft of an alternatives study was reviewed with NDEP, EPA and the Rio Tinto Trustees and as of December 31, 2006, the alternatives have essentially been reduced to two: (1) tailings stabilization and long-term water treatment; and (2) removal of the tailings. The estimated costs range from approximately $10 million to $27 million. In recognition of the potential for an NRD claim, the parties are actively pursuing a global settlement that would encompass both the remedial action and the NRD issues and thereby avoid the lengthy litigation typically associated with NRD and any such settlement would include the EPA. We increased our reserve by $4.1 million in the third quarter of 2006 to reflect our estimated costs for completing the work under the existing Consent Order and our share of the eventual remediation costs based on a consideration of the various remedial measures and related cost estimates, which are currently under review. The expense was included in Miscellaneous-net in the Statements of Consolidated Operations. During the fourth quarter of 2006, the RTWG retained a team of geochemical consultants to assist with the assessment of remediation alternatives and also initiated a mediation process to determine an equitable allocation of costs for the remediation.
KHD Humboldt Wedag International Ltd. (“KHD”). On June 20, 2006, KHD and Cade Struktur Corporation (“Cade”) submitted an Arbitration Notice, Appointment of Arbitrator and Request to Appoint Arbitrator to the participants in the Wabush Mines Joint Venture in connection with a dispute over the calculation of royalties under the terms of an Amended and Consolidation of Mining Leases dated September 2, 1959, as amended, between Wabush Iron Co. Limited and Canadian Javelin Limited (a predecessor to KHD and Cade). KHD and Cade have claimed that the Wabush Mines Joint Venture has underpaid royalties since 1991 and claim underpayments in excess of C$15 million. An arbitration panel has been selected and the participants are currently in the discovery phase of the arbitration. The participants in the Wabush Mines Joint Venture have denied the existence of any royalty underpayments and plan to defend the arbitration vigorously. The Company currently owns 26.83 percent of the Wabush Mines Joint Venture.
Deer Lake. Deer Lake is a reservoir located near Ishpeming, Michigan that historically provided water storage for the Carp River Power Plant that was razed in 1972. Elevated concentrations of mercury in Deer Lake fish were noted in 1981. Three known sources of mercury to the lake were atmospheric deposition, historic use of mercury in gold amalgamation on the west side of the lake, and releases of mercury to the City of Ishpeming sewer system, including waste assay solutions from a laboratory operated by Cliffs. The State of Michigan filed suit in 1982 alleging that we had liability for the mercury releases. A Consent Agreement was entered in 1984 that required certain remediation and mitigation, which was performed, and by 2003 mercury concentrations in fish had declined significantly. Subsequently, we engaged in negotiations with the State to comprehensively and completely resolve our liability for mercury releases. An amendment to the Consent Agreement between the Company and the State was
38
entered by the Court on November 7, 2006. The agreement provides for additional remedial measures, long-term maintenance and provisions for public access to various water bodies which we own or control. In the fourth quarter of 2006, the reserve was reduced by $1.6 million to reflect our reduced liability.
Northshore Notice of Violation. On February 10, 2006, our Northshore mine received a Notice from the EPA. The alleged violations related to the restarts of Furnaces 6, 11 and 12. Following a thorough investigation, Northshore met with the EPA, Region V, and submitted a documented response to the allegations. In December 2006, the Minnesota Pollution Control Agency (“MPCA”) advised Northshore that the EPA would not pursue any further action.
Northshore Administrative Permit Amendment. On December 16, 2006, we submitted an administrative permit amendment application to MPCA with respect to Northshore’s Title V operating permit. The proposed amendment requested the deletion of a 30 year old “control city” monitoring requirement. The MPCA denied our application on February 23, 2007. We have appealed the denial to the Minnesota Court of Appeals.
Subsequent to the filing of our appeal, the MPCA advised Northshore that the MPCA considered Northshore to be in violation of the control city standard. Subsequently, without conceding MPCA’s allegations, we entered into discussions with the MPCA with respect to the terms of a compliance schedule in which we would agree to take certain actions in settlement of the alleged violation. Discussions with the MPCA are currently ongoing. In addition, the Minnesota Center for Environmental Advocacy has since filed a motion with the Court of Appeals to intervene in our appeal of the denial of an administrative amendment to our Title V operating permit. If either our appeal is unsuccessful or if we are unable to negotiate an acceptable compliance schedule, Northshore could be subject to future enforcement actions with respect to its Title V permit if we are unable to meet the control city requirement as interpreted by MPCA.
American Steamship Litigation. One of our subsidiaries, Cliffs Sales Company, currently contracts with American Steamship Company for the transportation of iron ore pellets from various ports on the Great Lakes to a blast furnace ore dock in Cleveland, Ohio. There are ten years remaining on that contract. We filed suit against American Steamship on February 21, 2007, in the United States District Court for the Northern District of Ohio alleging breach of contract and unjust enrichment claims for damages in connection with overcharges by American Steamship for fuel adjustments under the contact. We also requested declaratory relief regarding the fuel adjustment provisions of the contract as well as with respect to American Steamship’s obligation to shuttle iron ore down the Cuyahoga River during the winter.
On May 18, 2007, American Steamship filed its own action in United States District Court for the Northern District of Ohio against Cliffs Sales and adding Northshore Mining Company and Oglebay Norton Marine Services Company, LLC, as parties. American Steamship requested declaratory relief stating that its fuel adjustment charges were proper and that it had no obligation to shuttle iron ore during the winter. American Steamship also requested damages in connection with an alleged anticipatory breach of the contract based on our objection to paying the alleged overcharges as well as declaratory relief regarding the parties’ rights and obligations regarding all agreements that govern the parties’ shipping arrangements.
To date the Company has paid and expensed the alleged overcharges to American Steamship. If the court determines that ASC is not obligated to make certain shuttle movements of iron ore during the winter, the Company will need to reach an agreement with American Steamship or another carrier to make such movements, if such movements are required for us to meet our obligations to our customer. We believe that it will be able to make such arrangements for winter shuttles, should we need to do so, and that such arrangements would not have a material impact on the Company.
Carl’s Tire Retreading Superfund Site. In July 2006 we received a Request for Information pursuant to Section 104(e) of CERCLA relating to contamination of the Carl’s Tire Retreading Superfund Site in Grawn, Grand Traverse County, Michigan resulting from a fire that began at the site in December 1995. The site was a tire recycling business to which the Tilden and Empire Mines shipped tires before the fire. In November 2006 we received a letter from the U.S. Department of Justice notifying us that the EPA is seeking about $3.1 million in response costs associated with releases of hazardous substances from the fire. EPA brought suit against PRPs that have not entered into tolling agreements with the EPA. On November 13, 2006, The Cleveland-Cliffs Iron Company signed a tolling agreement with the EPA on behalf of itself and its corporate affiliates. On April 18,
39
2007, we, along with 25 other PRPs, received a group settlement demand for approximately $2.3 million. We are currently in the process of determining how to respond to the EPA’s offer. If the matter does not settle, we (along with the other non-settling parties) would face joint and several liability if the EPA is successful in the lawsuit, meaning that we could be held responsible to the U.S. for the entire amount of any judgment.
Item 4. Submission of Matters to a Vote of Security Holders.
None.
EXECUTIVE OFFICERS OF THE REGISTRANT
| Name |
Position with Cleveland-Cliffs Inc as of May 24, 2007 |
Age | ||
| J.A. Carrabba |
Chairman, President and Chief Executive Officer | 54 | ||
| D.H. Gunning |
Vice Chairman | 64 | ||
| L. Brlas |
Senior Vice President-Chief Financial Officer and Treasurer | 49 | ||
| D.J. Gallagher |
President, North American Iron Ore | 55 | ||
| W.R. Calfee |
Executive Vice President — Commercial, North American Iron Ore | 60 | ||
| W.A. Brake Jr. |
Executive Vice President — Cliffs Metallics and Chief Technical Officer | 47 | ||
| R.L. Kummer |
Senior Vice President — Human Resources | 50 | ||
| J.A. Trethewey |
Senior Vice President — Business Development | 62 | ||
| W.C. Boor |
Senior Vice President — Business Development | 41 | ||
| G.W. Hawk, Jr. |
General Counsel and Secretary | 50 |
There is no family relationship between any of our executive officers, or between any of our executive officers and any of our Directors. Officers are elected to serve until successors have been elected. All of the above-named executive officers were elected effective on the dates listed below for each such officer.
The business experience of the persons named above for the past five years is as follows:
| J.A. Carrabba | Chairman, President and Chief Executive Officer, Cleveland-Cliffs Inc, | |
| President and Chief Executive Officer, Cleveland-Cliffs Inc, | ||
| President and Chief Operating Officer, Cleveland-Cliffs Inc, | ||
| President and Chief Operating Officer, Diavik Diamond Mines, | ||
| General Manager, Weipa Bauxite Operation, Comalco Aluminum | ||
| D.H. Gunning | Vice Chairman, Cleveland-Cliffs Inc, April 16, 2001 to date. | |
| L. Brlas | Senior Vice President-Chief Financial Officer and Treasurer, Cleveland-Cliffs Inc, | |
| Senior Vice President-Chief Financial Officer, STERIS Corporation, | ||
| D.J. Gallagher | President, North American Iron Ore, Cleveland-Cliffs Inc, | |
| President, North American Iron Ore, and Chief Financial Officer and | ||
| Executive Vice President, Chief Financial Officer and Treasurer, | ||
| Senior Vice President, Chief Financial Officer and Treasurer, | ||
| Vice President — Sales, Cleveland-Cliffs Inc, |
40
| W.R. Calfee | Executive Vice President — Commercial, North American Iron Ore, Cleveland-Cliffs Inc, | |
| Executive Vice President — Commercial, Cleveland-Cliffs Inc, | ||
| W.A. Brake Jr | Executive Vice President — Cliffs Metallics and Chief Technical Officer, Cleveland-Cliffs Inc, | |
| Executive Vice President — Operations, Mittal Steel USA, | ||
| Executive Vice President — Operations East, Mittal Steel USA, | ||
| Vice President & General Manager, International Steel Group, | ||
| Division Manager — Hot Rolling, International Steel Group, | ||
| R.L. Kummer | Senior Vice President — Human Resources, Cleveland-Cliffs Inc, | |
| Vice President — Human Resources, Cleveland-Cliffs Inc, | ||
| J.A. Trethewey | Senior Vice President — Business Development, Cleveland-Cliffs Inc, | |
| Senior Vice President — Operations Improvement, Cleveland-Cliffs Inc, | ||
| Senior Vice President — Business Development, Cleveland-Cliffs Inc, | ||
| W.C. Boor | Senior Vice President — Business Development, Cleveland-Cliffs Inc, | |
| Executive Vice President — Strategy and Development, American Gypsum Co, | ||
| Senior Vice President — Corporate Development and Investor Relations, | ||
| G.W. Hawk, Jr. | General Counsel and Secretary, Cleveland-Cliffs Inc, January 1, 2005 to date. | |
| Assistant General Counsel and Secretary, Cleveland-Cliffs Inc, | ||
| Assistant General Counsel, Cleveland-Cliffs Inc, | ||
| Deputy General Counsel, Lincoln Electric Holdings, Inc., 1998 to 2003. |
41
PART II
| Item 5. | Market for Registrant’s Common Equity, Related Stockholder Matters and Issuer Purchases of Equity Securities |
Stock Exchange Information
Our Common Shares (ticker symbol CLF) are listed on the New York Stock Exchange. The shares are also listed on the Chicago Stock Exchange.
Common Share Price Performance and Dividends
All per-share information has been adjusted retroactively to reflect the two-for-one stock splits effective June 30, 2006 and December 31, 2004.
| 2006 | 2005 | |||||||||||||||||
| High | Low | Dividends | High | Low | Dividends | |||||||||||||
| First Quarter |
$ | 55.18 | $ | 40.25 | $ | .100 | $ | 44.18 | $ | 23.40 | $ | .05 | ||||||
| Second Quarter |
50.43 | 31.39 | .125 | 37.75 | 25.57 | .05 | ||||||||||||
| Third Quarter |
40.10 | 33.16 | .125 | 44.34 | 28.43 | .10 | ||||||||||||
| Fourth Quarter |
49.47 | 36.83 | .125 | 49.63 | 35.45 | .10 | ||||||||||||
| Year |
55.18 | 31.39 | $ | .475 | 49.63 | 23.40 | $ | .30 | ||||||||||
At May 18, 2007, we had 1,193 shareholders of record.
Shareholder Return Performance
The following graph shows changes over the past five-year period in the value of $100 invested in: (1) Cliffs’ Common Shares; (2) S&P Stock Index; and (3) S&P Steel Group Index. The values of each investment are based on price change plus reinvestment of all dividends.
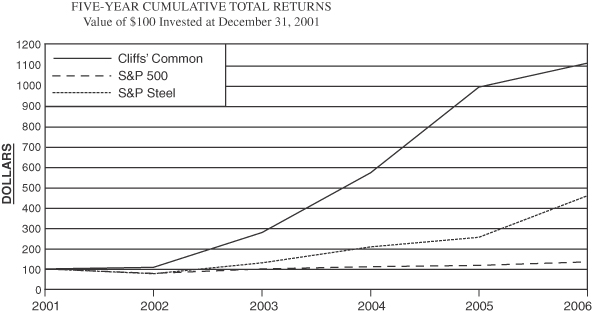
| Value at December 31 | ||||||||||||||||||
| 2001 | 2002 | 2003 | 2004 | 2005 | 2006 | |||||||||||||
| Cliffs’ Common |
$ | 100.00 | $ | 108.48 | $ | 278.57 | $ | 570.50 | $ | 989.14 | $ | 1,105.15 | ||||||
| S&P 500 |
100.00 | 77.95 | 100.31 | 111.22 | 116.68 | 135.11 | ||||||||||||
| S&P Steel |
100.00 | 76.37 | 129.51 | 207.42 | 253.90 | 457.73 | ||||||||||||
42
Unregistered Sales of Equity Securities and Use of Proceeds
On October 15, 2006, November 15, 2006, and December 15, 2006, pursuant to the Cleveland-Cliffs Inc VNQDC Plan, we sold a total of 125 shares of common stock, par value $.25 per share, of Cleveland-Cliffs Inc Common Shares for an aggregate consideration of $5,537.90 to the Trustee of the Trust maintained under the VNQDC Plan. These sales were made in reliance on Rule 506 of Regulation D under the Securities Act of 1933 pursuant to an election made by two managerial employees under the VNQDC.
Purchases of Common Shares by the Company
| Period |
(a) Total Number of |
(b) (or Unit) $ |
(c) Total Number of |
(d) Maximum Number (or Approximate Dollar Value) of Shares (or Units) that may Yet be Purchased Under the Plans or Programs | ||||||
| October 1 — 31, 2006 |
48,859 | (2) | 38.2533 | 30,000 | (3) | 1,582,700 | ||||
| November 1 — 30, 2006 |
110,000 | 43.2679 | 110,000 | 1,472,700 | ||||||
| December 1 — 31, 2006 |
180,000 | 47.0779 | 180,000 | 1,292,700 | ||||||
| Total |
338,859 | 44.5687 | 320,000 | 1,292,700 |
| (1) | On July 11, 2006, we received the approval by the Board of Directors to repurchase up to an aggregate of two million Common Shares. |
| (2) | On October 2, 2006, we acquired 18,859 shares from a retired employee in connection with a distribution from the Company’s VNQDC to satisfy tax withholding obligations. |
| (3) | The share transactions reported for October 2006 were initiated in late September and settled after October 1, 2006. |
43
Item 6. Selected Financial Data.
Summary of Financial and Other Statistical Data
Cleveland-Cliffs Inc and Consolidated Subsidiaries
| 2006 | 2005 (a) | 2004 | 2003 (e) | 2002 (e) | ||||||||||||||||
| Financial data (in millions, except per share amounts and employees) |
||||||||||||||||||||
| Operating income (loss) from continuing operations (pre-tax) |
||||||||||||||||||||
| Revenue from product sales and services |
$ | 1,921.7 | $ | 1,739.5 | $ | 1,203.1 | $ | 825.1 | $ | 586.4 | ||||||||||
| Cost of goods sold and operating expenses |
(1,507.7 | ) | (1,350.5 | ) | (1,053.6 | ) | (835.0 | ) | (582.7 | ) | ||||||||||
| Other operating income (expense) |
(48.3 | ) | (32.5 | ) | (31.9 | ) | (38.4 | ) | (65.4 | ) | ||||||||||
| Operating income (loss) |
365.7 | 356.5 | 117.6 | (48.3 | ) | (61.7 | ) | |||||||||||||
| Income (loss) from continuing operations |
279.8 | 273.2 | 320.2 | (34.9 | ) | (66.4 | ) | |||||||||||||
| Income (loss) from discontinued operations |
.3 | (.8 | ) | 3.4 | (108.5 | ) | ||||||||||||||
| Income (loss) before extraordinary gain and cumulative effect of accounting changes |
280.1 | 272.4 | 323.6 | (34.9 | ) | (174.9 | ) | |||||||||||||
| Extraordinary gain |
2.2 | |||||||||||||||||||
| Cumulative effect of accounting changes income |
5.2 | (13.4 | ) | |||||||||||||||||
| Net income (loss) |
280.1 | 277.6 | 323.6 | (32.7 | ) | (188.3 | ) | |||||||||||||
| Preferred stock dividends |
(5.6 | ) | (5.6 | ) | (5.3 | ) | ||||||||||||||
| Income (loss) applicable to common shares |
274.5 | 272.0 | 318.3 | (32.7 | ) | (188.3 | ) | |||||||||||||
| Earnings (loss) per common share — basic (c) (d) |
||||||||||||||||||||
| Continuing operations |
6.52 | 6.16 | 7.39 | (.85 | ) | (1.64 | ) | |||||||||||||
| Discontinued operations |
.01 | (.02 | ) | .08 | (2.68 | ) | ||||||||||||||
| Cumulative effect of accounting changes and extraordinary gain |
.12 | .05 | (.33 | ) | ||||||||||||||||
| Earnings (loss) per common shares |
6.53 | 6.26 | 7.47 | (.80 | ) | (4.65 | ) | |||||||||||||
| Earnings (loss) per common share — diluted (c) (d) |
||||||||||||||||||||
| Continuing operations |
5.19 | 4.92 | 5.84 | (.85 | ) | (1.64 | ) | |||||||||||||
| Discontinued operations |
.01 | (.02 | ) | .06 | (2.68 | ) | ||||||||||||||
| Cumulative effect of accounting changes and extraordinary gain |
.09 | .05 | (.33 | ) | ||||||||||||||||
| Earnings (loss) per common share — diluted (c) (d) |
5.20 | 4.99 | 5.90 | (.80 | ) | (4.65 | ) | |||||||||||||
| Total assets |
1,939.7 | 1,746.7 | 1,232.3 | 881.6 | 718.1 | |||||||||||||||
| Debt obligations effectively serviced (f) |
47.2 | 49.6 | 9.1 | 34.6 | 67.4 | |||||||||||||||
| Net cash from (used by) operating activities |
428.5 | 514.6 | (141.4 | ) | 42.7 | 40.9 | ||||||||||||||
| Redeemable cumulative convertible perpetual preferred stock |
172.3 | 172.5 | 172.5 | |||||||||||||||||
| Distributions to preferred shareholders cash dividends |
5.6 | 5.6 | 5.3 | |||||||||||||||||
| Distributions to common shareholders cash dividends |
||||||||||||||||||||
| - Per share (c) (d) |
.475 | .30 | .05 | |||||||||||||||||
| - Total |
20.2 | 13.1 | 2.2 | |||||||||||||||||
| Repurchases of common shares |
121.5 | 6.5 | ||||||||||||||||||
| North American iron ore production and sales statistics (tons in millions — North America; tonnes in millions - Australia) |
||||||||||||||||||||
| Production tons — North America |
33.6 | 35.9 | 34.4 | 30.3 | 27.9 | |||||||||||||||
| Tonnes — Australia |
7.7 | 5.2 | ||||||||||||||||||
| Company’s share of iron ore production—North America (tons) |
20.8 | 22.1 | 21.7 | 18.1 | 14.7 | |||||||||||||||
| Sales tons — North America |
20.4 | 22.3 | 22.6 | 19.2 | 14.7 | |||||||||||||||
| Tonnes — Australia |
7.4 | 4.9 | ||||||||||||||||||
| Common share outstanding (millions) (c) (d) |
||||||||||||||||||||
| - Average for year |
42.1 | 43.4 | 42.6 | 41.0 | 40.4 | |||||||||||||||
| - At year-end |
40.9 | 43.8 | 43.2 | 42.0 | 40.4 | |||||||||||||||
| Employees at year-end (g) |
4,189 | 4,085 | 3,777 | 3,956 | 3,858 | |||||||||||||||
| (a) | On April 19, 2005, we completed the acquisition of 80.4 percent of Portman, an iron ore mining company in Australia. The acquisition was initiated on March 31, 2005 by the purchase of approximately 68.7 percent of Portman’s outstanding shares. Results for 2005 include Portman’s results since the acquisition. |
| (b) | Effective January 1, 2005, we adopted EITF 04-6, “Accounting for Stripping Costs Incurred during Production in the Mining Industry”. Effective January 1, 2002, we adopted SFAS No. 143, “Accounting for Asset Retirement Obligations”. |
| (c) | On May 9, 2006, the Board of Directors of the Company approved a two-for-one stock split of its common shares. The record date for the stock split was June 15, 2006 with a distribution date of June 30, 2006. Accordingly, all |
44
| common shares and per share amounts have been adjusted retroactively to reflect the stock split. Additionally, all diluted per share amounts reflect the “as-if-converted” effect of our convertible preferred stock as required by EITF 04-8. |
| (d) | On November 9, 2004, the Board of Directors of the Company approved a two-for-one stock split of its common shares. The record date for the stock split was December 15, 2004, with a distribution date of December 31, 2004. Accordingly, all common shares and per share amounts have been adjusted retroactively to reflect the stock split. |
| (e) | In 2003, we recognized a $2.2 million extraordinary gain in the acquisition of the assets of Eveleth Mines; $3.3 million acquisition and startup costs for this same mine, renamed United Taconite and $8.7 million of restructuring charges related to a salaried employee reduction program. Results for 2002 include $95.7 million and $52.7 million for impairment charges relating to discontinued operations and impairment of mining assets, respectively. |
| (f) | Includes our share of unconsolidated ventures and equipment acquired on capital leases; includes short-term portion. |
| (g) | Includes employees of managed mining ventures. |
45
Item 7. Management’s Discussion and Analysis of Financial Condition and Results of Operations
Overview
Cleveland-Cliffs Inc is the largest producer of iron ore pellets in North America. We sell the majority of our pellets to integrated steel companies in the United States and Canada. We manage and operate six North American iron ore mines located in Michigan, Minnesota, and Eastern Canada that currently have a rated capacity of 37.0 million tons of iron ore pellet production annually, representing approximately 46 percent of the current North American pellet production capacity. The other iron ore mines in the U.S. and Canada have an aggregate rated capacity of 44.1 million tons. Based on our percentage ownership in the mines we operate, our share of the rated pellet production capacity is currently 22.9 million tons annually, representing approximately 28 percent of total North American annual pellet capacity.
On April 19, 2005, Cliffs Asia Pacific, a wholly owned subsidiary of the Company, completed the acquisition of 80.4 percent of Portman, an iron ore mining company in Australia. The acquisition was initiated on March 31, 2005, by the purchase of 68.7 percent of the outstanding shares of Portman. As a result of the acquisition, we operate in two reportable segments: the North America segment and the Australia segment, also referred to as Portman.
Portman serves the Asian iron ore markets with direct-shipping fines and lump ore from two iron ore projects, both located in Western Australia. Portman’s full-year 2006 production (excluding its .7 million tonne share of the 50 percent-owned Cockatoo Island Joint Venture) was 7.0 million tonnes. Portman completed a $62 million project to increase its wholly owned production capacity to eight million tonnes per year in the first half of 2006. The production is committed to steel companies in China and Japan through 2009.
The Portman acquisition represents a significant milestone in our long-term strategy to pursue investment and management opportunities to broaden our scope as a supplier of iron ore or other raw materials to the integrated steel industry through the acquisition of additional mining interests to strengthen our market position. We are particularly focused on expanding our international investments to capitalize on global demand for steel and iron ore.
The global mining environment is changing to meet the needs of today’s market. While this is an environment that has allowed Cliffs to reach record sales and earnings over the past several years, it also highlights challenges to our traditional business and the limited growth potential of the North American market. We have developed and are executing strategies to capitalize on the new trends, to grow the business and to deliver competitive returns to our shareholders in a changing environment for mining and iron ore.
On March 5, 2007, we acquired a 30 percent interest in MMX Amapa Mineracao LTDA., a Brazilian company developing an iron ore project (Amapa Project), through the acquisition of 100 percent of the shares of Centennial Amapa. The remaining 70 percent of the Amapa Project is owned by MMX Mineracao e Metallicos S.A., which is providing corporate and institutional support, while we will supply technical support for construction and operations. The purchase price for our 30 percent interest was $133 million, paid with cash on hand. Total capital expenditures are estimated to be $357 million, of which approximately $268 million will be funded with project debt. Capital contributions of $89.3 million were paid by Cliffs and MMX to fund the project; Cliffs 30 percent share was $26.8 million. We may be responsible for 30 percent of any additional capital contributions.
The Amapa Project consists of a significant iron ore deposit, a 192-kilometer railway connecting the mine location to an existing port facility and 71 hectares of real estate on the banks of the Amazon River, reserved for a loading terminal. The Amapa Project is currently under construction and is expected to produce 6.5 million tonnes of iron ore concentrate annually once fully operational. Iron ore concentrate is expected to be sold, pursuant to a long-term supply agreement, to an operator of an iron oxide pelletizing plant in the Kingdom of Bahrain. Production is expected to begin in late 2007.
On April 18, 2007, we completed the acquisition of an effective 45 percent interest in the Sonoma Coal Project in Queensland, Australia. As of May 3, 2007, we invested $15.6 million toward the purchase of mining tenements and $19.4 million toward the construction of a washplant. We will operate and own 100 percent of the washplant and 8.3 percent of the mining leases, resulting in a 45 percent economic interest in Sonoma.
46
The Sonoma Coal Project is expected to initially produce two million tonnes of marketable coal annually, beginning late in 2007. Production from Sonoma will include an approximately equal mix of hard coking coal and thermal coal. Plans call for annual production to increase to between three million and four million tonnes during 2008. The Sonoma Coal Project has a current resource estimate of 107 million tonnes.
We have also realigned our management roles and have created a business unit corporate structure to support our ongoing growth strategy. Under this new organizational model, each unit will be responsible for its own operational activities with shared support from our central service and corporate groups. As we continue our growth, this structure will provide the flexibility to align the organization to potential new opportunities.
In North America, we are engaged with expanding our leadership position in the industry by focusing on high product quality, technical excellence, superior relationships with our customers and partners and improved operational efficiency through cost saving initiatives. We operate a fully-equipped research and development facility in Ishpeming, Michigan. Our research and development group is staffed with experienced engineers and scientists and is organized to support the geological interpretation, process mineralogy, mine engineering, mineral processing, pyrometallurgy, advanced process control and analytical service disciplines. Our research and development group is also utilized by iron ore pellet customers for laboratory testing and simulation of blast furnace conditions.
We will continue to investigate opportunities to expand our leadership position in the North American iron ore market. We were not able to reach agreement on terms with the other participants in the Mesabi Nugget Project to move forward with the construction of a reduced iron plant. However, we are evaluating opportunities with Kobe Steel to proceed with the development of a commercial-scale reduced iron plant, which will convert taconite into nearly pure iron in nugget form utilizing Kobe Steel’s ITmk3 technology. See Strategic Investments — Mesabi Nugget Project for further information.
A consequence of the expanding industry has been significant increases in capital, supply, energy and employment costs as suppliers attempt to meet increasing demand. Rising costs could threaten our margins and limit our strategic flexibility. Our challenge is to improve performance at all of our mining operations. To minimize the threat of increasing mining costs, we have developed initiative teams to focus on business improvement, asset productivity, energy usage, alternative fuels and strategic sourcing. We have also initiated comprehensive personnel plans that will address current talent needs, meet future hiring requirements and identify specific succession plans for key management positions.
We have taken a balanced approach to allocation of our capital resources and free cash flow. We have made strategic investments both domestically and internationally, increased our capital expenditures, strengthened our balance sheet, increased funding of our employee benefit obligations, increased our common stock dividends, repurchased our common stock and increased our borrowing capacity.
Our strategic redirection and acceptance of additional risks of increased mine ownership followed by significant increases in iron ore demand and pricing culminated in record operating income in 2004, 2005 and 2006, solid financial condition, and a strong base for future growth. In the last five years, our revenues have increased over 220 percent from $.6 billion in 2002 to $1.9 billion in 2006. Our net income increased to $280 million in 2006 from a loss of $188 million in 2002.
Our operating objectives are to maximize safe production, efficiency and productivity at our mines. Unfortunately, during the year we experienced three very serious incidents resulting in fatalities. We achieved a reportable incident rate, as defined by MSHA, of 2.26 in North America. According to MSHA, the industry frequency rate for total reportable incidents for U.S. mines, mills and shops (excluding coal) was 3.35 per 200,000 employee hours worked in 2006. Our frequency rate for lost-time incidents in 2006 was 1.40 per 200,000 employee hours worked, compared with an MSHA lost-time incident rate of 2.20.
At the Koolyanobbing operation, the LTIFR for the year was 3.5, which is slightly below the Western Australian Metalliferous surface mining industry average of 3.8 incidents per million man-hours. During 2006, five LTI’s were recorded at the Koolyanobbing operation. At Cockatoo Island, two LTI’s were incurred, resulting in a LTIFR of 7.87 for the year. Portman’s safety statistics include employees and contractors.
47
Recent Accounting Pronouncements
Refer to NOTE 1 — BUSINESS SUMMARY AND SIGNIFICANT ACCOUNTING POLICIES — of the Consolidated Financial Statements for a description of recent accounting pronouncements, including the respective dates of adoption and effects on results of operations and financial condition.
Two-for-One Stock Splits
On June 30, 2006 and December 31, 2004, the Company completed two-for-one stock splits of its common shares with corresponding decreases in par value from $.50 to $.25 and from $1.00 to $.50, respectively. Accordingly, all common shares, per-share amounts, stock compensation plans and preferred stock conversion rates have been adjusted retroactively to reflect the stock splits. Additionally, all diluted per-share amounts reflect the “as-if-converted” effect of our convertible preferred stock as required by EITF 04-8, The Effect of Contingently Convertible Instruments on Diluted Earnings per Share.
Key Operating and Financial Indicators
Following is a summary of our key operating and financial indicators for the years 2006, 2005 and 2004:
| (In Millions, Except EPS) | ||||||||||
| 2006 | 2005 | 2004 | ||||||||
| North American pellet sales (tons) |
20.4 | 22.3 | 22.6 | |||||||
| Australian iron ore sales (tonnes) |
7.4 | 4.9 | ||||||||
| North American pellet production (tons) |
||||||||||
| Total |
33.6 | 35.9 | 34.4 | |||||||
| Company’s share |
20.8 | 22.1 | 21.7 | |||||||
| Australian iron ore production (tonnes) |
7.7 | 5.2 | ||||||||
| Revenues from iron ore sales and services* |
$ | 1,921.7 | $ | 1,739.5 | $ | 1,203.1 | ||||
| Operating income |
365.7 | 356.5 | 117.6 | |||||||
| Income from continuing operations |
||||||||||
| Amount |
279.8 | 273.2 | 320.2 | |||||||
| Per diluted share |
5.19 | 4.92 | 5.84 | |||||||
| Income (loss) from discontinued operations |
||||||||||
| Amount |
.3 | (.8 | ) | 3.4 | ||||||
| Per diluted share |
.01 | (.02 | ) | .06 | ||||||
| Cumulative effect of accounting change |
||||||||||
| Amount |
5.2 | |||||||||
| Per diluted share |
.09 | |||||||||
| Net income |
||||||||||
| Amount |
280.1 | 277.6 | 323.6 | |||||||
| Per diluted share |
5.20 | 4.99 | 5.90 | |||||||
| * | Includes revenues of $252.6 million, $227.3 million and $208.1 million in 2006, 2005, and 2004, respectively, related to freight and venture partners’ cost reimbursements. |
2006 Versus 2005
North American Iron Ore
Following is a summary of North American sales margin for 2006 versus 2005:
| (In Millions) | ||||||||||||||||||
| Increase (Decrease) Due To: | ||||||||||||||||||
| 2006 | 2005 | Rate | Volume | Total | ||||||||||||||
| Sales revenue* |
$ | 1,308.1 | $ | 1,307.7 | $ | 111.6 | $ | (111.2 | ) | $ | .4 | |||||||
| Cost of goods sold and operating expenses* |
980.7 | 949.1 | 112.3 | (80.7 | ) | 31.6 | ||||||||||||
| Sales margin* |
$ | 327.4 | $ | 358.6 | $ | (.7 | ) | $ | (30.5 | ) | $ | (31.2 | ) | |||||
| * | Excludes freight and venture partners’ cost reimbursements. |
48
Revenues from Iron Ore Sales and Services
Sales revenue increased $.4 million. The increase in sales revenue was due to higher sales prices, $111.6 million, partially offset by a sales volume decrease of 1.9 million tons, or $111.2 million. The 9.3 percent increase in sales prices primarily reflected the effect of contractual base price increases, higher term supply agreement escalation factors including higher steel pricing, higher PPI and lag-year adjustments, partially offset by the impact of lower international benchmark pellet prices. The price of blast furnace pellets for Eastern Canadian producers decreased 3.5 percent. Included in 2006 revenues were approximately 1.3 million tons of 2006 sales at 2005 contract prices and $21.6 million of revenue related to pricing adjustments on 2005 sales.
Cost of Goods Sold and Operating Expenses
Cost of goods sold and operating expenses increased $31.6 million or approximately three percent. The increase primarily reflected higher unit production costs of $112.3 million. Lower sales volume reduced costs $80.7 million. On a per-ton basis, cost of goods sold and operating expenses increased approximately 13 percent, primarily due to higher maintenance activity, increased energy and supply pricing, increased stripping and higher employment costs. Production costs were also impacted by an approximate $15 million cost effect related to production curtailments caused by the October 12, 2006 explosions at the United Taconite processing plant. See Production and Sales Volume for further information regarding production volumes.
Sales Margin
The sales margin decrease of $31.2 million or approximately nine percent was primarily due to higher production costs and lower sales volume, partially offset by an increase in sales prices.
Australia Iron Ore
Following is a summary of Australia sales margin for 2006 versus 2005:
| (In Millions) | |||||||||||||||
| Increase (Decrease) Due To: | |||||||||||||||
| 2006 | 2005 | Rate | Volume* | Total | |||||||||||
| Sales revenue |
$ | 361.0 | $ | 204.5 | $ | 51.5 | $ | 105.0 | $ | 156.5 | |||||
| Cost of goods sold and operating expenses |
274.4 | 174.1 | 10.9 | 89.4 | 100.3 | ||||||||||
| Sales margin |
$ | 86.6 | $ | 30.4 | $ | 40.6 | $ | 15.6 | $ | 56.2 | |||||
| * | Volume for 2005 includes Portman’s results since the March 31, 2005 acquisition. |
Revenues from Iron Ore Sales and Services
Sales revenue increased $156.5 million or approximately 77 percent. The increase in sales revenue was due to higher volume, $105.0 million and higher sales prices, $51.5 million. The 2.5 million tonne volume increase reflected the expansion of the Koolyanobbing operations in 2006 and the exclusion of sales prior to the March 31, 2005 acquisition. Portman’s sales prices include the effects of a 19 percent increase in the international benchmark price of iron ore fines and lump.
Cost of Goods Sold and Operating Expenses
Cost of goods sold and operating expenses increased $100.3 million or approximately 58 percent. The increase primarily reflected the effect of higher volume and an increase in unit production costs, primarily higher contract labor.
Sales Margin
The sales margin increase of $56.2 million was primarily due to higher sales volume and prices, partially offset by higher unit production costs.
49
Other Operating Income
The pre-tax earnings changes for 2006 versus 2005 also included:
| • | A recovery in 2005 of $12.3 million related to a five-week production curtailment at the Empire and Tilden mines in 2003 due to the loss of electric power as a result of flooding in the Upper Peninsula of Michigan. We expect to recover a portion of our deductible in the second quarter of 2007, totaling $3.0 million; |
| • | Higher administrative, selling and general expenses of $6.7 million reflecting increased outside professional services and full-year expense at Portman, partially offset by lower incentive compensation; |
| • | Higher customer bankruptcy recoveries in 2006 reflected complete recovery of our $3.9 million reserve related to WCI’s 2003 bankruptcy filing. See Customers — WCI — in PART I for further information; and, |
| • | Lower miscellaneous-net expense of $2.6 million, primarily reflecting higher mark-to-market currency gains at Portman of $5.3 million, partially offset by the $3.0 million property damage insurance deductible associated with the electrical explosions at United Taconite. |
Other Income (Expense)
| • | Lower gain on sales of assets to PolyMet. We realized an $8.4 million gain on a 2006 sale, compared with a $9.5 million gain in 2005. See PolyMet for further information; |
| • | Increased interest income of $3.3 million reflected higher average cash balances and higher interest rates; and, |
| • | Lower other-net expense of $6.7 million primarily reflected $9.8 million of currency hedging costs associated with the Portman acquisition in the first quarter of 2005, partially offset by $1.7 million of expense in 2006 related to the accelerated write-off of debt issuance costs due to the replacement of our unsecured revolving credit facility. See NOTE 6 — CREDIT FACILITIES for further information. |
Income Taxes
During 2005, an $8.9 million adjustment to reverse a valuation allowance on net operating losses attributable to pre-consolidated separate return years of one of our subsidiaries was recognized. Excluding the $8.9 million reversal in 2005, income tax expense of $90.9 million in 2006 was $2.8 million lower than the comparable amount last year. The decrease was due to a lower effective tax rate, partially offset by higher pre-tax income in 2006. See NOTE 9 — INCOME TAXES — for further information.
Minority Interest
Minority interest increased $7.0 million, or almost 70 percent from the prior year. Minority interest represents the 19.6 percent minority interest in Portman’s earnings.
Discontinued Operations
Our arrangements with Ferrominera, a government-owned company responsible for the development of Venezuela’s iron ore industry, to provide technical assistance in support of improving operations of a 3.3 million tonne per year pelletizing facility, were terminated in the third quarter of 2005. We recorded after-tax income of $.2 million related to this contract in 2006, compared with 2005 after-tax expense of $1.7 million, which included our exit costs.
On July 23, 2004, CAL, an affiliate of the Company jointly owned by a subsidiary of the Company (82.3945 percent) and Outokumpu Technology GmbH (17.6055 percent), a German company (formerly known as Lurgi Metallurgie GmbH), completed the sale of CAL’s HBI facility located in Trinidad and Tobago to Mittal Steel USA. Terms of the sale included a purchase price of $8.0 million plus assumption of liabilities. Mittal Steel USA closed this facility at the end of 2005. We recorded after-tax income of $.1 million in 2006, compared with after-tax income of $.9 million in 2005.
50
The results of discontinued operations for CAL and Ferrominera were recorded under Income (Loss) from Discontinued Operations in the Statements of Consolidated Operations.
2005 Versus 2004
North American Iron Ore
Following is a summary of North American sales margin for 2005 versus 2004:
| (In Millions) | ||||||||||||||||
| Increase (Decrease) Due To: | ||||||||||||||||
| 2005 | 2004 | Rate | Volume | Total | ||||||||||||
| Sales revenue* |
$ | 1,307.7 | $ | 995.0 | $ | 328.0 | $ | (15.3 | ) | $ | 312.7 | |||||
| Cost of goods sold and operating expenses* |
949.1 | 845.5 | 116.6 | (13.0 | ) | 103.6 | ||||||||||
| Sales margin* |
$ | 358.6 | $ | 149.5 | $ | 211.4 | $ | (2.3 | ) | $ | 209.1 | |||||
| * | Excludes freight and venture partners’ cost reimbursements. |
Revenues from Iron Ore Sales and Services
Sales revenue increased $312.7 million or approximately 31 percent. The increase in sales revenue was due to higher sales prices, $328.0 million, partially offset by a sales volume decrease of $15.3 million. The 33 percent increase in sales prices primarily reflected the effect on Cliffs’ term supply agreement price adjustment factors of an approximate 86 percent increase in international pellet pricing, higher steel pricing, higher PPI and other contractual increases, including base price increases and lag-year adjustments. Included in 2005 revenues was approximately .9 million tons of 2005 sales at 2004 contract prices and $2.4 million of price adjustments on 2004 sales.
Cost of Goods Sold and Operating Expenses
Cost of goods sold and operating expenses increased $103.6 million, or approximately 12 percent. The increase primarily reflected higher production costs of $116.6 million. Lower sales volume of .3 million tons reduced costs $13.0 million. The increase in unit production costs principally reflected higher energy pricing, increased maintenance costs, higher supply prices, and higher royalty rates due to increased pellet sales pricing.
Sales Margin
The sales margin improvement of $209.1 million in 2005 was principally due to an increase in sales price, partially offset by higher production costs and lower volume.
Australia Iron Ore
Revenues from Iron Ore Sales and Services
Sales revenue of $204.5 million on 4.9 million tonnes of Portman’s sales reflected results since the March 31, 2005 acquisition.
Cost of Goods Sold and Operating Expenses
Cost of goods sold and operating expenses of $174.1 million for the nine-month period included $38.6 million of basis adjustments to inventory and mineral rights due to the preliminary allocation of the $433.1 million purchase price.
Sales Margin
The sales margin of $30.4 million on 4.9 million tonnes of Portman’s sales reflected results since the March 31, 2005 acquisition.
51
Other Operating Income
The pre-tax earnings changes for 2005 versus 2004 also included:
| • | The previously noted business interruption insurance recovery in 2005 of $12.3 million; |
| • | Higher royalties and management fee revenue of $1.8 million, primarily reflecting higher Wabush management fees due to the approximate 86 percent increase in Eastern Canadian pellet prices; |
| • | Higher administrative, selling and general expense of $14.8 million reflecting higher stock-based compensation and the inclusion of $5.5 million of Portman’s expense since the acquisition; |
| • | Lower impairment of mining asset charges, $5.8 million. Due primarily to the significant increase in 2005 pellet pricing, we determined, based on a cash flow analysis, that our Empire mine was no longer impaired; accordingly, capital additions at Empire in 2005 were not charged to expense; |
| • | Lower provision for customer bankruptcy exposures, $3.6 million. Results for 2005 included a $1.9 million recovery from WCI. Results for 2004 included a first-quarter charge related to a subsidiary of Weirton, $1.6 million; and |
| • | Miscellaneous — net expense, $9.1 million higher than the same period in 2004. Miscellaneous-net included $5.2 million to clean a PCB spill at the Tilden mine in November 2005, and $1.9 million of expense at Portman since the acquisition. |
Other Income (Expense)
| • | Year 2004 results included a $152.7 million gain on the sale of directly-held ISG common stock; |
| • | A 2005 gain of $9.5 million on the sale of certain assets to PolyMet. See PolyMet for further information; |
| • | Increased interest income of $2.4 million reflecting higher average cash and short-term marketable securities balances and slightly higher rates; |
| • | Increased interest expense of $3.7 million included $2.0 million of interest expense at Portman since the acquisition and interim borrowings (repaid within 100 days) under Cliffs’ $350 million revolving credit facility to supplement funds required for the Portman acquisition; and |
| • | Higher other-net expense of $11.5 million primarily reflected $9.8 million of currency hedging costs associated with the Portman acquisition. |
Income Taxes
We entered 2005 with a valuation allowance to reduce a deferred tax asset related to $25.4 million of net operating losses attributable to pre-consolidation years of one of our subsidiaries. In the fourth quarter of 2005, we determined, based on the existence of sufficient evidence, that we no longer required this valuation allowance. During 2005, an $8.9 million adjustment to reverse this valuation allowance was recognized.
In the fourth quarter of 2004, we determined, based on the existence of sufficient evidence that we no longer required a previously established valuation allowance other than $8.9 million related to net operating loss carryforwards described above. During 2004, a $113.8 million adjustment to reduce the valuation allowance was recognized.
Excluding the $8.9 million and $113.8 million valuation reversals in 2005 and 2004, respectively, income tax expense of $93.7 million in 2005 was $14.9 million higher than the comparable amount in 2004. The increase was due to higher pre-tax income in 2005, partially offset by a lower effective tax rate.
Minority Interest
Minority interest was $10.1 million for 2005 and represented the 19.6 percent minority interest in Portman’s earnings.
52
Discontinued Operations
We recorded after-tax income of $.9 million related to CAL in 2005, compared with after-tax income of $3.1 million in 2004.
We recorded after-tax expense of $1.7 million related to our contract with Ferrominera in 2005, compared with after-tax income of $.3 million in 2004.
Cash Flow and Liquidity
Following is a summary of our cash flows for 2006, 2005 and 2004:
| (In Millions) | ||||||||||||
| 2006 | 2005 | 2004 | ||||||||||
| Net cash from (used by) operating activities |
$ | 428.5 | $ | 514.6 | $ | (141.4 | ) | |||||
| Capital expenditures |
(132.9 | ) | (106.3 | ) | (60.7 | ) | ||||||
| Investment in Portman (net of $24.1 million cash acquired) |
(409.0 | ) | ||||||||||
| Proceeds from sale of ISG common stock |
170.1 | |||||||||||
| Repurchases of common stock |
(121.5 | ) | ||||||||||
| Dividends on common and preferred stock |
(25.8 | ) | (18.7 | ) | (6.1 | ) | ||||||
| Proceeds from convertible preferred stock |
172.5 | |||||||||||
| Other |
10.3 | (2.5 | ) | 7.7 | ||||||||
| Increase (decrease) in cash and cash equivalents from continuing operations |
158.6 | (21.9 | ) | 142.1 | ||||||||
| Cash from (used by) discontinued operations |
.3 | (2.2 | ) | 7.0 | ||||||||
| Increase (decrease) in cash and cash equivalents |
$ | 158.9 | $ | (24.1 | ) | $ | 149.1 | |||||
Net cash from operating activities (“operating cash flows”) included $79.2 million and $68.3 million related to Portman in 2006 and 2005, respectively. The decrease in operating cash flows in 2006 compared with 2005 was primarily due to lower cash provided from changes in operating assets and liabilities. Operating cash flows in 2006 include $62.6 million relating to 1.2 million tons of pellets purchased by two customers for which revenue has been deferred until the product is delivered in 2007. Operating cash flows in 2005 included the proceeds from the sale of $182.7 million of highly liquid marketable securities used in connection with our acquisition of Portman, net of $9.9 million purchases of ARS. Operating cash flows in 2006 compared with 2005 also reflected higher cash flows resulting from higher payables and accrued expenses.
At December 31, 2006, there were 3.8 million tons of pellets in inventory at a cost of $129.5 million, ..5 million tons higher than last year, an increase of $24.2 million. The increase in pellet inventory was primarily due to lower sales volume, partially offset by lower production. See Production and Sales Volume for further information regarding North American production. At December 31, 2006, Portman had .9 million tonnes of finished product inventory at a cost of $20.8 million, .3 million tonnes higher than last year, or an increase of $7.0 million. The increase in inventory is primarily due to increased production attributable to the expansion of the Koolyanobbing operations.
Net cash from operating activities in 2006 and 2005 also reflected $95.7 million and $86.2 million of income tax payments and $64.2 million and $55.8 million of contributions to pension plans and VEBAs, respectively. In 2006, we received a $67.5 million refund from the WEPCO escrow account. See Wisconsin Electric Power Company Dispute for further information.
Capital expenditures included $39.6 million and $37.2 million related to Portman in 2006 and 2005, respectively. We anticipate that total cash used for investments and capital expenditures in 2007 will be approximately $460 million, including $240 million associated with the Amapa Project and $96 million with the Sonoma Coal Project. The Amapa Project investment is comprised of the $133 million initial investment, $26.8 million for our share of Amapa’s 2007 capital expenditures and $84 million of construction expenditures financed by project-level debt. Capital expenditures at our North American and Portman operations are estimated
53
at $123 million. Included in the 2007 capital spending estimate is $19 million related to the .8 million ton capacity expansion at the Northshore mine. We expect to fund our capital expenditures from available cash, current operations and borrowings under our credit facility.
Common stock repurchases in 2006 reflected the purchase of 3.2 million shares of 4.5 million shares authorized under two 2006 repurchase programs. Also, we increased our quarterly common share dividend to $.125 per share from $.10 per share effective on June 1, 2006 and to $.10 per share from $.05 per share effective on September 1, 2005.
Following is a summary of key liquidity measures:
| At December 31 | |||||||||||
| (In Millions) | |||||||||||
| 2006 | 2005 | 2004 | |||||||||
| Cash and cash equivalents |
$ | 351.7 | $ | 192.8 | $ | 216.9 | |||||
| Marketable securities — trading |
$ | 9.9 | $ | 182.7 | |||||||
| Debt |
$ | (6.9 | ) | $ | (7.7 | ) | |||||
| Working capital |
$ | 407.4 | $ | 273.3 | $ | 474.3 | |||||
Cash and cash equivalents included $97.6 million and $54.7 million at Portman in 2006 and 2005, respectively.
In June 2006, we entered into a five-year unsecured credit agreement with a syndicate of 16 financial institutions. The new facility provides $500 million in borrowing capacity under a revolving credit line, with no scheduled maturities other than the five-year term of the agreement; loans are made with a choice of interest rates and maturities, subject to the terms of the agreement. The new credit agreement replaced an existing $350 million unsecured revolving credit facility, which was scheduled to expire in March 2008. The current facility has financial covenants based on earnings, debt and fixed cost coverage. Interest rates are either (1) a range from LIBOR plus .75 to LIBOR plus 1.50 percent, based on debt and earnings, or (2) the prime rate. Borrowings outstanding under the credit agreement were $135 million at May 16, 2007. We were in compliance with the covenants in the credit agreement as of December 31, 2006 and March 31, 2007. Per the terms of the credit agreement, we are required to deliver annual financial statements to the lenders within 90 days of fiscal year-end. On April 18, 2007, we received a waiver extending the requirement to 180 days following fiscal year-end.
During the fourth quarter of 2006, Portman reduced its A$40 million multi-option credit facility to A$11.8 million, which represents the outstanding commitments under performance bonds. Portman entered into a new A$40 million multi-option credit facility in April 2007. Borrowings outstanding under Portman’s facility totaled A$13.3 million at March 31, 2007.
In 2005, Portman secured five-year financing from its customers in China to assist with the funding of the expansion of its Koolyanobbing mining operation. The borrowings, totaling $6.9 million at December 31, 2006, accrue interest annually at five percent. The borrowings require an approximate $.8 million principal payment plus accrued interest to be made each January 31 for the next three years with the remaining balance due in full on January 31, 2010.
54
Contractual Obligations and Off-Balance Sheet Arrangements
Other than operating leases primarily utilized for certain equipment and office space, we do not have any off-balance sheet financing. Following is a summary of our contractual obligations at December 31, 2006:
| Payments Due by Period (1) (In Millions) | |||||||||||||||
| Contractual Obligations |
Total | Less Than 1 Year |
1 - 3 Years |
3 - 5 Years |
More Than 5 Years | ||||||||||
| Long-term debt |
$ | 6.9 | $ | .8 | $ | 1.5 | $ | 4.6 | |||||||
| Capital lease obligations |
39.4 | 6.3 | 9.4 | 7.3 | $ | 16.4 | |||||||||
| Operating leases |
49.5 | 13.0 | 19.1 | 15.0 | 2.4 | ||||||||||
| Purchase obligations |
|||||||||||||||
| Open purchase orders |
142.4 | 117.9 | 24.5 | ||||||||||||
| Minimum “take or pay” purchase commitments (2) |
574.7 | 168.0 | 173.1 | 155.8 | 77.8 | ||||||||||
| Total purchase obligations |
717.1 | 285.9 | 197.6 | 155.8 | 77.8 | ||||||||||
| Other long-term liabilities |
|||||||||||||||
| Pension funding minimums |
148.0 | 35.5 | 50.7 | 30.6 | 31.2 | ||||||||||
| OPEB claim payments |
172.8 | 37.3 | 57.5 | 52.1 | 25.9 | ||||||||||
| Mine closure obligations |
104.4 | 3.5 | 19.9 | 15.8 | 65.2 | ||||||||||
| Coal industry retiree health benefits |
5.4 | .6 | 1.2 | 1.1 | 2.5 | ||||||||||
| Personal injury |
16.5 | 4.3 | 5.2 | 1.7 | 5.3 | ||||||||||
| Other (3) |
183.6 | ||||||||||||||
| Total other long-term liabilities |
630.7 | 81.2 | 134.5 | 101.3 | 130.1 | ||||||||||
| Total |
$ | 1,443.6 | $ | 387.2 | $ | 362.1 | $ | 284.0 | $ | 226.7 | |||||
| (1) | Includes our consolidated obligations and our ownership share of unconsolidated ventures’ obligations. |
| (2) | Includes minimum electric power demand charges, minimum coal and natural gas obligations, and |
minimum railroad transportation obligations.
| (3) | Primarily includes deferred income taxes payable and other contingent liabilities for which payment |
timing is non-determinable.
Production and Sales Volume
Production
Following is a summary of production tonnage for 2006, 2005 and 2004:
| Production (In Millions) | ||||||||||||
| Company Share | Total Production | |||||||||||
| Mine |
2006 | 2005 | 2004 | 2006 | 2005 | 2004 | ||||||
| North America (1) |
||||||||||||
| Empire |
3.8 | 3.8 | 4.3 | 4.9 | 4.8 | 5.4 | ||||||
| Tilden |
5.9 | 6.7 | 6.6 | 6.9 | 7.9 | 7.8 | ||||||
| Hibbing |
1.9 | 2.0 | 1.9 | 8.3 | 8.5 | 8.3 | ||||||
| Northshore |
5.1 | 4.9 | 5.0 | 5.1 | 4.9 | 5.0 | ||||||
| United Taconite |
3.0 | 3.4 | 2.9 | 4.3 | 4.9 | 4.1 | ||||||
| Wabush |
1.1 | 1.3 | 1.0 | 4.1 | 4.9 | 3.8 | ||||||
| Total |
20.8 | 22.1 | 21.7 | 33.6 | 35.9 | 34.4 | ||||||
| Australia (2) |
||||||||||||
| Koolyanobbing |
7.0 | 4.7 | ||||||||||
| Cockatoo Island |
.7 | .5 | ||||||||||
| Total |
7.7 | 5.2 | ||||||||||
| (1) | Long tons of pellets of 2,240 pounds. |
| (2) | Metric tonnes of 2,205 pounds. Totals reflect production since the March 31, 2005 acquisition. Cockatoo production reflects our 50 percent share. |
55
Production at Tilden in 2006 was lower than the previous year due to unplanned equipment repairs and a change in mix to produce more magnetite pellets to fulfill customer requirements. Magnetite pellets have lower productivity than hematite pellets.
The decrease in United Taconite production was due to the electrical explosions at the United Taconite processing plant on October 12, 2006. Production at the United Taconite plant was temporarily curtailed as a result of the loss of electrical power resulting from the explosions. Repairs to the plant’s Line 2 were completed and full production resumed in January 2007.
The decrease in Wabush production in 2006 was due to continued mining difficulties. Crude ore mining was significantly impacted by pit de-watering difficulties, which adversely impacted production and costs. Wabush successfully completed actions that increased annual pellet production to a 4.9 million ton rate by the end of 2006. Additionally, a C$1.4 million project was approved in 2006 to install a manganese reduction test circuit on one processing line in the Wabush concentrator. Successful operations of the test circuit could lead to the installation of manganese reduction on all Wabush processing lines. The capability to remove manganese from crude ore could allow the processing of ores previously classified as waste and potentially extend the life of the mine. Production at Wabush for 2007 is estimated at 4.8 million tons of pellets.
During 2004, we initiated capacity expansion projects at our United Taconite and Northshore mines in Minnesota. An idled pellet furnace at United Taconite was restarted in the fourth quarter of 2004, which added approximately 1.0 million tons (our share .7 million tons) to annual production capacity. In 2006, we reinitiated construction activity to restart an idled furnace at Northshore. The project, which will increase Northshore’s capacity by ..8 million tons, is expected to be completed in the first quarter of 2008. The furnace, idled since 1982, initially was scheduled to restart in late 2005; however the restart had been put on hold due to market conditions.
Portman’s 2005 production reflects results since the March 31, 2005 acquisition. An expansion of the Koolyanobbing facility was completed in 2006 that increased the Portman’s wholly-owned production capacity from six to eight million tonnes per annum.
Sales
Our pellet sales for the year 2006 were 20.4 million tons, compared with 22.3 million tons in 2005. The decrease in pellet sales was primarily due to lower consignment sales as a result of customers’ inventory requirements and programmed contractual changes with customers. Our sales are largely committed under term supply agreements, which are subject to changes in customer requirements.
Portman sold 7.4 million tonnes of fines and lump ore in 2006, compared with 4.9 million tonnes in 2005. The increase in fines and lump ore sales principally reflect nine months of sales in 2005 since the acquisition. Production is fully committed to steel companies in China and Japan through 2009.
Pensions and Other Postretirement Benefits
Defined benefit pension expense totaled $26.4 million and $20.7 million for 2006 and 2005, respectively. The increase in defined benefit pension expense was due primarily to a decrease in discount rates.
OPEB expense totaled $11.2 million and $17.9 million for 2006 and 2005, respectively. The decrease in OPEB expense was due to higher expected asset returns and lower loss amortization. The higher asset returns mainly reflect additional VEBA contributions agreed to under the existing labor agreement with the USW. The decrease in loss amortization is due to longer amortization periods reflecting increased remaining service lives of employees.
See Employee Retirement Benefit Obligations under Critical Accounting Policies in Item 7 and NOTE 8 — RETIREMENT RELATED BENEFITS — for further information.
Wisconsin Electric Power Company Dispute
Two of our mines, Tilden and Empire (the “Mines”), currently purchase their electric power from WEPCO pursuant to the terms of special contracts specifying prices based on WEPCO’s “actual costs”. Effective April 1,
56
2005, WEPCO unilaterally changed its method of calculating the energy charges to the Mines. It was the Mines' contention that WEPCO's new billing methodology was inconsistent with the terms of the parties' contracts and on September 20, 2005, the Mines filed a Demand for Arbitration with the American Arbitration Association with respect to the dispute. Pursuant to the terms of the relevant contracts, disputed amounts were deposited into an interest-bearing account maintained by a bank. An interim agreement was entered into effective May 5, 2006, between WEPCO and the Mines. Under the terms of the agreement, we received a net amount of $67.5 million, representing a rebate of amounts in excess of certain contractual caps paid either to WEPCO or placed in escrow. The agreement also temporarily adjusted the billing and payment provisions of the contracts during the pendency of the arbitration, without affecting the final outcome of the dispute. As of December 31, 2006, a total of approximately $32 million remained in the escrow accounts which represents a portion of WEPCO’s 2005 and 2006 billings, plus accrued interest. On May 3, 2007, the Mines and WEPCO settled their dispute. Under the terms of the Settlement Agreement and Release (the “Settlement”), the Mines received $32.5 million from escrow and paid $9.0 million to WEPCO. Additionally, WEPCO paid the Mines a rebate for over-the-cap payments of $2.6 million. As a result of the settlement, we will recognize a $10.3 million pre-tax gain in the second quarter of 2007. In addition, under the Settlement, the Mines will be billed for electric service from April 1, 2007 at the same rate as provided in the interim agreement. Upon termination of the special contracts on December 31, 2007, the Mines will be subject to the then applicable tariffs approved by the Michigan Public Service Commission.
In anticipation of the termination of these two power supply contracts, on September 8, 2006, the Mines filed a Complaint and Application for Emergency Relief with the Michigan Public Service Commission (the “Commission”), Case No. U-15039 (the “Application”), under which the Mines requested a special transitional rate equivalent to the midpoint between the rates payable under the current power agreements and the applicable industrial tariff rate. The Mines requested that the special transitional rate be available for ten years.
On September 28, 2006, prior to the Commission taking any action on the Application, WEPCO filed a rate case with the Commission, MPCS Case no. U-15071 (the “Rate Case”), which included an industrial rate that would be applicable to the Mines. Subsequently, on October 12, 2006, the Commission issued an Order Combining Dockets, under which the Mines’ Application was combined with WEPCO’s rate case. The Order Combining Dockets also established a nine-month schedule for the combined proceedings, with a final order to be issued in July 2007.
On April 30, 2007, the Mines and WEPCO entered into a Settlement Agreement for Final Rate Relief and Tariff Approvals (the “Tariff Agreement”). Under the Tariff Agreement, the Mines and WEPCO reached an agreement as to the tariff rate to be charged to the Mines under the industrial tariff. Any impact from the results of the combined proceeding will not occur until 2008, when the Power Supply Contracts terminate and it is anticipated that the Mines will be on an industrial tariff.
Environmental and Mine Closure Obligations
The iron ore industry has been identified by the EPA as an industrial category that emits pollutants established by the 1990 Clean Air Act Amendments. These pollutants included over 200 substances that are now classified as HAP. EPA is required to develop rules that would require major sources of HAP to utilize MACT standards for their emissions. Pursuant to this statutory requirement, the EPA published a final rule on October 30, 2003 imposing emission limitations and other requirements on taconite iron ore processing operations. We complied with the new requirements by the October 31, 2006 deadline. Our capital expenditures in 2006 to meet the MACT standards were $4.3 million.
At December 31, 2006, we had environmental and mine closure obligations, including our share of the obligations of ventures, of $122.2 million ($115.4 million at December 31, 2005), of which $13.6 million is current. Payments in 2006 were $15.6 million ($5.6 million in 2005). The obligations at December 31, 2006 include certain responsibilities for environmental remediation sites, $12.9 million, closure of LTVSMC, $28.2 million, and obligations for closure of our six North American operating mines, $68.3 million, and $12.8 million for Portman. See NOTE 5 — ENVIRONMENTAL AND MINE CLOSURE OBLIGATIONS — for more information.
57
Strategic Investments
We intend to continue to pursue investment and operations management opportunities to broaden our scope as a supplier of iron ore and other raw materials to the integrated steel industry through the acquisition of additional mining interests to strengthen our market position. We are particularly focused on expanding our investments to capitalize on global demand for steel, iron ore and coal. Our innovative United Taconite joint venture with Laiwu and our Portman acquisition are examples of our ability to expand geographically, and we continue to pursue similar opportunities in other regions. In the event of any future acquisitions or joint venture opportunities, we may consider using available liquidity or other sources of funding to make investments.
Sonoma Coal Project
On April 18, 2007, we completed the acquisition of an effective 45 percent interest in the Sonoma Coal Project in Queensland, Australia. As of May 3, 2007, we invested $15.6 million toward the purchase of mining tenements and $19.4 million toward the construction of a washplant. We will operate and own 100 percent of the washplant and 8.3 percent of the mining leases, resulting in a 45 percent economic interest in Sonoma.
The Sonoma Coal Project is expected to initially produce two million tonnes of marketable coal annually, beginning late in 2007. Production from Sonoma will include an approximately equal mix of hard coking coal and thermal coal. Plans call for annual production to increase to between three million and four million tonnes during 2008. The Sonoma Coal Project has a current resource estimate of 107 million tonnes.
Centennial Amapa
On March 5, 2007, we acquired a 30 percent interest in MMX Amapa Mineracao LTDA., a Brazilian company developing an iron ore project (Amapa Project), through the acquisition of 100 percent of the shares of Centennial Amapa. The remaining 70 percent of the Amapa Project is owned by MMX Mineracao e Metallicos S.A., which is providing corporate and institutional support, while we will supply technical support for construction and operations. The purchase price for our 30 percent interest was $133 million, paid with cash on hand. Total capital expenditures are estimated to be $357 million, of which approximately $268 million will be funded with project debt. Capital contributions of $89.3 million were paid by Cliffs and MMX to fund the project; Cliffs 30 percent share was $26.8 million. We may be responsible for 30 percent of any future capital contributions.
The Amapa Project consists of a significant iron ore deposit, a 192-kilometer railway connecting the mine location to an existing port facility and 71 hectares of real estate on the banks of the Amazon River, reserved for a loading terminal. The Amapa Project is currently under construction and is expected to produce 6.5 million tonnes of iron ore concentrate annually once fully operational. Iron ore concentrate is expected to be sold, pursuant to a long-term supply agreement, to an operator of an iron oxide pelletizing plant in the Kingdom of Bahrain. Production is expected to begin in late 2007.
Mesabi Nugget Project
In November 2006, we announced that the participants, principally Cliffs, Steel Dynamics and Kobe Steel, were unable to reach agreement on terms necessary to move forward with construction of a reduced iron plant. Cliffs and the other principal parties suspended efforts to jointly develop the Mesabi Nugget Project at our Cliffs Erie site in Hoyt Lakes, Minnesota. However, the Company and Kobe Steel are evaluating opportunities to proceed with development of a commercial-scale reduced iron plant, which will convert taconite into nearly pure iron in nugget form utilizing Kobe Steel’s ITmk3 technology. The high-iron-content product could be utilized to replace steel scrap as a raw material for electric steel furnaces or basic oxygen furnaces of integrated steel producers or as feedstock for the foundry industry.
Portman Acquisition
On April 19, 2005, Cliffs Asia Pacific completed the acquisition of 80.4 percent of the outstanding shares of Portman, a Western Australia-based independent iron ore mining and exploration company. The acquisition was
58
initiated on March 31, 2005 by the purchase of approximately 68.7 percent of the outstanding shares of Portman. The assets consist primarily of iron ore inventory, land, mineral rights and iron ore reserves. The purchase price of the 80.4 percent interest was $433.1 million, including $12.4 million of acquisition costs. Additionally, we incurred $9.8 million of foreign currency hedging costs related to this transaction, which were included in Other-net in the first-quarter 2005 Statements of Consolidated Operations. The acquisition increased our customer base in China and Japan and established our presence in the Australian mining industry. Portman’s full-year 2006 and 2005 production (excluding its share of the 50 percent-owned Cockatoo Island joint venture) was 7.0 million tonnes and 6.0 million tonnes, respectively. Portman completed a $62 million project that increased its wholly owned production capacity to eight million tonnes per year in the first half of 2006. The production is fully committed to steel companies in China and Japan through 2009. Portman’s reserves total approximately 88 million tonnes at December 31, 2006, and it has an active exploration program underway to increase its reserves.
The acquisition and related costs were financed with existing cash and marketable securities and $175 million of interim borrowings under a three-year $350 million revolving credit facility. The outstanding balance was repaid in full in July 2005. See NOTE 6 — CREDIT FACILITIES.
The Statements of Consolidated Financial Position of the Company as of December 31, 2006 and 2005 reflect the acquisition of Portman, effective March 31, 2005, under the purchase method of accounting. Assets acquired and liabilities assumed have been recorded at estimated fair values as of the March 31, 2005 initial acquisition date as determined by the results of an appraisal, which was finalized in the first quarter of 2006. See NOTE 2 — PORTMAN ACQUISITION — for further information regarding the final purchase price allocation.
PolyMet
On November 15, 2005, we reached an agreement with PolyMet regarding the terms for the early exercise of PolyMet’s 2004 option to acquire land, crushing and concentrating and other ancillary facilities located at our Cliffs Erie site (formerly owned by LTVSMC) and closed the sales transaction resulting in a $9.5 million pre-tax gain. PolyMet’s parent company, Polymet Mining Corporation (“PolyMet Corp”) is a non-ferrous mining company located in Vancouver, B.C. Canada. PolyMet Corp’s stock trades on the AMEX in the U.S. under the symbol PLM. Under the terms of the agreement, we received cash of $1.0 million and approximately 6.2 million common shares of PolyMet Corp, which closed that day at $1.25 per share. ($3.14 per share at December 31, 2006). The $9.5 million gain included recognition of a $.7 million deferred gain from 2004. The additional PolyMet Corp shares received in this transaction are classified as available-for-sale in Other assets on our Statements of Consolidated Financial Position. We expect to receive additional cash proceeds of $2.4 million in quarterly installments of $.25 million by and according to the terms of the contract for deed executed by the parties, which installments will be recognized as received.
In December 2006, Cliffs Erie sold to PolyMet additional owned or leased real property, various mining, railroad and service facilities and associated service permits. The sale included, but is not limited to, a 120-car rail fleet, locomotive fueling and railway maintenance buildings, railway track and rights, an administration building, pump houses, pipelines, power lines and support equipment. Proceeds from the transaction were:
| • | $1.0 million in cash; |
| • | Two million shares of the common stock of PolyMet Corp, valued at $3.09 per common share at December 20, 2006, which are valued at $3.14 at December 31, 2006; |
| • | $7.0 million in cash payable in quarterly installments of $.25 million commencing December 31, 2006, with the balance payable upon receipt of PolyMet’s commercial finance. Interest will be payable quarterly from December 31 at the Wall Street Journal Prime Rate; and |
| • | $7.0 million in cash payable in quarterly installments of $.25 million commencing on December 31, 2009, with a balloon payment of the remaining amount due December 31, 2011, plus interest on the unpaid balance from December 31, 2009, which installment will be recognized as received. |
We recognized a $7.4 million pre-tax gain in the fourth quarter of 2006 as a result of the December 2006 transaction. As a final component of the purchase price, PolyMet will assume from Cliffs certain on-going site
59
related environmental and reclamation obligations. See Mine Closure in NOTE 5 — ENVIRONMENTAL AND MINE CLOSURE OBLIGATIONS. We also recognized a $1.0 million pre-tax gain resulting from the 2006 receipt of four quarterly installments of $.25 million associated with the November 2005 PolyMet transaction. Cliffs now owns 9.2 million shares of PolyMet Corp common stock, representing 7.7 percent of issued shares. We intend to hold our shares of PolyMet Corp indefinitely. Cliffs has the right to participate in up to 7.7 percent of any future financing and PolyMet has the first right to acquire or place Cliffs shares should it choose to sell. The two million shares received in the December 2006 transaction could not be sold, transferred or traded in Canada until April 21, 2007. Sales of the unregistered shares in the United States are subject to the trading volume restrictions outlined in Rule 144 of the Securities Act of 1933. It has been determined that the shares are appropriately classified as Marketable securities on the Statements of Consolidated Financial Position and valued (marked-to-market) at the current trading price. There are no restrictions related to the 7.2 million shares previously owned.
Market Risk
We are subject to a variety of market risks, including those caused by changes in market value of equity investments, commodity prices, foreign currency exchange rates and interest rates. We have established policies and procedures to manage risks; however, certain risks are beyond our control.
Our investment policy relating to cash and cash equivalents is to preserve principal and liquidity while maximizing the return through investment of available funds. The carrying value of these investments approximates fair value on the reporting dates.
At December 31, 2005, we held investments in highly liquid auction rate securities in order to generate higher than typical money market investments. ARS typically are high credit quality, generally achieved with municipal bond insurance. Credit risks are eased by the historical track record of bond insurers, which back a majority of this market. Although rare, sell orders for any security traded through a Dutch auction process could exceed bids. Such instances are usually the result of a drastic deterioration of issuer credit quality. Should there be a failed auction, ARS holders may be unable to liquidate their positions in the securities in the near term.
The rising cost of energy is an important issue for us as it comprises approximately 25 percent of our North American production costs. Our North American mining ventures consumed approximately 15.1 million mmbtu’s of natural gas and 25.2 million gallons of diesel fuel (our share 11.0 million mmbtu’s and 15.9 million gallons of diesel fuel) in 2006. In 2006, the average price paid by the North American mining ventures was $8.32 per mmbtu for natural gas and $2.15 per gallon for diesel fuel. Recent trends indicate that electric power, natural gas and oil costs can be expected to increase over time, although the direction and magnitude of short-term changes are difficult to predict. Our strategy to address increasing energy rates includes improving efficiency in energy usage and utilizing the lowest cost alternative fuel. We also use forward purchases of natural gas and diesel fuel to stabilize fluctuations in near-term prices.
Our mining ventures enter into forward contracts for certain commodities, primarily natural gas and diesel fuel, as a hedge against price volatility. Such contracts, which are in quantities expected to be delivered and used in the production process, are a means to limit exposure to price fluctuations. At December 31, 2006, the notional amounts of the outstanding natural gas and diesel forward contracts were $80.0 million (our share — $72.5 million), with an unrecognized fair value loss of $12.6 million (our share — $11.3 million) based on December 31, 2006 forward rates. The natural gas contracts mature at various times through October 2007 and the diesel fuel contracts mature at various times through December 31, 2009. For 2007, we purchased or have forward purchase contracts for 6.3 million mmbtu’s of natural gas at an average price of $8.69 per mmbtu and 8.7 million gallons of diesel fuel at $2.07 per gallon for our North American mining ventures. If the forward rates were to change 10 percent from the year-end rate, the value and potential cash flow effect on the contracts would be approximately $6.7 million (our share — $6.1 million).
Our share of Wabush Mines operation in Canada represented approximately five percent of our North American pellet production. This operation is subject to currency exchange fluctuations between the U.S. and Canadian dollars; however, we do not hedge our exposure to this currency exchange fluctuation. Between 2003 and 2006, the value of the Canadian dollar rose against the U.S. dollar from $.64 U.S. dollar per Canadian dollar
60
at the beginning of 2003 to $.86 U.S. dollars per Canadian dollar at December 31, 2006, an increase of 34 percent. The average exchange rate increased to $.88 U.S. dollar per Canadian dollar in 2006 from an average of $.77 U.S. dollar per Canadian dollar for 2004, an increase of 14 percent.
We are subject to changes in foreign currency exchange rates in Australia as a result of our operations at Portman, which could impact our financial condition. Foreign exchange risk arises from our exposure to fluctuations in foreign currency exchange rates because our reporting currency is the United States dollar. We do not hedge our exposure to this currency exchange fluctuation. A hypothetical 10 percent movement in quoted foreign currency exchange rates could result in a fair value change of approximately $55 million in our net investment.
Portman hedges a portion of its United States currency-denominated sales in accordance with a formal policy. The primary objective for using derivative financial instruments is to reduce the earnings volatility attributable to changes in Australian and United States currency fluctuations. The instruments are subject to formal documentation, intended to achieve qualifying hedge treatment, and are tested at inception and at each reporting period as to effectiveness. Changes in fair value for highly effective hedges are recorded as a component of other comprehensive income. Ineffective portions are charged to operations. At December 31, 2006, Portman had outstanding hedges totaling A$268.2 million in the form of call options, collar options, convertible collar options and forward exchange contracts. The contracts have varying maturity dates ranging from January 2007 to June 2009, and a fair value gain based on the December 31, 2006 exchange rate of A$9.9 million. A one percent increase in rates from the month-end rate would increase the fair value and cash flow by A$1.9 million and a one percent decrease would decrease the fair value and cash flow by A$1.5 million.
Outlook
North America
Although production schedules are subject to change, all of our operations are expected to operate at or near capacity in 2007, with the exception of Hibbing. In late February 2007, Hibbing was forced to shut down production operations due to severe weather conditions that caused significant buildup of ice in the basin supplying water to the processing facility. The operation resumed limited production in late March, with full production in early April. Production loss totaled approximately .8 million tons (Company share .2 million tons). Cliffs’ total North American pellet production is expected to be approximately 35 million tons with our share approximately 22 million tons. Our 2007 North American sales volume is projected to be approximately 22 million tons.
Revenue per ton from iron ore sales and services (excluding freight and venture partners’ cost reimbursements), which is expected to increase approximately two percent per ton for full year 2007, is dependent upon several price adjustment factors included in our term sales contracts, primarily the percentage change from 2006 to 2007 in the international pellet price for blast furnace pellets, PPI and actual 2007 steel pricing for one of our customers.
Following is the estimated impact to our average North American revenue per ton from iron ore sales and services (excluding freight and venture partners’ cost reimbursements) based on 2006 realization of $64.25 per ton:
| • | The settlement of the World Pellet Price in 2007 is expected to increase our average pellet sales realization by $.63 per ton; |
| • | Each one percent change in the PPI — Industrial Commodities less fuel and PPI — Fuel and Related Products indices is anticipated to result in $.12 per ton and $.07 per ton, respectively; |
| • | Each $10 increase from $560 per ton in the average hot rolled steel price at certain steelmaking facilities will result in a $.26 per ton increase in our 2007 average realization; and |
| • | Known year-over-year increases representing a combination of contractual base price increases, lag-year adjustments and capped pricing on one contract will result in a $.92 per ton increase in our 2007 average realization. |
In March 2007, Eastern Canadian 2007 pellet prices, which are the predominant international prices affecting our North American contracts, increased 5.80 percent.
61
We are currently in a contractual dispute with Algoma over the timing of the price reopener in our 15-year term supply agreement. Algoma maintains that the price reopener is effective for 2007 sales, while our position is that the reopener is effective in 2008. We have agreed to resolve the issue through binding arbitration, which is anticipated to be completed in 2008. Resolution of this issue could adversely affect our revenues related to sales to Algoma in 2007.
North American production costs per ton are expected to increase approximately two percent from the 2006 cost of goods sold and operating expenses (excluding freight and venture partners’ cost reimbursements) of $48.17 per ton.
Australia
Portman’s estimate of 2007 production is 8.4 million tonnes, including .6 million from Cockatoo Island. Feasibility studies have concluded that mining and shipments from the current operations at Cockatoo Island can be continued until late 2007. Portman’s estimate of 2007 sales is 8.2 million tonnes, compared with 7.4 million tonnes in 2006. In December 2006, settlements between a number of the major sea-borne iron ore producers and the Chinese steel industry resulted in a 9.5 percent increase for 2007. Sales of lump and fines ore from Portman will reflect that negotiated increase, and combined with other factors, is expected to result in an approximate six percent increase on a Cliffs basis. Unit production costs are expected to increase approximately eight percent from 2006, due primarily to higher contract labor.
Critical Accounting Policies
Management’s discussion and analysis of financial condition and results of operations is based on our consolidated financial statements, which have been prepared in accordance with GAAP. Preparation of financial statements requires management to make assumptions, estimates and judgments that affect the reported amounts of assets, liabilities, revenues, costs and expenses, and the related disclosures of contingencies. Management bases its estimates on various assumptions and historical experience, which are believed to be reasonable; however, due to the inherent nature of estimates, actual results may differ significantly due to changed conditions or assumptions. On a regular basis, management reviews the accounting policies, assumptions, estimates and judgments to ensure that our financial statements are fairly presented in accordance with GAAP. However, because future events and their effects cannot be determined with certainty, actual results could differ from our assumptions and estimates, and such differences could be material. Management believes that the following critical accounting estimates and judgments have a significant impact on our financial statements.
Revenue Recognition
Revenue is recognized on the sale of products when title to the product has transferred to the customer in accordance with the specified terms of each term supply agreement and all applicable criteria for revenue recognition have been satisfied. Generally, our North American term supply agreements provide that title transfers to the customers when payment is received. In December 2006, two customers purchased and paid for 1.2 million tons of pellets in upper lakes stockpiles to meet 2006 contractual requirements. At the request of the customers, the ore was not shipped. The Company considered whether revenue should be recognized on these sales under the “bill and hold” guidance discussed in SEC Staff Accounting Bulletin No. 101 Topic No. 13, but because a fixed shipment schedule was not established prior to year-end, revenue recognition on these transactions, totaling $62.6 million, has been deferred until the product is delivered.
Most of our North American long-term supply agreements are comprised of a base price with annual price adjustment factors. These price adjustment factors vary from agreement to agreement but typically include adjustments based upon changes in international pellet prices, changes in specified Producers Price Indices including those for all commodities, industrial commodities, energy and steel. The adjustments generally operate in the same manner, with each factor typically comprising a portion of the price adjustment, although the weighting of each factor varies from agreement to agreement. One of our term supply agreements contains price collars, which typically limit the percentage increase or decrease in prices for our iron ore pellets during any one year. In most cases, these adjustment factors have not been finalized at the time our product is sold; we routinely
62
estimate these adjustment factors. The price adjustment factors have been evaluated as embedded derivatives. We evaluated the embedded derivatives in the supply agreements in accordance with the provisions of SFAS 133, Accounting for Derivative Instruments and Hedging Activities. The price adjustment factors share the same economic characteristics and risks as the host contract and are integral to the host contract as inflation adjustments; accordingly they have not been separately valued as derivative instruments. Certain supply agreements with one customer include provisions for supplemental revenue or refunds based on the customer’s annual steel pricing for the year the product is consumed in the customer’s blast furnaces. We account for this provision as derivative instruments at the time of sale and record this provision at fair value until the year the product is consumed and the amounts are settled as an adjustment to revenue.
Under some North American term supply agreements, we ship the product to ports on the Great Lakes and/or to the customer’s facilities prior to the transfer of title. Our rationale for shipping iron ore products to some customers in advance of payment for the products is to more closely relate timing of payment by customers to consumption, which also provides additional liquidity to our customers. Generally, our North American term supply agreements specify that title and risk of loss pass to the customer when payment for the pellets is received. This is a practice utilized to reduce our financial risk to customer insolvency. This practice is not believed to be widely used throughout the balance of the industry.
Revenue is recognized on services when the services are performed.
Where we are joint venture participants in the ownership of a North American mine, our contracts entitle us to receive royalties and management fees, which we earn as the pellets are produced.
Portman’s sales revenue is recognized at the F.O.B. point, which is generally when the product is loaded into the vessel. Foreign currency revenues are converted to Australian dollars at the currency exchange rate in effect at the time of the transaction.
See Accounting Policies in Item 8 for a complete discussion of our revenue recognition policy.
Litigation Accruals
We are subject to proceedings, lawsuits and other claims. We are required to assess the likelihood of any adverse judgments or outcomes to these matters as well as the potential ranges of probable losses. A determination of the amount of accrual required, if any, for these contingencies is made after careful analysis of each matter. The required accrual may change in the future due to new developments in each matter or changes in approach, such as a change in settlement strategy in dealing with these matters. We do not believe that any such matter will have a material adverse effect on our financial condition or results of operations.
Tax Contingencies
Domestic and foreign tax authorities periodically audit our income tax returns. These audits include questions regarding our tax-filing positions, including the timing and amount of deductions and allocation of income among various tax jurisdictions. At any time, multiple tax years are subject to audit by the various tax authorities. In evaluating the exposures associated with our various tax-filing positions, we record reserves for exposures on a probable basis. A number of years may elapse before a particular matter, for which we have established a reserve, is audited and fully resolved. When facts change or the actual results of a settlement with tax authorities differs from our established reserve for a matter, we adjust our tax contingencies reserve and income tax provision in the period in which the facts changed or the income tax matter is resolved.
Iron Ore Reserves
We regularly evaluate our economic iron ore reserves and update them as required in accordance with SEC Industry Guide 7. The estimated ore reserves could be affected by future industry conditions, geological conditions and ongoing mine planning. Maintenance of effective production capacity or the ore reserve could require increases in capital and development expenditures. Generally as mining operations progress, haul lengths and lifts increase. Alternatively, changes in economic conditions, or the expected quality of ore reserves could decrease capacity or ore reserves. Technological progress could alleviate such factors, or increase capacity or ore reserves.
63
We use our ore reserve estimates combined with our estimated annual production levels, to determine the mine closure dates utilized in recording the fair value liability for asset retirement obligations. See NOTE 5 — ENVIRONMENTAL AND MINE CLOSURE OBLIGATIONS — for further information. Since the liability represents the present value of the expected future obligation, a significant change in ore reserves or mine lives would have a substantial effect on the recorded obligation. We also utilize economic ore reserves for evaluating potential impairments of mine assets and in determining maximum useful lives utilized to calculate depreciation and amortization of long-lived mine assets. Decreases in ore reserves or mine lives could significantly affect these items.
Asset Retirement Obligations
The accrued mine closure obligations for our active mining operations provides for contractual and legal obligations associated with the eventual closure of the mining operations. Our obligations are determined based on detailed estimates adjusted for factors that an outside party would consider (i.e., inflation, overhead and profit), which were escalated (at an assumed three percent) to the estimated closure dates, and then discounted using a credit-adjusted risk-free interest rate of 10.25 percent (12.0 percent for United Taconite and 5.5 percent for Portman) for the initial estimates. The estimates at December 31, 2006 and 2005 were revised using incremental increases in the closure cost estimates and minor changes in estimates of mine lives. The closure date for each location was determined based on the exhaustion date of the remaining iron ore reserves. The estimated obligations are particularly sensitive to the impact of changes in mine lives given the difference between the inflation and discount rates. Changes in the base estimates of legal and contractual closure costs due to changed legal or contractual requirements, available technology, inflation, overhead or profit rates would also have a significant impact on the recorded obligations. See NOTE 6 — ENVIRONMENTAL AND MINE CLOSURE OBLIGATIONS — for further information.
Asset Impairment
We monitor conditions that indicate that the carrying value of an asset or asset group may be impaired. We determine impairment based on the asset's ability to generate cash flow greater than its carrying value, utilizing an undiscounted probability-weighted analysis. If the analysis indicates the asset is impaired, the carrying value is adjusted to fair value. Fair value can be determined by market value and also comparable sales transactions or using a discounted cash flow method. The impairment analysis and fair value determination can result in significantly different outcomes based on critical assumptions and estimates including the quantity and quality of remaining economic ore reserves, future iron ore prices and production costs.
Environmental Remediation Costs
We have a formal policy for environmental protection and restoration. Our obligations for known environmental problems at active and closed mining operations and other sites have been recognized based on estimates of the cost of investigation and remediation at each site. If the estimate can only be estimated as a range of possible amounts, with no specific amount being most likely, the minimum of the range is accrued. Management reviews its environmental remediation sites quarterly to determine if additional cost adjustments or disclosures are required. The characteristics of environmental remediation obligations, where information concerning the nature and extent of clean-up activities is not immediately available, or changes in regulatory requirements, result in a significant risk of increase to the obligations as they mature. Expected future expenditures are not discounted to present value unless the amount and timing of the cash disbursements are readily known. Potential insurance recoveries are not recognized until realized.
Employee Retirement Benefit Obligations
The Company and its mining ventures sponsor defined benefit pension plans covering substantially all North American employees. These plans are largely noncontributory, and benefits are generally based on employees’ years of service and average earnings for a defined period prior to retirement. Portman does not have employee retirement benefit obligations.
64
Additionally, the Company and its ventures provide postretirement medical and OPEBs to most full-time employees who meet certain length-of-service and age requirements. For several years prior to 2003, our pension and medical costs (including OPEB) had increased substantially. Lower interest rates, lower asset returns and continued escalation of medical costs had been the predominant causes of the increases. We have since taken actions to control pension and medical costs which have helped to maintain current pension expense levels and decrease postretirement welfare expense amounts. On July 1, 2003, we implemented changes to U.S. salaried employee plans that reduced costs by more than an estimated $8.0 million on an annualized basis. Benefits under the current defined benefit formula were frozen for affected U.S. salaried employees and a new cash balance formula was instituted. Increases in affected U.S. salaried retiree healthcare co-pays became effective for retirements after June 30, 2003. A cap on our share of annual medical premiums was also implemented for existing and future U.S. salaried retirees. Pursuant to the four-year U.S. labor agreements reached with the USW, effective August 1, 2004, OPEB expense for 2004 and the APBO decreased $4.9 million and $48.0 million, respectively, to reflect negotiated plan changes, which capped our share of future bargaining unit retirees’ healthcare premiums at 2008 levels for the years 2009 and beyond. The agreements also provide that the Company and its partners fund an estimated $220 million into bargaining unit pension plans and VEBAs during the term of the contracts.
On September 12, 2006, the Company’s Board of Directors approved modifications to the pension benefits provided to salaried participants. The modifications retroactively reinstated the final average pay benefit formula (previously terminated and replaced with a cash balance formula in July 2003) to allow for additional accruals through June 30, 2008 or the continuation of benefits under an improved cash balance formula, whichever is greater. The change increased the PBO by $15.1 million and pension expense by $1.1 million in 2006. Following is a summary of our defined benefit pension and OPEB funding and expense for the years 2004 through 2007:
| (In Millions) | ||||||||||||
| Pension | OPEB | |||||||||||
| Funding | Expense | Funding | Expense | |||||||||
| 2004 |
$ | 63.0 | $ | 23.1 | $ | 30.9 | $ | 28.5 | ||||
| 2005 |
40.6 | 20.7 | 31.8 | 17.9 | ||||||||
| 2006 |
46.2 | 26.4 | 33.1 | 11.2 | ||||||||
| 2007 (Estimated) |
39.2 | 23.3 | 23.9 | 8.2 | ||||||||
Assumptions used in determining the benefit obligations and the value of plan assets for defined benefit pension plans and postretirement benefit plans (primarily retiree healthcare benefits) offered by the Company and its unconsolidated ventures are evaluated periodically by management. Critical assumptions, such as the discount rate used to measure the benefit obligations, the expected long-term rate of return on plan assets, and the medical care cost trend are reviewed annually. At December 31, 2006, we increased our discount rate for U.S. plans to 5.75 percent from 5.50 percent at December 31, 2005, and kept our discount rate for Canadian plans at 5.00 percent, unchanged from December 31, 2005. Additionally, on December 31, 2005, we adopted the 1994 GAM table to determine the expected life of our plan participants, replacing the 1983 GAM table. Following are sensitivities on estimated 2007 pension and OPEB expense of potential further changes in these key assumptions:
| Increase in 2007 Expense (In Millions) | ||||||
| Pension | OPEB | |||||
| Decrease discount rate .25 percent |
$ | 1.9 | $ | .6 | ||
| Decrease return on assets 1 percent |
6.3 | 1.3 | ||||
| Increase medical trend rate 1 percent |
N/A | 4.2 | ||||
65
Changes in actuarial assumptions, including discount rates, employee retirement rates, mortality, compensation levels, plan asset investment performance, and healthcare costs, are selected by us. Changes in actuarial assumptions and/or investment performance of plan assets can have a significant impact on our financial condition due to the magnitude of our retirement obligations. See NOTE 8 — RETIREMENT RELATED BENEFITS — for further information.
Accounting for Business Combinations
During 2005, we completed the acquisition of 80.4 percent of Portman. We allocated the purchase price to assets acquired and liabilities assumed based on their relative fair value at the date of acquisition, pursuant to SFAS No. 141, Business Combinations. In estimating the fair value of the assets acquired and liabilities assumed, we consider information obtained during our due diligence process and utilize various valuation methods, including market prices, where available, appraisals, comparisons to transactions for similar assets and liabilities and present value of estimated future cash flows. We are required to make subjective estimates in connection with these valuations and allocations.
Forward-Looking Statements
This report contains statements that constitute “forward-looking statements.” These forward-looking statements may be identified by the use of predictive, future-tense or forward-looking terminology, such as “believes,” “anticipates,” “expects,” “estimates,” “intends,” “may,” “will” or similar terms. These statements speak only as of the date of this report, and we undertake no ongoing obligation, other than that imposed by law, to update these statements. These statements appear in a number of places in this report and include statements regarding our intent, belief or current expectations of our directors or our officers with respect to, among other things:
| • | trends affecting our financial condition, results of operations or future prospects; |
| • | uncertainty relating to contractual disputes with any of our customers; |
| • | our business and growth strategies; |
| • | uncertainties relating to our ability to identify and consummate any strategic investments; |
| • | adverse changes in currency values; |
| • | uncertainty relating to contractual disputes with any of our significant energy, material or service providers; |
| • | the success of cost-savings efforts; |
| • | our financing plans and forecasts; and |
| • | the potential existence of significant deficiencies or material weaknesses in internal controls over financial reporting that may be identified during the performance of testing under Section 404 of the Sarbanes-Oxley Act of 2002. |
You are cautioned that any such forward-looking statements are not guarantees of future performance and involve significant risks and uncertainties, and that actual results may differ materially from those contained in the forward-looking statements as a result of various factors, some of which are unknown. For additional factors affecting the business of Cleveland-Cliffs Inc, see Item 1A. Risk Factors.
You are urged to carefully consider these risk factors. All forward-looking statements attributable to us are expressly qualified in their entirety by the foregoing cautionary statements.
Item 7A. Quantitative and Qualitative Disclosures About Market Risk
Information regarding our Market Risk is presented under the caption Market Risk, which is included in Item 7 and is incorporated by reference and made a part hereof.
66
Item 8. Financial Statements and Supplementary Data
Statements of Consolidated Financial Position
Cleveland-Cliffs Inc and Consolidated Subsidiaries
| December 31 (In Millions) |
||||||||
| 2006 | 2005 | |||||||
| ASSETS |
||||||||
| CURRENT ASSETS |
||||||||
| Cash and cash equivalents |
$ | 351.7 | $ | 192.8 | ||||
| Marketable securities |
9.9 | |||||||
| Trade accounts receivable — net |
28.3 | 35.1 | ||||||
| Receivables from associated companies |
4.0 | 5.4 | ||||||
| Product inventories |
150.3 | 119.1 | ||||||
| Work in process inventories |
50.6 | 56.7 | ||||||
| Supplies and other inventories |
77.5 | 70.5 | ||||||
| Deferred and refundable taxes |
9.7 | 12.1 | ||||||
| Deferred power receivable |
15.6 | 73.0 | ||||||
| Derivative asset |
32.9 | 19.2 | ||||||
| Other |
61.7 | 42.2 | ||||||
| TOTAL CURRENT ASSETS |
782.3 | 636.0 | ||||||
| PROPERTIES |
||||||||
| Plant and equipment |
638.1 | 557.5 | ||||||
| Land rights and mineral rights |
469.2 | 421.8 | ||||||
| 1,107.3 | 979.3 | |||||||
| Allowances for depreciation and depletion |
(222.4 | ) | (176.5 | ) | ||||
| NET PROPERTIES |
884.9 | 802.8 | ||||||
| OTHER ASSETS |
||||||||
| Prepaid pensions — salaried |
2.2 | 80.4 | ||||||
| Long-term receivables |
43.7 | 48.7 | ||||||
| Deferred income taxes |
107.0 | 66.5 | ||||||
| Deposits and miscellaneous |
83.7 | 53.8 | ||||||
| Other investments |
7.0 | 34.0 | ||||||
| Intangible pension asset |
13.9 | |||||||
| Marketable securities |
28.9 | 10.6 | ||||||
| TOTAL OTHER ASSETS |
272.5 | 307.9 | ||||||
| TOTAL ASSETS |
$ | 1,939.7 | $ | 1,746.7 | ||||
See notes to consolidated financial statements.
67
Statements of Consolidated Financial Position
Cleveland-Cliffs Inc and Consolidated Subsidiaries
| December 31 (In Millions) |
||||||||
| 2006 | 2005 | |||||||
| LIABILITIES AND SHAREHOLDERS’ EQUITY |
||||||||
| CURRENT LIABILITIES |
||||||||
| Accounts payable |
$ | 139.0 | $ | 122.9 | ||||
| Accrued employment costs |
48.0 | 47.4 | ||||||
| Pensions |
45.3 | |||||||
| Other postretirement benefits |
18.3 | 36.6 | ||||||
| Income taxes |
29.1 | 29.1 | ||||||
| State and local taxes |
25.6 | 22.2 | ||||||
| Environmental and mine closure obligations |
8.8 | 13.4 | ||||||
| Accrued expenses |
28.1 | 28.9 | ||||||
| Payables to associated companies |
3.4 | 7.7 | ||||||
| Deferred revenue |
62.6 | .2 | ||||||
| Other |
12.0 | 9.0 | ||||||
| TOTAL CURRENT LIABILITIES |
374.9 | 362.7 | ||||||
| POSTEMPLOYMENT BENEFIT LIABILITIES |
||||||||
| Pensions |
140.4 | 119.6 | ||||||
| Other postretirement benefits |
139.0 | 85.2 | ||||||
| TOTAL POSTEMPLOYMENT BENEFIT LIABILITIES |
279.4 | 204.8 | ||||||
| ENVIRONMENTAL AND MINE CLOSURE OBLIGATIONS |
95.1 | 87.3 | ||||||
| DEFERRED INCOME TAXES |
117.9 | 116.7 | ||||||
| OTHER LIABILITIES |
68.5 | 79.4 | ||||||
| TOTAL LIABILITIES |
935.8 | 850.9 | ||||||
| MINORITY INTEREST |
85.8 | 71.7 | ||||||
| 3.25% REDEEMABLE CUMULATIVE CONVERTIBLE PERPETUAL PREFERRED STOCK — ISSUED 172,500 SHARES 172,300 AND 172,500 OUTSTANDING IN 2006 AND 2005 |
172.3 | 172.5 | ||||||
| SHAREHOLDERS’ EQUITY |
||||||||
| Preferred stock - no par value |
||||||||
| Class A — 3,000,000 shares authorized and unissued |
||||||||
| Class B — 4,000,000 shares authorized and unissued |
||||||||
| Common Shares — par value $.25 a share |
||||||||
| Authorized — 112,000,000 shares; |
||||||||
| Issued — 67,311,764 shares |
16.8 | 16.8 | ||||||
| Capital in excess of par value of shares |
103.2 | 100.5 | ||||||
| Retained Earnings |
1,078.5 | 824.2 | ||||||
| Cost of 26,406,414 Common Shares in treasury (2005 — 23,480,770 shares) |
(282.8 | ) | (164.3 | ) | ||||
| Accumulated other comprehensive loss |
(169.9 | ) | (125.6 | ) | ||||
| TOTAL SHAREHOLDERS’ EQUITY |
745.8 | 651.6 | ||||||
| TOTAL LIABILITIES AND SHAREHOLDERS’ EQUITY |
$ | 1,939.7 | $ | 1,746.7 | ||||
See notes to consolidated financial statements.
68
Statements of Consolidated Operations
Cleveland-Cliffs Inc and Consolidated Subsidiaries
| Year Ended December 31 (In Millions, Except Per Share |
||||||||||||
| 2006 | 2005 | 2004 | ||||||||||
| REVENUES FROM PRODUCT SALES AND SERVICES |
||||||||||||
| Iron Ore |
$ | 1,669.1 | $ | 1,512.2 | $ | 995.0 | ||||||
| Freight and venture partners’ cost reimbursements |
252.6 | 227.3 | 208.1 | |||||||||
| 1,921.7 | 1,739.5 | 1,203.1 | ||||||||||
| COST OF GOODS SOLD AND OPERATING EXPENSES |
(1,507.7 | ) | (1,350.5 | ) | (1,053.6 | ) | ||||||
| SALES MARGIN |
414.0 | 389.0 | 149.5 | |||||||||
| OTHER OPERATING INCOME (EXPENSE) |
||||||||||||
| Royalties and management fee revenue |
11.7 | 13.1 | 11.3 | |||||||||
| Casualty recoveries |
12.3 | |||||||||||
| Administrative, selling and general expenses |
(54.6 | ) | (47.9 | ) | (33.1 | ) | ||||||
| Impairment of mining assets |
(5.8 | ) | ||||||||||
| Customer bankruptcy recoveries (exposures) |
4.0 | 2.0 | (1.6 | ) | ||||||||
| Miscellaneous — net |
(9.4 | ) | (12.0 | ) | (2.7 | ) | ||||||
| (48.3 | ) | (32.5 | ) | (31.9 | ) | |||||||
| OPERATING INCOME |
365.7 | 356.5 | 117.6 | |||||||||
| OTHER INCOME (EXPENSE) |
||||||||||||
| Gain on sale of ISG common stock |
152.7 | |||||||||||
| Gain on sale of assets |
9.1 | 9.5 | ||||||||||
| Interest income |
17.2 | 13.9 | 11.5 | |||||||||
| Interest expense |
(3.6 | ) | (4.5 | ) | (.8 | ) | ||||||
| Other — net |
(.6 | ) | (7.3 | ) | 4.2 | |||||||
| 22.1 | 11.6 | 167.6 | ||||||||||
| INCOME FROM CONTINUING OPERATIONS BEFORE INCOME TAXES AND MINORITY INTEREST |
387.8 | 368.1 | 285.2 | |||||||||
| INCOME TAX CREDIT (EXPENSE) |
(90.9 | ) | (84.8 | ) | 35.0 | |||||||
| MINORITY INTEREST (net of tax $7.3 million in 2006 and $5.4 million in 2005) |
(17.1 | ) | (10.1 | ) | ||||||||
| INCOME FROM CONTINUING OPERATIONS |
279.8 | 273.2 | 320.2 | |||||||||
| INCOME (LOSS) FROM DISCONTINUED OPERATIONS |
||||||||||||
| (net of tax $.2 million in 2006, $.4 million in 2005 and $1.8 million in 2004) |
.3 | (.8 | ) | 3.4 | ||||||||
| INCOME BEFORE CUMULATIVE EFFECT OF ACCOUNTING CHANGE |
280.1 | 272.4 | 323.6 | |||||||||
| CUMULATIVE EFFECT OF ACCOUNTING CHANGE (net of tax $2.8 million) |
5.2 | |||||||||||
| NET INCOME |
280.1 | 277.6 | 323.6 | |||||||||
| PREFERRED STOCK DIVIDENDS |
(5.6 | ) | (5.6 | ) | (5.3 | ) | ||||||
| INCOME APPLICABLE TO COMMON SHARES |
$ | 274.5 | $ | 272.0 | $ | 318.3 | ||||||
| EARNINGS PER COMMON SHARE — BASIC |
||||||||||||
| Continuing operations |
$ | 6.52 | $ | 6.16 | $ | 7.39 | ||||||
| Discontinued operations |
.01 | (.02 | ) | .08 | ||||||||
| Cumulative effect of accounting changes |
.12 | |||||||||||
| EARNINGS PER COMMON SHARE — BASIC |
$ | 6.53 | $ | 6.26 | $ | 7.47 | ||||||
| EARNINGS PER COMMON SHARE — DILUTED |
||||||||||||
| Continuing operations |
$ | 5.19 | $ | 4.92 | $ | 5.84 | ||||||
| Discontinued operations |
.01 | (.02 | ) | .06 | ||||||||
| Cumulative effect of accounting changes |
.09 | |||||||||||
| EARNINGS PER COMMON SHARE — DILUTED |
$ | 5.20 | $ | 4.99 | $ | 5.90 | ||||||
| AVERAGE NUMBER OF SHARES (In thousands) |
||||||||||||
| Basic |
42,072 | 43,456 | 42,616 | |||||||||
| Diluted |
53,827 | 55,673 | 54,845 | |||||||||
See notes to consolidated financial statements.
69
Statements of Consolidated Cash Flows
Cleveland-Cliffs Inc and Consolidated Subsidiaries
| Year Ended December 31 (In Millions, Brackets Indicate Cash Decrease) |
||||||||||||
| 2006 | 2005 | 2004 | ||||||||||
| CASH FLOW FROM CONTINUING OPERATIONS |
||||||||||||
| OPERATING ACTIVITIES |
||||||||||||
| Net income |
$ | 280.1 | $ | 277.6 | $ | 323.6 | ||||||
| (Income) loss from discontinued operations |
(.3 | ) | .8 | (3.4 | ) | |||||||
| Cumulative effect of accounting change |
(5.2 | ) | ||||||||||
| Income from continuing operations |
279.8 | 273.2 | 320.2 | |||||||||
| Adjustments to reconcile net income from continuing operations to net cash from (used by) operations: |
||||||||||||
| Depreciation and amortization: |
||||||||||||
| Consolidated |
73.9 | 48.6 | 25.0 | |||||||||
| Share of associated companies |
9.4 | 4.2 | 4.3 | |||||||||
| Minority interest |
17.1 | 10.1 | ||||||||||
| Share-based compensation |
4.9 | |||||||||||
| Pensions and other postretirement benefits |
(40.3 | ) | (35.2 | ) | (48.0 | ) | ||||||
| Gain on sale of assets |
(9.9 | ) | (11.3 | ) | (4.2 | ) | ||||||
| Derivatives and currency hedges |
(8.0 | ) | 36.7 | |||||||||
| Deferred income taxes |
(4.8 | ) | (4.4 | ) | (86.7 | ) | ||||||
| Environmental and closure obligation |
(1.6 | ) | 6.0 | 4.6 | ||||||||
| Excess tax benefit from share-based compensation |
(1.2 | ) | ||||||||||
| Proceeds from business interruption insurance recovery |
12.3 | |||||||||||
| Impairment of mining assets |
5.8 | |||||||||||
| Provision for customer bankruptcy exposures |
1.6 | |||||||||||
| Gain on sale of ISG common stock |
(152.7 | ) | ||||||||||
| Casualty recoveries |
(12.3 | ) | ||||||||||
| Other |
(.2 | ) | 5.4 | 5.1 | ||||||||
| Changes in operating assets and liabilities: |
||||||||||||
| Payables and accrued expenses |
56.4 | 63.5 | 20.4 | |||||||||
| Receivables & other assets |
34.0 | 1.0 | (50.7 | ) | ||||||||
| Sales of marketable securities |
13.6 | 182.8 | ||||||||||
| Inventories and prepaid expenses |
9.1 | (56.0 | ) | (3.4 | ) | |||||||
| Purchases of marketable securities |
(3.7 | ) | (10.0 | ) | (182.7 | ) | ||||||
| Net cash from (used by) operating activities |
428.5 | 514.6 | (141.4 | ) | ||||||||
| INVESTING ACTIVITIES |
||||||||||||
| Purchase of property, plant and equipment: |
||||||||||||
| Consolidated |
(119.5 | ) | (97.8 | ) | (54.4 | ) | ||||||
| Share of associated companies |
(13.4 | ) | (8.5 | ) | (6.3 | ) | ||||||
| Proceeds from sale of assets |
5.5 | 4.4 | 4.4 | |||||||||
| Investment in Portman Limited |
(409.0 | ) | ||||||||||
| Payment of currency hedges |
(9.8 | ) | ||||||||||
| Proceeds from sale of ISG common stock |
170.1 | |||||||||||
| Proceeds from steel company debt |
10.0 | |||||||||||
| Proceeds from Weirton investment |
3.8 | |||||||||||
| Net cash from (used by) investing activities |
(127.4 | ) | (520.7 | ) | 127.6 | |||||||
| FINANCING ACTIVITIES |
||||||||||||
| Repurchases of Common Stock |
(121.5 | ) | (6.5 | ) | ||||||||
| Common Stock dividends |
(20.2 | ) | (13.1 | ) | (2.2 | ) | ||||||
| Preferred Stock dividends |
(5.6 | ) | (5.6 | ) | (3.9 | ) | ||||||
| Repayment of capital leases |
(3.1 | ) | ||||||||||
| Issuance cost — Revolving credit |
(1.0 | ) | (2.7 | ) | ||||||||
| Repayment of long-term debt |
(.8 | ) | (25.0 | ) | ||||||||
| Contributions by minority interest |
1.9 | 2.1 | 9.7 | |||||||||
| Excess tax benefit from share-based compensation |
1.2 | |||||||||||
| Proceeds from stock options exercised |
.7 | 5.7 | 17.9 | |||||||||
| Repayments under revolving credit facility |
(175.0 | ) | ||||||||||
| Borrowings under revolving credit facility |
175.0 | |||||||||||
| Proceeds from Convertible Preferred Stock |
172.5 | |||||||||||
| Issuance cost — Convertible Preferred Stock |
(6.6 | ) | ||||||||||
| Net cash from (used by) financing activities |
(148.4 | ) | (13.6 | ) | 155.9 | |||||||
| EFFECT OF EXCHANGE RATE CHANGES ON CASH |
5.9 | (2.2 | ) | |||||||||
| CASH FROM (USED BY) CONTINUING OPERATIONS |
158.6 | (21.9 | ) | 142.1 | ||||||||
| CASH FROM (USED BY) DISCONTINUED OPERATIONS — OPERATING |
.3 | (5.2 | ) | .3 | ||||||||
| — INVESTING |
3.0 | 6.7 | ||||||||||
| INCREASE (DECREASE) IN CASH AND CASH EQUIVALENTS |
158.9 | (24.1 | ) | 149.1 | ||||||||
| CASH AND CASH EQUIVALENTS AT BEGINNING OF YEAR |
192.8 | 216.9 | 67.8 | |||||||||
| CASH AND CASH EQUIVALENTS AT END OF YEAR |
$ | 351.7 | $ | 192.8 | $ | 216.9 | ||||||
| Taxes paid on income |
$ | 95.7 | $ | 86.2 | $ | 57.1 | ||||||
| Interest paid on debt obligations |
$ | 2.7 | $ | 2.0 | $ | .2 | ||||||
See notes to consolidated financial statements.
70
Statements of Consolidated Shareholders’ Equity
Cleveland-Cliffs and Consolidated Subsidiaries
| (In Millions) | ||||||||||||||||||||||
| Common Shares |
Capital in Excess of Par Value of Shares |
Retained Earnings |
Common Shares in Treasury |
Accumulated Other Compre- hensive Income (Loss) |
Total | |||||||||||||||||
| January 1, 2004 |
$ | 16.8 | $ | 72.8 | $ | 255.7 | $ | (173.6 | ) | $ | 56.4 | $ | 228.1 | |||||||||
| Comprehensive income |
||||||||||||||||||||||
| Net income |
323.6 | 323.6 | ||||||||||||||||||||
| Other comprehensive income |
||||||||||||||||||||||
| Unrealized gain on securities |
.2 | .2 | ||||||||||||||||||||
| Minimum pension liability |
7.3 | 7.3 | ||||||||||||||||||||
| Reclassification adjustment — included in net income |
(144.9 | ) | (144.9 | ) | ||||||||||||||||||
| Total comprehensive income |
186.2 | |||||||||||||||||||||
| Stock options exercised |
8.1 | 9.8 | 17.9 | |||||||||||||||||||
| Stock and other incentive plans |
11.4 | .9 | 12.3 | |||||||||||||||||||
| Issuance cost — Convertible Preferred Stock |
(6.5 | ) | (6.5 | ) | ||||||||||||||||||
| Repurchases of Common Stock |
(6.5 | ) | (6.5 | ) | ||||||||||||||||||
| Preferred Stock dividends |
(5.3 | ) | (5.3 | ) | ||||||||||||||||||
| Common Stock dividends |
(2.2 | ) | (2.2 | ) | ||||||||||||||||||
| December 31, 2004 |
16.8 | 92.3 | 565.3 | (169.4 | ) | (81.0 | ) | 424.0 | ||||||||||||||
| Comprehensive income |
||||||||||||||||||||||
| Net income |
277.6 | 277.6 | ||||||||||||||||||||
| Other comprehensive income |
||||||||||||||||||||||
| Minimum pension liability |
(19.5 | ) | (19.5 | ) | ||||||||||||||||||
| Unrealized gain on securities |
1.5 | 1.5 | ||||||||||||||||||||
| Unrealized loss on Foreign Currency Translation |
(24.7 | ) | (24.7 | ) | ||||||||||||||||||
| Hedge reserve |
(1.9 | ) | (1.9 | ) | ||||||||||||||||||
| Total comprehensive income |
233.0 | |||||||||||||||||||||
| Stock options exercised |
3.2 | 2.4 | 5.6 | |||||||||||||||||||
| Stock and other incentive plans |
5.0 | 2.7 | 7.7 | |||||||||||||||||||
| Preferred Stock dividends |
(5.6 | ) | (5.6 | ) | ||||||||||||||||||
| Common Stock dividends |
(13.1 | ) | (13.1 | ) | ||||||||||||||||||
| December 31, 2005 |
16.8 | 100.5 | 824.2 | (164.3 | ) | (125.6 | ) | 651.6 | ||||||||||||||
| Comprehensive income |
||||||||||||||||||||||
| Net income |
280.1 | 280.1 | ||||||||||||||||||||
| Other comprehensive income |
||||||||||||||||||||||
| Minimum pension and OPEB liability |
17.9 | 17.9 | ||||||||||||||||||||
| Unrealized gain on marketable securities |
7.9 | 7.9 | ||||||||||||||||||||
| Unrealized gain on Foreign Currency Translation |
34.3 | 34.3 | ||||||||||||||||||||
| Unrealized gain on derivative instruments |
6.3 | 6.3 | ||||||||||||||||||||
| Total comprehensive income |
346.5 | |||||||||||||||||||||
| Effect of implementing SFAS 158 |
(110.7 | ) | (110.7 | ) | ||||||||||||||||||
| Stock options exercised |
.3 | .4 | .7 | |||||||||||||||||||
| Stock and other incentive plans |
2.3 | 2.5 | 4.8 | |||||||||||||||||||
| Repurchases of Common Stock |
(121.5 | ) | (121.5 | ) | ||||||||||||||||||
| Conversion of Preferred Stock |
.1 | .1 | .2 | |||||||||||||||||||
| Preferred Stock dividends |
(5.6 | ) | (5.6 | ) | ||||||||||||||||||
| Common Stock dividends |
(20.2 | ) | (20.2 | ) | ||||||||||||||||||
| December 31, 2006 |
$ | 16.8 | $ | 103.2 | $ | 1,078.5 | $ | (282.8 | ) | $ | (169.9 | ) | $ | 745.8 | ||||||||
See notes to consolidated financial statements.
71
Cleveland-Cliffs Inc and Consolidated Subsidiaries
Notes to Consolidated Financial Statements
NOTE 1 — BUSINESS SUMMARY AND SIGNIFICANT ACCOUNTING POLICIES
Two-for-One Stock Splits
On June 30, 2006 and December 31, 2004, we completed two-for-one stock splits of our common shares with corresponding decreases in par value from $.50 to $.25 and from $1.00 to $.50, respectively. The record dates for the stock splits were June 15, 2006 and December 15, 2004, respectively. Accordingly, all common shares, per-share amounts, stock compensation plans and preferred stock conversion rates have been adjusted retroactively to reflect the stock splits. Additionally, all diluted per-share amounts reflect the “as-if-converted” effect of our convertible preferred stock as required by EITF 04-8, The Effect of Contingently Convertible Instruments on Diluted Earnings per Share.
Business Summary
We are the largest supplier of iron ore pellets to integrated steel companies in North America. We manage and own interests in North American mines and own ancillary companies providing transportation and other services to the mines.
On April 19, 2005, Cliffs Asia Pacific, our wholly owned subsidiary, completed the acquisition of 80.4 percent of Portman’s common stock. Portman is an iron ore mining company in Australia, serving the Asian iron ore markets with direct-shipping fines and lump ore. The acquisition was initiated on March 31, 2005 by the purchase of 68.7 percent of the outstanding shares of Portman. Our Statements of Consolidated Financial Position as of December 31, 2006 and December 31, 2005 reflect the acquisition of Portman under the purchase method of accounting. Results include revenue and expenses of Portman since the March 31, 2005 date of acquisition. See NOTE 2 — PORTMAN ACQUISITION for further discussion.
Accounting Policies
We consider the following policies to be beneficial in understanding the judgments that are involved in the preparation of our consolidated financial statements and the uncertainties that could impact our financial condition, results of operations and cash flows.
Basis of Consolidation: The consolidated financial statements include our accounts and the accounts of our majority-owned subsidiaries, including:
| Name |
Location |
Ownership Interest | |||
| Empire |
Michigan | 79.0 | % | ||
| Tilden |
Michigan | 85.0 | |||
| United Taconite |
Minnesota | 70.0 | |||
| Northshore |
Minnesota | 100.0 | |||
| Portman |
Western Australia | 80.4 | * |
| * | Consolidated since March 31, 2005 when we acquired 68.7 percent ownership. We increased our ownership to 80.4 percent on April 19, 2005. |
Intercompany accounts are eliminated in consolidation.
Other investments on the Statements of Consolidated Financial Position include our 26.83 percent equity interest in Wabush and related entities that we do not control, which are carried at the lower of cost or market. Our 23 percent equity interest in Hibbing, an unincorporated joint venture in Minnesota, was a net liability and accordingly was classified as Other liabilities. Portman’s 50 percent non-controlling interest in Cockatoo Island, which was carried in Other investments at December 31, 2005, was recorded as a net liability at December 31, 2006 and accordingly classified in Other current liabilities. CAL and Ferrominera results are included in the Statements of Consolidated Operations under Discontinued Operations. See NOTE 3 — DISCONTINUED OPERATIONS.
72
Cleveland-Cliffs Inc and Consolidated Subsidiaries
Notes to Consolidated Financial Statements — (Continued)
Investments in joint ventures in which our ownership is 50 percent or less, or in which we do not have control but have the ability to exercise significant influence over operating and financial policies, are accounted for under the equity method. Our share of equity income (if any) is eliminated against consolidated product inventory upon production, and against cost of goods sold and operating expenses when sold. This effectively reduces our cost for our share of the mining venture’s production to its cost, reflecting the cost-based nature of our participation in non-consolidated ventures.
Revenue Recognition: Revenue is recognized on the sale of products when title to the product has transferred to the customer in accordance with the specified terms of each term supply agreement and all applicable criteria for revenue recognition have been satisfied. Generally, our North American term supply agreements provide that title transfers to the customer when payment is received. Under some term supply agreements, we ship the product to ports on the lower Great Lakes and/or to the customer’s facilities prior to the transfer of title. Certain supply agreements with one customer include provisions for supplemental revenue or refunds based on the customer’s annual steel pricing for the year the product is consumed in the customer’s blast furnaces. We account for this provision as derivative instruments at the time of sale and record this provision at fair value until the year the product is consumed and the amounts are settled as an adjustment to revenue. Estimated supplemental payments (on .2 million tons), which at current pricing would have amounted to approximately $3.3 million, related to sales in 2005 to one of the customer’s indefinitely idled facilities, have not been included in revenue. Supplemental payments related to the pellets sold to this facility are due and will be recognized when the pellets have been consumed or upon other disposition. Revenue for the year from product sales includes reimbursement for freight charges ($70.4 million-2006; $70.5 million-2005; $71.7 million-2004) paid on behalf of customers and cost reimbursements ($182.2 million-2006; $156.8 million-2005; $136.4 million-2004) from venture partners for their share of mine costs.
We do not recognize revenue on North American iron ore products shipped to some customers until payment is received. Generally, our North American term supply agreements specify that title and risk of loss pass to the customer when payment for the pellets is received. This is a practice utilized to reduce our financial risk due to customer insolvency. This practice is not believed to be widely used throughout the balance of the industry.
Where we are joint venture participants in the ownership of a mine, our contracts entitle us to receive royalties and/or management fees, which we earn as the pellets are produced. Revenue is recognized on the sale of services when the services are performed.
Portman’s sales revenue is recognized at the F.O.B. point, which is generally when the product is loaded into the vessel.
Deferred Revenue: Two of our North American customers purchased and paid for a total of 1.2 million tons of pellets in December 2006 under terms of take-or-pay contracts. The inventory is stored at our facilities in upper lakes stockpiles. At the request of the customers, the ore was not shipped. The Company considered whether revenue should be recognized on these sales under the “bill and hold” guidance discussed in SEC Staff Accounting Bulletin No. 101 Topic No. 13, but because a fixed shipment schedule was not established prior to year-end, revenue recognition on these transactions, totaling $62.6 million, has been deferred until the product is delivered in 2007.
Use of Estimates: The preparation of financial statements, in conformity with GAAP, requires management to make estimates and assumptions that affect the reported amounts of assets and liabilities and disclosure of contingent assets and liabilities at the date of the financial statements and the reported amounts of revenues and expenses during the reporting period. Actual results could differ from estimates.
Cash Equivalents: We consider investments in highly liquid debt instruments with an initial maturity of three months or less at the date of purchase to be cash equivalents.
73
Cleveland-Cliffs Inc and Consolidated Subsidiaries
Notes to Consolidated Financial Statements — (Continued)
Marketable Securities: We determine the appropriate classification of debt and equity securities at the time of purchase and re-evaluate such designation as of each balance sheet date. At December 31, 2005, we had $9.9 million in highly-liquid ARS, classified as trading with changes in market value, if any, included in income, which were sold in 2006. We invested in ARS to generate higher returns than traditional money market investments. Although these securities had long-term stated contractual maturities, they were presented for redemption at auction when rates are reset which is typically every 7, 28 or 35 days. As a result, we classified these securities as current assets. We had no realized or unrealized gains or losses related to these securities during the years ended December 31, 2006 and 2005. All income, including any gains or losses related to these investments, was recorded as interest income. In accordance with our investment policy, we only invest in ARS with high credit quality issuers and limit the amount of investment exposure to any one issuer.
At December 31, 2006 and 2005, we had $28.9 million and $10.6 million, respectively, of non-current marketable securities, classified as “available for sale,” which are stated at fair value, with unrealized holding gains and losses included in Other comprehensive income. See NOTE 14 — FAIR VALUE OF FINANCIAL INSTRUMENTS for further information.
Derivative Financial Instruments: Portman, an Australian company wholly owned by Cliffs, receives funds in United States currency for its iron ore sales. Portman uses forward exchange contracts, call options, collar options and convertible collar options, designated as cash flow hedges, to hedge its foreign currency exposure for a portion of its sales receipts denominated in United States currency. United States currency is converted to Australian dollars at the currency exchange rate in effect at the time of the transaction. The primary objective for the use of these instruments is to reduce the volatility of earnings due to changes in the Australian and United States currency exchange rates, and to protect against undue adverse movement in these exchange rates. The instruments are subject to formal documentation, intended to achieve qualifying hedge treatment, and are tested at inception and at each reporting period as to effectiveness. Portman’s policy is to hedge no more than 90 percent of anticipated sales up to 12 months, no more than 30 percent of anticipated sales from 13 to 24 months and no more than 15 percent of anticipated sales from 25 to 36 months. In 2006 and 2005, $2.7 million and $9.8 million, respectively, of hedge contracts were settled and recognized as a reduction of revenues. Changes in fair value for highly effective hedges are recorded as a component of Other comprehensive income. In 2006 and 2005, ineffectiveness resulting in a $2.7 million gain and $2.6 million loss, respectively, were charged to Miscellaneous-net on the Statements of Consolidated Operations. We estimate $4.7 million of cash flow hedge contracts will be settled and reclassified into earnings in the next 12 months.
At December 31, 2006, Portman had outstanding $268.2 million in the form of call options, collar options, convertible collars and forward exchange contracts with varying maturity dates ranging from January 2007 to June 2009, and a fair value gain based on the December 31, 2006 spot rate of $9.9 million. We had $6.3 million and $.6 million of hedge contracts recorded as Derivative assets on the December 31, 2006 and 2005 Statements of Consolidated Financial Position, respectively and $3.6 million of hedge contracts recorded as long-term assets as Deposits and miscellaneous on the Statements of Consolidated Financial Position at December 31, 2006. Hedge contracts payable totaling $1.3 million were included as Other Liabilities on the December 31, 2005 Statements of Consolidated Financial Position.
Most of our North American long-term supply agreements are comprised of a base price with annual price adjustment factors. These price adjustment factors vary from agreement to agreement but typically include adjustments based upon changes in international pellet prices, changes in specified Producers Price Indices including those for all commodities, industrial commodities, energy and steel. The adjustments generally operate in the same manner, with each factor typically comprising a portion of the price adjustment, although the weighting of each factor varies from agreement to agreement. One of our term supply agreements contains price collars, which typically limit the percentage increase or decrease in prices for our iron ore pellets during any one year. In most cases, these adjustment factors have not been finalized at the time our product is sold; we routinely estimate these adjustment factors. The price adjustment factors have been evaluated as embedded derivatives. We evaluated the embedded derivatives in the supply agreements in accordance with the provisions of SFAS 133,
74
Cleveland-Cliffs Inc and Consolidated Subsidiaries
Notes to Consolidated Financial Statements — (Continued)
Accounting for Derivative Instruments and Hedging Activities. The price adjustment factors share the same economic characteristics and risks as the host contract and are integral to the host contract as inflation adjustments; accordingly they have not been separately valued as derivative instruments.
Certain supply agreements with one of our North American customers include provisions for supplemental revenue or refunds based on the customer’s annual steel pricing for the year the product is consumed in the customer’s blast furnace. The supplemental pricing is characterized as an embedded derivative instrument and is required to be accounted for separately from the base contract price. The derivative, which is finalized based on a future price, is marked to fair value as a revenue adjustment each reporting period until the year the pellets are consumed and the amounts are settled. The amounts, totaling $107.9 million, $65.9 million, and $115.7 million, were recognized as Iron Ore revenues in the Statements of Consolidated Operations, in 2006, 2005 and 2004, respectively. Derivative assets, representing the fair value of pricing factors, were $26.6 million and $18.6 million on the December 31, 2006 and December 31, 2005 Statements of Consolidated Financial Position, respectively.
In the normal course of business, we enter into forward contracts designated as normal purchases, for the purchase of commodities, primarily natural gas and diesel fuel, which are used in our North American operations. Such contracts are in quantities expected to be delivered and used in the production process and are not intended for resale or speculative purposes.
Inventories: North American product inventories are stated at the lower of cost or market. Cost of iron ore inventories is determined using the LIFO method. The excess of current cost over LIFO cost of iron ore inventories was $60.4 million and $39.9 million at December 31, 2006 and 2005, respectively. During 2005, the inventory balances declined resulting in liquidation of LIFO layers; the effect of the inventory reduction decreased Cost of goods sold and operating expenses by $.9 million in 2005. At December 31, 2006 and 2005, we had approximately .8 million tons and 1.2 million tons, respectively, stored at ports on the lower Great Lakes to service customers. We maintain ownership of the inventories until title has transferred to the customer, usually when payment is made. Maintaining iron ore products at ports on the lower Great Lakes reduces risk of non-payment by customers, as we retain title to the product until payment is received from the customer. It also assists the customers by more closely relating the timing of the customer’s payments for the product to the customer’s consumption of the products and by providing a portion of the three-month supply of inventories of iron ore the customers require during the winter when product shipments are curtailed over the Great Lakes. We track the movement of the inventory and verify the quantities on hand. Supplies and other inventories reflect the average cost method. North American finished product, work-in-process and supplies inventories as of December 31, 2006, were valued at $220.9 million, of which $129.5 million, or 59 percent (54 percent in 2005), was finished product.
At acquisition, the fair value of Portman’s iron ore inventory was determined utilizing estimated selling price less costs of realization and an appropriate margin for selling efforts and costs to complete, with the exception of lower grade stockpiles. The net realizable value was discounted to present value using a weighted average cost of capital, where appropriate. Optimal use of the lower grade stockpiles of high phosphorous ore is dependent on future production of standard ore for blending into saleable product. These stockpiles are scheduled to be utilized in the mine plan progressively over the life of the mine. Given the nature of these stockpiles and their dependence on future production, they have been assessed on the same basis as mineral rights associated with mining operations adjusted for the costs incurred to date to extract the ore and to reflect the benefits to Portman of having this ore available as an alternative to in-ground reserves. We maintain ownership of the inventories until title has transferred to the customer at the F.O.B. point, which is generally when the product is loaded into the vessel. Finished product, work-in-process and supplies inventories as of December 31, 2006, were valued at $57.5 million, of which $20.8 million, or 36 percent (26 percent in 2005), is finished product.
Deferred Power Receivable: Our Empire and Tilden mines purchase their electric power from WEPCO pursuant to the terms of special contracts. The $15.6 million balance at December 31, 2006 represents payments
75
Cleveland-Cliffs Inc and Consolidated Subsidiaries
Notes to Consolidated Financial Statements — (Continued)
into an escrow account for billings above the contractual cap in the first three months of 2006. The $73.0 million balance at December 31, 2005 were payments above the contractual cap in 2005 which were refunded in the second quarter of 2006. The escrow account was established in 2005 for the deposit of disputed billings for capped and auxiliary power.
Iron Ore Reserves: We review the iron ore reserves based on current expectations of revenues and costs, which are subject to change. Iron ore reserves include only proven and probable quantities of ore which can be economically mined and processed utilizing existing technology. Asset retirement obligations reflect remaining economic iron ore reserves.
Properties: North American properties are stated at cost. Depreciation of plant and equipment is computed principally by the straight-line method based on estimated useful lives, not to exceed the estimated economic iron ore reserves. Depreciation expense of $42.7 million, $32.7 million and $25.0 million in 2006, 2005 and 2004, respectively, was recorded on the Statements of Consolidated Operations. Depreciation is provided over the following estimated useful lives:
| Asset Class |
Life | |
| Buildings |
45 Years | |
| Mining equipment |
10 to 20 Years | |
| Processing equipment |
15 to 45 Years | |
| Information technology |
2 to 7 Years |
Depreciation is not curtailed when operations are temporarily idled.
Portman’s properties were valued under purchase accounting using the depreciated replacement cost (“DRC”) approach as the primary valuation methodology. This method was utilized as it recognizes the value of specialized equipment and improvements as part of an ongoing business. When assessing the DRC of an asset, the expected remaining useful life was determined based on the shorter of the estimated remaining life of the asset and the life of the mine. Depreciation at Portman is provided over the following estimated useful lives:
| Asset Class |
Basis |
Life | ||
| Plant and equipment |
Straight line | 5 - 13 Years | ||
| Plant and equipment and mine assets |
Production output | 12 Years | ||
| Motor vehicles, furniture & equipment |
Straight line | 3 - 5 Years |
76
Cleveland-Cliffs Inc and Consolidated Subsidiaries
Notes to Consolidated Financial Statements — (Continued)
The following table indicates the value of each of the major classes of our consolidated depreciable assets as of December 31, 2006 and 2005:
| (In Millions) December 31 |
||||||||
| 2006 | 2005 | |||||||
| Land rights and mineral rights |
$ | 469.2 | $ | 421.8 | ||||
| Office and information technology |
34.9 | 29.4 | ||||||
| Buildings |
51.1 | 32.4 | ||||||
| Mining equipment |
101.0 | 80.8 | ||||||
| Processing equipment |
214.8 | 175.8 | ||||||
| Railroad equipment |
96.4 | 75.4 | ||||||
| Electric power facilities |
30.2 | 28.9 | ||||||
| Port facilities |
42.9 | 37.4 | ||||||
| Interest capitalized during construction |
19.0 | 19.0 | ||||||
| Land improvements |
10.0 | 11.1 | ||||||
| Other |
10.5 | 5.3 | ||||||
| Construction in progress |
27.3 | 62.0 | ||||||
| 1,107.3 | 979.3 | |||||||
| Allowance for depreciation and depletion |
(222.4 | ) | (176.5 | ) | ||||
| $ | 884.9 | $ | 802.8 | |||||
Amortization of interest capitalized during construction is at the rate of approximately $2 million per year.
The costs capitalized and classified as Land rights and mineral rights on the Statements of Consolidated Financial Position represent lands where we own the surface and/or mineral rights. The value of the land rights is split between surface only, surface and minerals, and minerals only.
Portman’s interest in iron ore reserves and resources was valued using a discounted cash flow method. Fair value was estimated based upon the present value of the expected future cash flows from iron ore operations over the economic lives of the mines.
The net book value of the land rights and mineral rights is as follows:
| (In Millions) December 31 | ||||||
| 2006 | 2005 | |||||
| Land rights |
$ | 4.9 | $ | 4.8 | ||
| Mineral rights: |
||||||
| Cost |
464.3 | 417.0 | ||||
| Less depletion |
52.1 | 19.3 | ||||
| Net mineral rights |
$ | 412.2 | $ | 397.7 | ||
Accumulated depletion relating to mineral rights, which was recorded using the unit-of-production method, is included in Allowances for depreciation and depletion on the Statements of Consolidated Financial Position.
Goodwill: Based on our final purchase price allocation for our Portman acquisition, we identified $8.4 million of excess purchase price over the fair value of assets acquired. At December 31, 2006 the amount of goodwill recorded on the Statements of Consolidated Financial Position related to Portman was $8.7 million. The increase is attributable to foreign exchange rate changes. Goodwill also includes $2.1 million related to our acquisition of Northshore in 1994.
77
Cleveland-Cliffs Inc and Consolidated Subsidiaries
Notes to Consolidated Financial Statements — (Continued)
As required by SFAS No. 142, Goodwill and Other Intangible Assets (SFAS 142), goodwill related to Portman was allocated to the Australia segment and goodwill related to Northshore was allocated to the North America segment. SFAS 142 requires us to compare the fair value of the reporting unit to its carrying value on an annual basis to determine if there is potential goodwill impairment. If the fair value of the reporting unit is less than its carrying value, an impairment loss is recorded to the extent that the fair value of the goodwill within the reporting unit is less than the carrying value of its goodwill.
We evaluate goodwill for impairment in the fourth quarter each year. In addition to the annual impairment test required under SFAS 142, we assessed whether events or circumstances occurred that potentially indicate that the carrying amount of these assets may not be recoverable. We concluded that there were no such events or changes in circumstances during 2006 and 2005, and determined that the fair value of reporting units was in excess of our carrying value as of December 31, 2006 and 2005. Consequently, no goodwill impairment charges were recorded in either year.
Preferred Stock: In January 2004, we issued 172,500 shares of redeemable cumulative convertible perpetual preferred stock, without par value, issued at $1,000 per share. The preferred stock pays quarterly cash dividends at a rate of 3.25 percent per annum and can be converted into our common shares at an adjusted rate of 65.5068 common shares per share of preferred stock. The preferred stock is classified as “temporary equity” reflecting certain provisions of the agreement that could, under remote circumstances, require us to redeem the preferred stock for cash. See NOTE 10 — PREFERRED STOCK for more information.
Asset Impairment: We monitor conditions that may affect the carrying value of our long-lived and intangible assets when events and circumstances indicate that the carrying value of the assets may be impaired. We determine impairment based on the asset’s ability to generate cash flow greater than the carrying value of the asset, using an undiscounted probability-weighted analysis. If projected undiscounted cash flows are less than the carrying value of the asset, the asset is adjusted to its fair value.
Repairs and Maintenance: The cost of major power plant overhauls is amortized over the estimated useful life, which is the period until the next scheduled overhaul, generally five years. All other planned and unplanned repairs and maintenance costs are expensed when incurred.
Insurance Recoveries: Potential insurance recoveries can relate to property damage, business interruption (including profit recovery) and expenditures to mitigate loss. We account for insurance recoveries under the guidelines established by SFAS No. 5, Accounting for Contingencies (SFAS 5) and EITF 01-10 which indicate that the proceeds from property damage insurance claims are to be recognized only when realization of the claim is probable and only to the extent of loss recoveries. Insurance recoveries that result in a gain, and proceeds from business interruption insurance are recognized when realized in Other operating income (expense) in the Statements of Consolidated Operations.
Pensions and other postretirement benefits: Cliffs and its unconsolidated ventures offer defined benefit pension plans, defined contribution pension plans and other postretirement benefit plans, primarily consisting of retiree healthcare benefits, to most employees in North America as part of a total compensation and benefits program. Portman does not have employee retirement benefit obligations.
Under the provisions of SFAS 158 (effective December 31, 2006), we recognized the funded status of our postretirement benefit obligations on our December 31, 2006 Statement of Consolidated Financial Position based on the market value of plan assets and the actuarial present value of our retirement obligations on that date. On a plan-by-plan basis, we determine if the plan assets exceed the benefit obligations or vice-versa. If the plan assets exceed the retirement obligations, the amount of the surplus is recorded as an asset; if the retirement obligations exceed the plan assets, the amount of the underfunded obligations are recorded as a liability. Year-end balance sheet adjustments to postretirement assets and obligations are charged to other comprehensive income.
78
Cleveland-Cliffs Inc and Consolidated Subsidiaries
Notes to Consolidated Financial Statements — (Continued)
The market value of plan assets is measured at the year-end balance sheet date. The PBO is determined based upon an actuarial estimate of the present value of pension benefits to be paid to current employees and retirees. The APBO represents an actuarial estimate of the present value of OPEB benefits to be paid to current employees and retirees.
The actuarial estimates of the PBO and/or APBO retirement obligations incorporate various assumptions including the discount rates, the rates of increases in compensation, healthcare cost trend rates, mortality, retirement timing and employee turnover. The discount rate is determined based on the prevailing year-end rates for high-grade corporate bonds with a duration matching the expected cash flow timing of the benefit payments from the various plans. The remaining assumptions are based on our estimate of future events incorporating historical trends and future expectations.
The amount of net periodic cost that is recorded in the Consolidated Statements of Operations consists of several components including service cost, interest cost, expected return on plan assets, and amortization of previously unrecognized amounts. Service cost represents the value of the benefits earned in the current year by the participants. Interest cost represents the cost associated with the passage of time. In addition, the net periodic cost is affected by the anticipated income from the return on invested assets, as well as the income or expense resulting from the recognition of previously deferred items. Certain items, such as plan amendments, gains and/or losses resulting from differences between actual and assumed results for demographic and economic factors affecting the obligations and assets of the plans, and changes in plan assumptions are subject to deferred recognition for income and expense purposes. The expected return on plan assets is determined utilizing the weighted average of expected returns for plan asset investments in various asset categories based on historical performance, adjusted for current trends. See NOTE 8 — RETIREMENT RELATED BENEFITS — for further information.
Income Taxes: Income taxes are based on income (loss) for financial reporting purposes and reflect a current tax liability (asset) for the estimated taxes payable (recoverable) for all open tax years and changes in deferred taxes. In evaluating any exposures associated with our various tax filing positions, we record liabilities for exposures on a probable basis. Deferred tax assets or liabilities are determined based on differences between financial reporting and tax bases of assets and liabilities and are measured using enacted tax laws and rates. A valuation allowance is provided on deferred tax assets if it is determined that it is more likely than not that the asset will not be realized. See NOTE 9 — INCOME TAXES.
Environmental Remediation Costs: We have a formal policy for environmental protection and restoration. Our mining and exploration activities are subject to various laws and regulations governing protection of the environment. We conduct our operations to protect the public health and environment and believe our operations are in compliance with applicable laws and regulations in all material respects. Our environmental liabilities, including obligations for known environmental remediation exposures at active and closed mining operations and other sites, have been recognized based on the estimated cost of investigation and remediation at each site. If the cost can only be estimated as a range of possible amounts with no specific amount being most likely, the minimum of the range is accrued in accordance with SFAS 5. Future expenditures are not discounted unless the amount and timing of the cash disbursements are readily known. Additional environmental obligations could be incurred, the extent of which cannot be assessed. Potential insurance recoveries have not been reflected in the determination of the liabilities. See NOTE 5 — ENVIRONMENTAL AND MINE CLOSURE OBLIGATIONS.
Share-Based Compensation: Effective January 1, 2006, we adopted the fair value recognition provisions of SFAS No. 123R, Share-Based Payment (SFAS 123R) using the modified prospective transition method. Because we elected to use the modified prospective transition method, results for prior periods have not been restated. Under this transition method, share-based compensation expense for 2006 included compensation expense for all share-based compensation awards granted prior to January 1, 2006 based on the grant date estimated fair value, which are being amortized on a straight-line basis over the remaining service periods of the awards.
79
Cleveland-Cliffs Inc and Consolidated Subsidiaries
Notes to Consolidated Financial Statements — (Continued)
Effective January 1, 2006, we made a one-time election to adopt the transition method described in FSP No. FAS 123(R)-3, Transition Election Related to Accounting for the Tax Effects of Share-Based Payment Awards. This election resulted in the reclassification of excess tax benefits as presented in the Statements of Consolidated Cash Flows, from operating activities to financing activities.
Prior to the adoption of SFAS 123R, we recognized share-based compensation expense in accordance with SFAS No. 123, Accounting for Stock-Based Compensation (SFAS 123). As prescribed in SFAS No. 148, Accounting for Stock-Based Compensation — Transition and Disclosure (SFAS 148), we elected to use the prospective method. The prospective method required expense to be recognized for all awards granted, modified or settled beginning in the year of adoption. In accordance with SFAS 123 and SFAS 148, we provided pro forma net income or loss and net income or loss per share disclosures for each period as if we had applied the fair value recognition provisions to all awards unvested in each period.
In March 2005, the SEC issued SAB 107, which provided supplemental implementation guidance for SFAS 123R. We have applied the provisions of SAB 107 in our adoption of SFAS 123R. See NOTE 11 — STOCK PLANS for information on the impact of our adoption of SFAS 123R and the assumptions we used to calculate the fair value of share-based compensation.
Research and Development Costs: Research and development costs, primarily relating to the Mesabi Nugget project at the Northshore mine in Minnesota and international projects located in Australia and Brazil, are expensed as incurred. Business development costs of $5.6 million, $3.2 million and $1.2 million in 2006, 2005 and 2004, respectively, were included in Miscellaneous — net. Mine development costs, primarily stripping and development drilling, are included in the cost of production as incurred.
Earnings Per Share: We present both basic and diluted EPS amounts. Basic EPS are calculated by dividing net income by the weighted average number of common shares outstanding during the period presented. Diluted EPS are calculated by dividing net income by the weighted average number of common shares, common share equivalents and convertible preferred stock outstanding during the period, utilizing the treasury share method for employee stock plans. Common share equivalents are excluded from EPS computations in the periods in which they have an anti-dilutive effect. See NOTE 15 — EARNINGS PER SHARE.
New Accounting Standards:
In February 2007, FASB issued Statement No. 159, The Fair Value Option for Financial Assets and Liabilities Including an Amendment of FASB Statement No. 115, (SFAS 159). This Statement permits entities to choose to measure many financial instruments and certain other items at fair value that are not currently required to be measured at fair value. The Statement also establishes presentation and disclosure requirements designed to facilitate comparisons between entities that choose different measurement attributes for similar types of assets and liabilities. The Statement is effective as of the beginning of an entity’s first fiscal year that begins after November 15, 2007. Early adoption is permitted. We are evaluating the impact, if any, of the adoption of this standard on our consolidated financial statements.
On September 29, 2006, FASB issued Statement No. 158, Employers’ Accounting for Defined Benefit Pension and Other Postretirement Plans — an amendment of FASB Statements No. 87, 88, 106, and 132(R) (SFAS 158). SFAS 158 requires an entity to recognize on its balance sheet the funded status of its defined benefit postretirement plans, measured as the difference between the fair value of the plan assets and the benefit obligation. Changes in the funded status of a defined benefit postretirement plan will now be recognized, net of tax, in comprehensive income, effective for fiscal years ending after December 15, 2006. SFAS 158 also requires an employer to measure the funded status of its plans as of the date of its year-end balance sheet, effective for fiscal years ending after December 15, 2008. We have adopted the requirements of SFAS 158 in December 2006. The effect on our consolidated financial statements is shown in NOTE 8 — RETIREMENT RELATED BENEFITS.
80
Cleveland-Cliffs Inc and Consolidated Subsidiaries
Notes to Consolidated Financial Statements — (Continued)
In September 2006, FASB issued FSP No. AUG AIR-1, Accounting for Planned Major Maintenance Activities, which prohibits the use of the accrue-in-advance method of accounting for planned major maintenance activities in annual and interim periods. This FSP is effective for fiscal years beginning after December 15, 2006. Retrospective application is required unless it is impracticable. We have evaluated the provisions of this Staff Position and have determined that adoption of this standard is not expected to have a material impact on our consolidated financial statements.
In September 2006, the SEC issued SAB No. 108, Considering the Effects of Prior Year Misstatements when Quantifying Misstatements in Current Year Financial Statements (SAB 108), to address diversity in practice in quantifying financial statement misstatements. SAB 108 requires that we quantify misstatements based on their impact on each of our financial statements and related disclosures and is effective for fiscal years ending after November 15, 2006. A one-time transitional cumulative effect adjustment to retained earnings as of January 1, 2006 is allowed for errors that were not previously deemed material, but are material under the guidance in SAB 108. The adoption of SAB No. 108 in the fourth quarter of 2006 did not impact our consolidated financial statements.
In September 2006, FASB issued Statement No. 157, Accounting for Fair Value Measurements (SFAS 157). SFAS 157 clarifies the principle that fair value should be based on the assumptions market participants would use when pricing an asset or liability and establishes a fair value hierarchy that prioritizes the information used to develop those assumptions. Under the standard, fair value measurements would be separately disclosed by level within the fair value hierarchy. SFAS 157 is effective for financial statements issued for fiscal years beginning after November 15, 2007 and interim periods within those fiscal years, with early adoption permitted. We do not expect adoption of this Statement to have a material impact on our consolidated financial statements.
In June 2006, FASB issued Interpretation No. 48, Accounting for Uncertainty in Income Taxes — an interpretation of FASB Statement No. 109 (FIN 48), which clarifies the accounting for uncertainty in tax positions. This Interpretation requires that we recognize the impact of a tax position in our financial statements, if that position is more likely than not of being sustained on audit, based on the technical merits of the position. The provisions of FIN 48 are effective for fiscal years beginning after December 15, 2006, with the cumulative effect of the change in accounting principle recorded as an adjustment to opening retained earnings. The application of this Statement will reduce our retained earnings on January 1, 2007 by approximately $8 million to increase reserves for uncertain tax positions.
On February 16, 2006, FASB issued Statement No. 155, Accounting for Certain Hybrid Instruments (SFAS 155), which amends SFAS No. 133, Accounting for Derivative Instruments and Hedging Activities (SFAS 133) and SFAS No. 140, Accounting for Transfers and Servicing of Financial Assets and Extinguishment of Liabilities (SFAS 140). SFAS 155 allows financial instruments that have embedded derivatives to be accounted for as a whole, (eliminating the need to bifurcate the derivative from its host) if the holder elects to account for the instrument on a fair value basis. SFAS 155 also clarifies and amends certain other provisions of SFAS 133 and SFAS 140. This Statement is effective for all financial instruments acquired or issued in fiscal years beginning after September 15, 2006. The adoption of this Statement is not expected to have a material impact on our consolidated financial statements.
On March 17, 2005, the EITF reached consensus on Issue No. 04-6, Accounting for Stripping Costs Incurred during Production in the Mining Industry, (EITF 04-6). The consensus clarified that stripping costs incurred during the production phase of a mine are variable production costs that should be included in the cost of inventory. The consensus, which was effective for reporting periods beginning after December 15, 2005, permitted early adoption. At its June 29, 2005 meeting, FASB ratified a modification to EITF 04-6 to clarify that the term “inventory produced” means “inventory extracted.” We elected to adopt EITF 04-6 in 2005. As a result, we recorded an after-tax cumulative effect adjustment of $5.2 million or $.09 per diluted share, and increased product inventory by $8.0 million effective January 1, 2005.
81
Cleveland-Cliffs Inc and Consolidated Subsidiaries
Notes to Consolidated Financial Statements — (Continued)
NOTE 2 — PORTMAN ACQUISITION
On April 19, 2005, Cliffs Asia Pacific completed the acquisition of 80.4 percent of the outstanding shares of Portman, a Western Australia-based independent iron ore mining and exploration company. The acquisition was initiated on March 31, 2005 by the purchase of 68.7 percent of the outstanding shares of Portman. The assets consist primarily of iron ore inventory, land and mineral rights, and iron ore reserves. The purchase price of the 80.4 percent interest was $433.1 million, including $12.4 million of acquisition costs. Additionally, we incurred $9.8 million of foreign currency hedging costs related to this transaction, which were included in Other-net in the Statements of Consolidated Operations. The acquisition increased our customer base in China and Japan and established our presence in the Australian mining industry. Portman’s full-year production (excluding .7 million tonnes in 2006, and .6 million tonnes in 2005 representing the 50 percent-owned Cockatoo Island joint venture) was approximately 7.0 million tonnes for 2006 and 6.0 million tonnes for 2005. Portman completed a $62 million project in the first half of 2006 that increased its wholly owned production capacity to eight million tonnes per year. The production is fully committed to steel companies in China and Japan through 2009. Portman’s reserves total approximately 88 million tonnes at December 31, 2006, and it has an active exploration program underway to increase its reserves.
The acquisition and related costs were financed with existing cash and marketable securities and $175 million of interim borrowings under a three-year $350 million revolving credit facility. The outstanding balance was repaid in July 2005. See NOTE 6 — CREDIT FACILITIES.
Our Statements of Consolidated Financial Position as of December 31, 2006 and 2005, reflected the acquisition of Portman, under the purchase method of accounting. Assets acquired and liabilities assumed have been recorded at fair values as of the acquisition date as determined by results of an appraisal of assets and liabilities finalized in the first quarter of 2006.
82
Cleveland-Cliffs Inc and Consolidated Subsidiaries
Notes to Consolidated Financial Statements — (Continued)
The adjustment since our initial allocation of the 80.4 percent interest in Portman increased Portman’s iron ore inventory values by $46.5 million to reflect a market-based valuation. Of the $46.5 million inventory basis adjustment, $23.1 million was allocated to product and work-in-process inventories, of which approximately $19.9 million was included in cost of goods sold in 2005 and the $3.2 million remaining product and work-in-process inventory basis adjustment was recognized in the first quarter of 2006. The remaining $23.4 million inventory basis adjustment, which was allocated to the long-term stockpiles, will be realized over the mine life. Additionally, a long-term lease was classified as a capital lease resulting in an increase in plant and equipment, and current and other long-term liabilities, of $26.7 million. The valuation also resulted in a $13.6 million increase in the value of our 50 percent interest in our investment in Cockatoo Island and assignment of $8.4 million of goodwill, which is not deductible for tax purposes. The increase in the value of Cockatoo Island was based upon a discounted cash flow analysis over the remaining life of its iron ore reserves. Feasibility studies have concluded that mining and shipments from current operations at Cockatoo Island can be continued until late 2007. The value assigned to Portman’s iron ore reserves decreased by $82.4 million. The $.7 million reduction in purchase price was attributable to the re-allocation of transaction costs to debt acquisition costs, which were being initially amortized over the three-year term of the credit facility and recorded as Other-net on the Statements of Consolidated Operations upon replacement of the $350 million credit facility in June 2006. A comparison of the finalized purchase price allocation to the initial allocation is as follows:
| (In Millions) | ||||||||||||
| March 31, 2005 | ||||||||||||
| Finalized Allocation |
Initial Allocation |
Change | ||||||||||
| ASSETS |
||||||||||||
| Current assets |
||||||||||||
| Cash |
$ | 24.1 | $ | 24.1 | $ | |||||||
| Iron ore inventory |
53.9 | 29.0 | 24.9 | |||||||||
| Other |
35.2 | 35.3 | (.1 | ) | ||||||||
| Total current assets |
113.2 | 88.4 | 24.8 | |||||||||
| Property, plant and equipment |
||||||||||||
| Iron ore reserves |
421.9 | 504.3 | (82.4 | ) | ||||||||
| Other |
69.3 | 34.7 | 34.6 | |||||||||
| Total property, plant and equipment |
491.2 | 539.0 | (47.8 | ) | ||||||||
| Long-term stockpiles |
37.0 | 15.4 | 21.6 | |||||||||
| Investment in Cockatoo Island |
18.2 | 4.6 | 13.6 | |||||||||
| Other assets |
5.8 | 6.7 | (.9 | ) | ||||||||
| Goodwill |
8.4 | 8.4 | ||||||||||
| Total assets |
$ | 673.8 | $ | 654.1 | $ | 19.7 | ||||||
| LIABILITIES |
||||||||||||
| Current liabilities |
$ | 36.2 | $ | 34.7 | $ | 1.5 | ||||||
| Deferred tax liabilities |
143.4 | 149.0 | (5.6 | ) | ||||||||
| Other long-term liabilities |
34.6 | 9.1 | 25.5 | |||||||||
| Total liabilities |
214.2 | 192.8 | 21.4 | |||||||||
| Net assets |
459.6 | 461.3 | (1.7 | ) | ||||||||
| Minority interest |
(26.5 | ) | (27.5 | ) | 1.0 | |||||||
| Purchase price |
$ | 433.1 | $ | 433.8 | $ | (.7 | ) | |||||
83
Cleveland-Cliffs Inc and Consolidated Subsidiaries
Notes to Consolidated Financial Statements — (Continued)
The following unaudited pro forma information summarizes the results of operations for the years-ended December 31, 2005 and 2004, as if the Portman acquisition had been completed as of the beginning of 2004. The pro forma information gives effect to actual operating results prior to the acquisition. Adjustments made to revenues for hedging contracts, cost of goods sold for depletion amortization costs incurred and inventory effects, reflecting the allocation of purchase price to iron ore reserves and inventory, interest expense, income taxes and minority interest related to the acquisition, are reflected in the pro forma information. These pro forma amounts do not purport to be indicative of the results that would have actually been obtained if the acquisition had occurred as of the beginning of the periods presented or that may be obtained in the future.
| Pro Forma (In Millions, Except Per Common Share) | ||||||
| 2005 | 2004 | |||||
| Total revenues |
$ | 1,802.2 | $ | 1,329.5 | ||
| Income before cumulative effect of accounting change |
279.0 | 313.1 | ||||
| Cumulative effect of accounting change |
5.2 | |||||
| Net income |
$ | 284.2 | $ | 313.1 | ||
| Earnings per common share—Basic: |
||||||
| Before cumulative effect of accounting change |
$ | 6.29 | $ | 7.23 | ||
| Cumulative effect of accounting change |
.12 | |||||
| Earnings per common share—Basic |
$ | 6.41 | $ | 7.23 | ||
| Earnings per common share—Diluted: |
||||||
| Before cumulative effect of accounting change |
$ | 5.01 | $ | 5.71 | ||
| Cumulative effect of accounting change |
.10 | |||||
| Earnings per common share—Diluted |
$ | 5.11 | $ | 5.71 | ||
NOTE 3 — DISCONTINUED OPERATIONS
Cliffs’ business/consulting arrangements with Ferrominera to provide technical assistance in support of improving operations of a 3.3 million tonne per year pelletizing facility were terminated in the third quarter of 2005. We recorded after-tax income of $.2 million and after-tax expense of $1.7 million related to this contract in 2006 and 2005 respectively.
On July 23, 2004, CAL, an affiliate of Cliffs jointly owned by a subsidiary of the Company (82.3945 percent) and Outokumpu Technology GmbH (17.6055 percent), a German company (formerly known as Lurgi Metallurgie GmbH), completed the sale of CAL’s HBI facility located in Trinidad and Tobago to Mittal Steel USA. Terms of the sale included a purchase price of $8.0 million plus assumption of liabilities. Mittal Steel USA closed this facility at the end of 2005. We recorded after-tax income of $.1 million and $.9 million in 2006 and 2005, respectively.
The results of discontinued operations for CAL and Ferrominera were recorded under Income (Loss) from Discontinued Operations in the Statements of Consolidated Operations.
NOTE 4 — SEGMENT REPORTING
As a result of the Portman acquisition, we organized into two operating and reporting segments based upon geographic location: North America and Australia (also referred to as Portman). The North America segment, comprised of our mining operations in the United States and Canada, represented approximately 81 percent of our consolidated revenues for 2006. The Australia segment, comprised of our acquired 80.4 percent Portman interest in Western Australia, represented approximately 19 percent of our consolidated revenues for the same period. There have been no intersegment revenues since the acquisition.
84
Cleveland-Cliffs Inc and Consolidated Subsidiaries
Notes to Consolidated Financial Statements — (Continued)
The North American segment is comprised of our six iron ore mining operations in Michigan, Minnesota and Eastern Canada. We manufacture 13 grades of iron ore pellets, including standard, fluxed and high manganese, for use in our customers’ blast furnaces as part of the steelmaking process. Each of the mines has crushing, concentrating and pelletizing facilities used in the production process. We sell the majority of our pellets to integrated steel companies in the United States and Canada, using a single sales force.
The Australia segment includes operations at the Koolyanobbing operations and a 50 percent equity interest in a joint venture at Cockatoo Island producing lump ore and direct shipping fines for our customers in China and Japan. The Koolyanobbing operation has crushing and screening facilities used in the production process. Production is fully committed to steel companies in China and Japan through 2009.
We primarily evaluate performance based on segment operating income, defined as revenues less expenses identifiable to each segment. We have classified certain administrative expenses as unallocated corporate expenses.
The following table presents a summary of our segments for 2006, 2005 and 2004 based on the current reporting structure. A reconciliation of segment operating income to income before income taxes and minority interest is as follows:
| (In Millions) | ||||||||||||
| 2006 | 2005 | 2004 | ||||||||||
| Revenues from product sales and services: |
||||||||||||
| North America |
$ | 1,308.1 | $ | 1,307.7 | $ | 995.0 | ||||||
| Australia |
361.0 | 204.5 | ||||||||||
| Total revenues from product sales and services |
$ | 1,669.1 | $ | 1,512.2 | $ | 995.0 | ||||||
| Segment operating income: |
||||||||||||
| North America |
$ | 330.9 | $ | 375.8 | $ | 150.7 | ||||||
| Australia |
81.8 | 23.1 | ||||||||||
| Segment operating income |
412.7 | 398.9 | 150.7 | |||||||||
| Unallocated corporate expenses |
(47.0 | ) | (42.4 | ) | (33.1 | ) | ||||||
| Other income (expense) |
22.1 | 11.6 | 167.6 | |||||||||
| Income from continuing operations before income taxes and minority interest |
$ | 387.8 | $ | 368.1 | $ | 285.2 | ||||||
| Depreciation, depletion and amortization: |
||||||||||||
| North America |
$ | 38.9 | $ | 28.1 | $ | 29.3 | ||||||
| Australia |
44.4 | 24.7 | ||||||||||
| Total depreciation, depletion and amortization |
$ | 83.3 | $ | 52.8 | $ | 29.3 | ||||||
| Capital expenditures (a): |
||||||||||||
| North America |
$ | 80.6 | $ | 71.9 | $ | 54.4 | ||||||
| Australia |
31.9 | 37.9 | ||||||||||
| Total capital expenditures |
$ | 112.5 | $ | 109.8 | $ | 54.4 | ||||||
| Segment assets: |
||||||||||||
| North America |
$ | 1,154.0 | $ | 1,079.6 | $ | 1,232.3 | ||||||
| Australia |
785.7 | 667.1 | ||||||||||
| Total consolidated assets |
$ | 1,939.7 | $ | 1,746.7 | $ | 1,232.3 | ||||||
| (a) | Includes $7.0 million in 2006 and $12.0 million in 2005 of accruals and other non-cash additions. |
85
Cleveland-Cliffs Inc and Consolidated Subsidiaries
Notes to Consolidated Financial Statements — (Continued)
Included in the consolidated financial statements are the following amounts relating to geographic locations:
| (In Millions) | |||||||||
| 2006 | 2005 | 2004 | |||||||
| Revenue (1) |
|||||||||
| United States |
$ | 1,109.2 | $ | 1,007.6 | $ | 919.7 | |||
| Canada |
379.7 | 454.1 | 231.2 | ||||||
| China |
367.4 | 232.6 | 56.6 | ||||||
| Japan |
74.4 | 54.9 | |||||||
| Other countries |
2.7 | 3.4 | 6.9 | ||||||
| Total revenue |
$ | 1,933.4 | $ | 1,752.6 | $ | 1,214.4 | |||
| Long-lived assets |
|||||||||
| Australia |
$ | 522.5 | $ | 485.9 | |||||
| United States |
372.8 | 322.8 | $ | 285.8 | |||||
| Canada |
22.5 | 19.3 | 16.9 | ||||||
| Total long-lived assets |
$ | 917.8 | $ | 828.0 | $ | 302.7 | |||
| (1) | Revenue is attributed to countries based on the location of the customer and includes both Product sales and services and Royalties and management fees |
NOTE 5 — ENVIRONMENTAL AND MINE CLOSURE OBLIGATIONS
At December 31, 2006, Cliffs, including its share of unconsolidated ventures, had environmental and mine closure liabilities of $122.2 million, of which $13.6 million was classified as current. Payments in 2006 were $15.6 million (2005 — $5.6 million). Following is a summary of the obligations:
| (In Millions) | ||||||
| 2006 | 2005 | |||||
| Environmental |
$ | 13.0 | $ | 17.8 | ||
| Mine closure |
||||||
| LTVSMC |
28.2 | 30.4 | ||||
| Operating mines |
81.0 | 67.2 | ||||
| Total mine closure |
109.2 | 97.6 | ||||
| Total environmental and mine closure* |
$ | 122.2 | $ | 115.4 | ||
| * | Includes $18.3 million and $14.7 million at December 31, 2006 and 2005, respectively, of our share of unconsolidated ventures. |
Environmental
Our mining and exploration activities are subject to various laws and regulations governing the protection of the environment. We conduct our operations to protect the public health and environment and believe our operations are in compliance with applicable laws and regulations in all material respects. Our environmental liabilities of $13.0 million and $17.8 million at December 31, 2006 and 2005 respectively, including obligations for known environmental remediation exposures at active and closed mining operations and other sites, have been recognized based on the estimated cost of investigation and remediation at each site. If the cost can only be estimated as a range of possible amounts with no specific amount being most likely, the minimum of the range is accrued in accordance with SFAS 5. Future expenditures are not discounted unless the amount and timing of the cash disbursements are readily known. Potential insurance recoveries have not been reflected. Additional environmental obligations could be incurred, the extent of which cannot be assessed.
86
Cleveland-Cliffs Inc and Consolidated Subsidiaries
Notes to Consolidated Financial Statements — (Continued)
The environmental liability includes our obligations related to five sites that are independent of our iron mining operations, two former iron ore-related sites, two leased land sites where we are lessor and miscellaneous remediation obligations at our operating units. Four of these sites are Federal and State sites where we are named as a PRP: the Rio Tinto mine site in Nevada, the Milwaukee Solvay site in Wisconsin, and the Kipling and Deer Lake sites in Michigan. In addition, we recorded $4.5 million of additional clean-up expense related to a PCB spill at Tilden in 2006 ($5.2 million was previously accrued in December 2005) as Miscellaneous — net in the Statements of Consolidated Operations.
Milwaukee Solvay Site
In September 2002, we received a draft of a proposed Administrative Order by Consent from the EPA, for clean-up and reimbursement of costs associated with the Milwaukee Solvay coke plant site in Milwaukee, Wisconsin. The plant was operated by a predecessor of ours from 1973 to 1983, which predecessor we acquired in 1986. In January 2003, we completed the sale of the plant site and property to a third party. Following this sale, we entered into an Administrative Order by Consent (“Solvay Consent Order”) with the EPA, the new owner and another third party who had operated on the site. In connection with the Solvay Consent Order, the new owner agreed to take responsibility for the removal action and agreed to indemnify us for all costs and expenses in connection with the removal action. In the third quarter of 2003, the new owner, after completing a portion of the removal, experienced financial difficulties. In an effort to continue progress on the removal action, we expended $.9 million in the second half of 2003, $2.1 million in 2004 and $.4 million in 2005 secured by a mortgage on the property. In September 2005, we received a notice of completion from the EPA documenting that all work had been fully performed in accordance with the Solvay Consent Order.
On August 26, 2004, we received a Request for Information pursuant to Section 104(e) of CERCLA relative to the investigation of additional contamination below the ground surface at the Milwaukee Solvay site. The Request for Information was also sent to 13 other PRPs. On July 14, 2005, we received a General Notice Letter from the EPA notifying us that the EPA believes we may be liable under CERCLA and requesting that we, along with other PRPs, voluntarily perform clean-up activities at the site. We have responded to the General Notice Letter indicating that there had been no communications with other PRPs but also indicating our willingness to begin the process of negotiation with the EPA and other interested parties regarding a Consent Order. Subsequently, on July 26, 2005, we received correspondence from the EPA with a proposed Consent Order and informing us that three other PRPs had also expressed interest in negotiating with the EPA. At this time, the nature and extent of the contamination, the required remediation, the total cost of the clean-up and the cost sharing responsibilities of the PRPs cannot be determined, although the EPA advised us that it incurred $.5 million in past response costs, which the EPA will seek to recover from us and the other PRPs. We increased our environmental reserve for Milwaukee Solvay by $.5 million in 2005 for potential additional exposure.
On August 25, 2006 we completed the sale of our mortgage on the site to East Greenfield Investors, LLC, a successor to Kinnickinnic Development Group LLC (“East Greenfield”). East Greenfield acquired our mortgage on the site in consideration for the assumption of all our environmental obligations with respect to the site and a cash payment of $2.25 million. In addition, East Greenfield deposited $4.5 million into an escrow account to fund any remaining environmental clean-up activities on the site and to purchase insurance coverage with a $5 million limit. In the third quarter of 2006, as a result of the finalization of the Closing Agreements, we reduced our environmental reserve related to this site by $2.7 million to reflect our reduced liability. Subsequently, in December 2006, the Company and five other PRPs entered an Administrative Settlement Agreement and AOC with the EPA to conduct a Remedial Investigation/Feasibility Study and to reimburse certain response costs incurred by EPA.
Rio Tinto
The Rio Tinto Mine site is a historic underground copper mine located near Mountain City, NV, where tailings were placed in Mill Creek, a tributary to the Owyhee River. Site investigation and remediation work is
87
Cleveland-Cliffs Inc and Consolidated Subsidiaries
Notes to Consolidated Financial Statements — (Continued)
being conducted in accordance with a Consent Order between the NDEP and the RTWG composed of Cliffs, Atlantic Richfield Company, Teck Cominco American Incorporated, and E. I. du Pont de Nemours and Company. The Consent Order provides for technical review by the U.S. Department of the Interior Bureau of Indian Affairs, the U.S. Fish & Wildlife Service, U.S. Department of Agriculture Forest Service, the NDEP and the Shoshone-Paiute Tribes of the Duck Valley Reservation (collectively, “Rio Tinto Trustees”). The Consent Order is currently projected to continue with the objective of supporting the selection of the final remedy for the site. Costs are shared pursuant to the terms of a Participation Agreement between the parties of the RTWG, who have reserved the right to renegotiate any future participation or cost sharing following the completion of the Consent Order.
The Rio Tinto Trustees have made available for public comment their plans for the assessment of NRD. The RTWG commented on the plans and also are in discussions with the Rio Tinto Trustees informally about those plans. The notice of plan availability is a step in the damage assessment process. The studies presented in the plan may lead to a NRD claim under CERCLA. There is no monetized NRD claim at this time.
During 2006, the focus of the RTWG was on development of alternatives for remediation of the mine site. A draft of an alternatives study was reviewed with NDEP, EPA and the Rio Tinto Trustees and as of December 31, 2006, the alternatives have essentially been reduced to two: (1) tailings stabilization and long-term water treatment; and (2) removal of the tailings. The estimated costs range from approximately $10 million to $27 million. In recognition of the potential for an NRD claim, the parties are actively pursuing a global settlement that would encompass both the remedial action and the NRD issues and thereby avoid the lengthy litigation typically associated with NRD and any settlement would include the EPA. We increased our reserve by $4.1 million in the third quarter of 2006 to reflect our estimated costs for completing the work under the existing Consent Order and our share of the eventual remediation costs based on a consideration of the various remedial measures and related cost estimates, which are currently under review. The expense was included in Miscellaneous-net in the Statements of Consolidated Operations. During the fourth quarter of 2006, the RTWG retained a team of geochemical consultants to assist with the assessment of remediation alternatives and also initiated a mediation process to determine an equitable allocation of costs for the remediation.
Kipling Furnace Site
By letter dated November 19, 1991, the Michigan Department of Natural Resources, now the Michigan Department of Environmental Quality (MDEQ), notified us that it believed we were liable for contamination at the Kipling Furnace site in Kipling, Michigan and requested that we voluntarily undertake actions to remediate the site. We owned and operated a portion of the site from approximately 1902 through 1925 when we sold the property to CITGO Petroleum Company. CITGO in turn, operated at the site and thereafter sold the northern portion of the site to a third party. This northern portion of the site was the location of the majority of our former operations. CITGO has been working formally with MDEQ to address the portions of the site impacted by CITGO’s operations on the property, which occurred between 1925 and 1986. CITGO submitted a remedial action plan in August 2003 to the MDEQ. However, the MDEQ subsequently rejected this remedial action plan as being inadequate.
We responded to the 1991 letter by performing a hydrogeological investigation at the site pursuant to Michigan’s Natural Resources and Environmental Protection Act, which allows parties to conduct environmental response activity without state agency oversight. Our initial investigation took place in 1996, with follow-up monitoring occurring in 1998 through 2003. We developed a proposed remedial action plan to address materials associated with our former operations at the site. We currently estimate the cost of implementing our proposed remedial action to be $.3 million, which expenditures were previously provided in our environmental reserve. We have not yet implemented the proposed remedial action plan.
By a letter dated June 10, 2004, the MDEQ made a new demand to both CITGO and the Company to take responsive actions at the property, including development and submittal of a remedial action plan to the MDEQ
88
Cleveland-Cliffs Inc and Consolidated Subsidiaries
Notes to Consolidated Financial Statements — (Continued)
for approval. We met with the MDEQ to discuss this letter and submitted a response. Subsequently, the Company and CITGO agreed to cooperate in the development of a joint remedial action plan as encouraged by MDEQ. Additional investigative work at the site has been undertaken by CITGO. At this time, it is unclear whether the MDEQ, once it is apprised of our response activities at the site to date, will require us to conduct further investigations or implement a remedial action plan going beyond what we have already developed internally. Conducting further investigations, revising our proposed remedial action plan, or implementing the plan, could result in higher costs than recorded. In addition, an access agreement with the current owners will be required to conduct the remediation.
Deer Lake
Deer Lake is a reservoir located near Ishpeming, Michigan that historically provided water storage for the Carp River Power Plant that was razed in 1972. Elevated concentrations of mercury in Deer Lake fish were noted in 1981. Three known sources of mercury to the lake were atmospheric deposition, historic use of mercury in gold amalgamation on the west side of the lake, and releases of mercury to the City of Ishpeming sewer system, including waste assay solutions from a laboratory operated by Cliffs. The State of Michigan filed suit in 1982 alleging that we had liability for the mercury releases. A Consent Agreement was entered in 1984 that required certain remediation and mitigation, which was performed, and by 2003 mercury concentrations in fish had declined significantly. Subsequently, we engaged in negotiations with the State to comprehensively and completely resolve our liability for mercury releases. An amendment to the Consent Agreement between the Company and the State was entered by the Court on November 7, 2006. The agreement provides for additional remedial measures, long-term maintenance and provisions for public access to various water bodies which we own or control. In the fourth quarter of 2006, the reserve was reduced by $1.6 million to reflect our reduced liability.
Northshore Mine Notice of Violation
On February 10, 2006, our Northshore mine received a Notice of Violation from the EPA. The alleged violations related to the restarts of Furnaces 6, 11 and 12. Following a thorough investigation, Northshore met with EPA, Region V, and submitted a documented response to the allegations. In December 2006, the Minnesota Pollution Control Agency advised Northshore that EPA would not pursue any further action.
Northshore Administrative Permit Amendment
On December 16, 2006, we submitted an administrative permit amendment application to MPCA with respect to Northshore’s Title V operating permit. The proposed amendment requested the deletion of a 30-year-old “control city” monitoring requirement. The MPCA denied our application on February 23, 2007. We have appealed the denial to the Minnesota Court of Appeals.
Subsequent to the filing of our appeal, the MPCA advised Northshore that the MPCA considered Northshore to be in violation of the control city standard. Subsequently, without conceding MPCA’s allegations, we entered into discussions with the MPCA with respect to the terms of a compliance schedule in which we would agree to take certain actions in settlement of the alleged violation. Discussions with the MPCA are currently ongoing. In addition, the Minnesota Center for Environmental Advocacy has since filed a motion with the Court of Appeals to intervene in our appeal of the denial of an administrative amendment to our Title V operating permit. If either our appeal is unsuccessful or if we are unable to negotiate an acceptable compliance schedule, Northshore could be subject to future enforcement actions with respect to its Title V permit if we are unable to meet the control city requirement as interpreted by MPCA.
Portman
On May 14, 2007, the Australian Environmental Protection Authority (“AEPA”) published a study in which the AEPA recommended the establishment of “A class reserves” for the protection of certain allegedly
89
Cleveland-Cliffs Inc and Consolidated Subsidiaries
Notes to Consolidated Financial Statements — (Continued)
environmentally sensitive areas of Western Australia. Some of the proposed A class reserves overlap with mining tenements granted to Portman (the “Overlapping Areas”). The AEPA study has been submitted to the Minister for the Environment and Heritage.
Portman originally received governmental approval to mine in the Overlapping Areas in June 2003. Since that time, Portman has met all applicable environmental requirements. Although we are currently reviewing the study and the effects of the designation of the Overlapping Areas as A class reserves, such categorization may have a material effect on Portman’s operations. It is unknown at this time whether the Minister for the Environment and Heritage will accept the recommendations of the AEPA. If the recommendations of the AEPA are accepted, Portman will challenge any such decision.
Mine Closure
The mine closure obligation of $109.2 million includes the accrued obligation at December 31, 2006 for a closed operation formerly known as LTVSMC, for our six North American operating mines and Portman. The LTVSMC closure obligation results from an October 2001 transaction where our subsidiaries received a net payment of $50 million and certain other assets and assumed environmental and facility closure obligations estimated at $50 million. As of December 31, 2006 the closure obligations have declined to $28.2 million as a result of expenditures totaling $21.8 million since 2001 ($2.2 million in 2006). As a result of the sale of certain assets to PolyMet in 2005 and 2006, they have assumed responsibility for environmental and reclamation obligations related to the purchased assets. The Company will reduce its liability related to these obligations as they are completed by PolyMet. See NOTE 14 — FAIR VALUE OF FINANCIAL INSTRUMENTS.
The accrued closure obligation for our active mining operations of $81.0 million provides for contractual and legal obligations associated with the eventual closure of the mining operations. We determined the obligations, based on detailed estimates, adjusted for factors that an outside third party would consider (i.e., inflation, overhead and profit), escalated to the estimated closure dates and then discounted using a credit adjusted risk-free interest rate of 10.25 percent (12.0 percent for United Taconite and 5.5 percent for Portman) for the initial estimates. The estimates at December 31, 2006 and 2005 included incremental increases in the closure cost estimates and minor changes in estimates of mine lives. The closure date for each location was determined based on the exhaustion date of the remaining economic iron ore reserves. The accretion of the liability and amortization of the related fixed asset is recognized over the estimated mine lives for each location.
The following summarizes our asset retirement obligation liability, including our share of unconsolidated associated companies, at December 31:
| (In Millions) | ||||||
| 2006 | 2005 | |||||
| Asset retirement obligation at beginning of year |
$ | 67.2 | $ | 52.2 | ||
| Accretion expense |
7.3 | 5.9 | ||||
| Portman acquisition |
6.6 | |||||
| Revision in estimated cash flows |
6.5 | 2.5 | ||||
| Asset retirement obligation at end of year |
$ | 81.0 | $ | 67.2 | ||
NOTE 6 — CREDIT FACILITIES
On June 23, 2006, we entered into a five-year unsecured credit agreement with a syndicate of 16 financial institutions. The new facility provides $500 million in borrowing capacity under a revolving credit line, with no scheduled maturities other than the five-year term of the agreement; loans are made with a choice of interest rates and maturities, subject to the term of the agreement. The new credit agreement replaced an existing $350 million unsecured revolving credit facility scheduled to expire in March 2008. We incurred $1.7 million of expense, recorded in Other-net on the Consolidated Statements of Operations, related to the accelerated write-off of debt issuance costs due to the replacement of the facility. We were in compliance with the covenants in the credit
90
Cleveland-Cliffs Inc and Consolidated Subsidiaries
Notes to Consolidated Financial Statements — (Continued)
agreement as of December 31, 2006. Per the terms of the credit agreement, we are required to deliver annual financial statements to the lenders within 90 days of fiscal year-end. On April 18, 2007, we received a waiver extending the requirement to 180 days following fiscal year-end.
The facility has financial covenants based on earnings, debt and fixed cost coverage. Interest rates are either (1) a range from LIBOR plus .75 percent to LIBOR plus 1.50 percent based on debt and earnings, or (2) the prime rate. We did not have any borrowings outstanding against this facility as of December 31, 2006.
During the fourth quarter of 2006, Portman reduced its A$40 million multi-option credit facility to A$11.8 million, which represents the outstanding commitments under performance bonds. Portman entered into a new A$40 million multi-option credit facility, in April 2007.
In 2005, Portman secured five-year financing from its customers in China as part of its long-term sales agreements to assist with the funding of the expansion of its Koolyanobbing mining operation. The borrowings, totaling $6.9 million at December 31, 2006, accrue interest annually at five percent. The borrowings require principal payments of approximately $.8 million plus accrued interest to be made each January 31 for the next three years with the remaining balance due in full on January 31, 2010.
NOTE 7 — LEASE OBLIGATIONS
Cliffs and its ventures lease certain mining, production, and other equipment under operating and capital leases. The leases are for varying lengths, generally at market interest rates and contain purchase and/or renewal options at the end of the terms. Our operating lease expense, including our share of unconsolidated ventures, was $17.0 million in 2006, $16.3 million in 2005 and $19.7 million in 2004. Capital leases, including our share of unconsolidated ventures, were $44.2 million (including $33.6 million at Portman) and $41.4 million (including $31.3 million at Portman) at December 31, 2006 and 2005, respectively. Corresponding accumulated amortization of capital leases included in respective allowances for depreciation was $16.5 million and $14.5 million at December 31, 2006 and 2005, respectively.
Future minimum payments under capital leases and noncancellable operating leases, at December 31, 2006 were:
| (In Millions) | ||||||||||||
| Company’s Share | Total | |||||||||||
| Year ended December 31 |
Capital Leases |
Operating Leases |
Capital Leases |
Operating Leases | ||||||||
| 2007 |
$ | 6.3 | $ | 13.0 | $ | 9.3 | $ | 17.5 | ||||
| 2008 |
4.7 | 10.0 | 7.2 | 12.2 | ||||||||
| 2009 |
4.7 | 9.1 | 7.0 | 10.6 | ||||||||
| 2010 |
3.9 | 7.6 | 5.7 | 8.9 | ||||||||
| 2011 |
3.4 | 7.4 | 4.0 | 8.8 | ||||||||
| 2012 and thereafter |
16.4 | 2.4 | 16.4 | 4.7 | ||||||||
| Total minimum lease payments |
39.4 | $ | 49.5 | 49.6 | $ | 62.7 | ||||||
| Amounts representing interest |
9.0 | 10.1 | ||||||||||
| Present value of net minimum lease payments |
$ | 30.4 | $ | 39.5 | ||||||||
Total minimum lease payments include $32.6 million for capital leases and $2.4 million for operating leases associated with Portman. Our share of total minimum lease payments, $88.9 million, is comprised of our consolidated obligation of $81.2 million and our share of unconsolidated ventures’ obligations of $7.7 million, principally related to Hibbing and Wabush.
NOTE 8 — RETIREMENT RELATED BENEFITS
Cliffs and its unconsolidated ventures offer defined benefit pension plans, defined contribution pension plans and other postretirement benefit plans, primarily consisting of retiree healthcare benefits, as part of a total compensation and benefits program. Portman does not have employee retirement benefit obligations.
91
Cleveland-Cliffs Inc and Consolidated Subsidiaries
Notes to Consolidated Financial Statements — (Continued)
The defined benefit pension plans are largely noncontributory and benefits are generally based on employees’ years of service and average earnings for a defined period prior to retirement or a minimum formula. On September 12, 2006, the Company’s Board of Directors approved modifications to the pension benefits provided to salaried participants. The modifications retroactively reinstated the final average pay benefit formula (previously terminated and replaced with a cash balance formula in July 2003) to allow for additional accruals through June 30, 2008 or the continuation of benefits under an improved cash balance formula, whichever is greater. The change increased the PBO by $15.1 million and pension expense by $1.1 million in 2006. Defined pension plan benefit changes pursuant to the four-year labor agreements reached with the USW for U.S. employees, effective August 1, 2004, and similar changes agreed on for salaried workers, were first recognized in 2005 pension expense. The changes enhanced the temporary supplemental benefit provided under the defined benefit plans and resulted in an increase of $4.0 million in PBO and $.6 million in 2005 pension expense.
In addition, Cliffs and its unconsolidated ventures currently provide various levels of retirement health care and OPEB to most full-time employees who meet certain length of service and age requirements (a portion of which are pursuant to collective bargaining agreements). Most plans require retiree contributions and have deductibles, co-pay requirements, and benefit limits. Most bargaining unit plans require retiree contributions and co-pays for major medical and prescription drug coverage. Effective July 1, 2003, we imposed an annual limit on our cost for medical coverage under the U.S. salaried plans, except for the plans covering participants at the Northshore and LS&I operations. A similar type of limit was previously implemented at Northshore. The annual limit applies to each covered participant and equals $7,000 for coverage prior to age 65 and $3,000 for coverage after age 65, with the retiree’s participation adjusted based on the age at which retiree’s benefits commence. The covered participant pays an amount for coverage equal to the excess of (i) the average cost of coverage for all covered participants, over (ii) the participant’s individual limit, but in no event will the participant’s cost be less than 15 percent of the average cost of coverage for all covered participants. Currently, the average cost for coverage prior to age 65 and after age 65 are below the respective limits of $7,000 and $3,000. The changes implemented to the U.S. salaried pension and other benefit plans reduced costs by an estimated $8.0 million on an annualized basis. We do not provide OPEB for most U.S. salaried employees hired after January 1, 1993. OPEB are provided through programs administered by insurance companies whose charges are based on benefits paid.
Pursuant to the four-year labor agreements reached with the USW for U.S. employees, effective August 1, 2004, OPEB expense for 2004 and the APBO decreased $4.9 million and $48.0 million, respectively, to reflect negotiated plan changes, which capped our share of future bargaining unit retirees’ healthcare premiums at 2008 levels for the years 2009 and beyond. The agreements also provide that Cliffs and its partners fund an estimated $220 million into bargaining unit pension plans and VEBAs during the term of the contracts.
In December 2003, The Medicare Prescription Drug, Improvement, and Modernization Act of 2003 was enacted. This act introduced a prescription drug benefit under Medicare Part D as well as a federal subsidy to sponsors of retiree healthcare benefit plans that provide a benefit that is at least actuarially equivalent to Medicare Part D. Our measures of the accumulated postretirement benefit obligation and net periodic postretirement benefit cost as of December 31, 2004, and for periods thereafter reflect amounts associated with the subsidy. As a result, year 2006, 2005, and 2004 OPEB expense reflect estimated cost reductions of $3.1 million, $3.6 million and $4.1 million, respectively. We elected to adopt the retroactive transition method for recognizing the OPEB cost reduction in the second quarter 2004. The APBO decreased $25.8 million as of January 1, 2005. The following table summarizes the annual costs for the retirement plans.
| (In Millions) | |||||||||
| 2006 | 2005 | 2004 | |||||||
| Defined benefit pension plans |
$ | 26.4 | $ | 20.7 | $ | 23.1 | |||
| Defined contribution pension plans |
4.8 | 3.8 | 3.0 | ||||||
| Other postretirement benefits |
11.2 | 17.9 | 28.5 | ||||||
| Total |
$ | 42.4 | $ | 42.4 | $ | 54.6 | |||
92
Cleveland-Cliffs Inc and Consolidated Subsidiaries
Notes to Consolidated Financial Statements — (Continued)
The following tables and information provide additional disclosures for our plans, including our proportionate share of plans of our unconsolidated ventures.
Obligations and Funded Status
| (In Millions) | ||||||||||||||||
| Pension Benefits | Other Benefits | |||||||||||||||
| Change in benefit obligations |
2006 | 2005 | 2006 | 2005 | ||||||||||||
| Benefit obligations — beginning of year |
$ | 789.5 | $ | 715.5 | $ | 327.2 | $ | 318.2 | ||||||||
| Service cost (excluding expenses) |
12.0 | 10.6 | 2.7 | 2.5 | ||||||||||||
| Interest cost |
43.2 | 41.6 | 16.2 | 17.5 | ||||||||||||
| Plan amendments |
15.1 | 4.0 | ||||||||||||||
| Actuarial loss (gain) |
(8.0 | ) | 63.4 | (30.3 | ) | 5.8 | ||||||||||
| Benefits paid |
(48.9 | ) | (47.2 | ) | (20.4 | ) | (20.4 | ) | ||||||||
| Participant contributions |
3.0 | 3.3 | ||||||||||||||
| Federal Subsidy on benefits paid |
1.2 | |||||||||||||||
| Other |
(.1 | ) | 1.6 | (.1 | ) | .3 | ||||||||||
| Benefit obligations — end of year |
$ | 802.8 | $ | 789.5 | $ | 299.5 | $ | 327.2 | ||||||||
| Change in Plan Assets: |
||||||||||||||||
| Fair value of plan assets — beginning of year |
$ | 584.1 | $ | 541.2 | $ | 95.5 | $ | 75.5 | ||||||||
| Actual return on plan assets |
70.3 | 48.1 | 14.3 | 5.3 | ||||||||||||
| Employer contributions |
46.2 | 40.6 | 18.0 | 15.2 | ||||||||||||
| Benefits paid |
(48.9 | ) | (47.2 | ) | (1.1 | ) | (.5 | ) | ||||||||
| Exchange rate gain (loss) |
(.2 | ) | 1.4 | |||||||||||||
| Fair value of plan assets — end of year |
$ | 651.5 | $ | 584.1 | $ | 126.7 | $ | 95.5 | ||||||||
| Funded status at December 31: |
||||||||||||||||
| Fair value of plan assets |
$ | 651.5 | $ | 584.1 | $ | 126.7 | $ | 95.5 | ||||||||
| Benefit obligations |
802.8 | 789.5 | 299.5 | 327.2 | ||||||||||||
| Funded status (plan assets less benefit obligations) |
(151.3 | ) | (205.4 | ) | (172.8 | ) | (231.7 | ) | ||||||||
| Unrecognized net loss |
211.4 | 259.7 | 115.4 | 163.0 | ||||||||||||
| Unrecognized prior service cost (benefit) |
28.4 | 17.4 | (31.8 | ) | (60.7 | )* | ||||||||||
| Unrecognized net obligation (asset) at date of adoption |
(2.4 | ) | (17.9 | ) | .3 | * | ||||||||||
| Amount recognized at December 31 |
$ | 88.5 | $ | 69.3 | $ | (107.1 | ) | $ | (129.1 | ) | ||||||
| Amounts recognized in the Statements of Financial Position: |
||||||||||||||||
| Noncurrent assets |
$ | 2.8 | $ | $ | $ | |||||||||||
| Current liabilities |
(18.9 | ) | ||||||||||||||
| Noncurrent liabilities |
(154.1 | ) | (153.9 | ) | ||||||||||||
| Prepaid benefit cost |
171.6 | 1.4 | ||||||||||||||
| Accrued benefit cost |
(102.3 | ) | (130.5 | ) | ||||||||||||
| Additional minimum liability |
(166.5 | ) | ||||||||||||||
| Intangible asset |
15.6 | |||||||||||||||
| Accumulated other comprehensive income (pre-tax) |
192.8 | 107.9 | 58.6 | |||||||||||||
| Effect of change in mine ownership & minority interest |
47.0 | 43.0 | 7.1 | |||||||||||||
| Net amount recognized |
$ | 88.5 | $ | 69.3 | $ | (107.1 | ) | $ | (129.1 | ) | ||||||
93
Cleveland-Cliffs Inc and Consolidated Subsidiaries
Notes to Consolidated Financial Statements — (Continued)
| (In Millions) | |||||||||||
| Pension Benefits | Other Benefits | ||||||||||
| Amounts recognized in accumulated other comprehensive income: |
2006 | 2005 | 2006 | 2005 | |||||||
| Net actuarial (gain) loss |
$ | 211.4 | $ | 115.4 | |||||||
| Prior service (credit) cost |
28.4 | (31.8 | ) | ||||||||
| Transition (asset) obligation |
(17.9 | ) | |||||||||
| Net amount recognized |
$ | 239.8 | $ | 65.7 | |||||||
| The estimated amounts that will be amortized from accumulated other |
|||||||||||
| Net actuarial (gain) loss |
$ | 15.3 | $ | 9.7 | |||||||
| Prior service (credit) cost |
4.2 | (6.4 | )* | ||||||||
| Transition (asset) obligation |
(3.0 | )* | |||||||||
| Net amount recognized |
$ | 19.5 | $ | .3 | |||||||
| * | The unrecognized transition liability credit was included as unrecognized prior service credit at year-end 2005 and is shown as unrecognized transition asset at year-end 2006, in order to isolate its value. |
On September 29, 2006, FASB issued SFAS 158 requiring an entity to recognize on its balance sheet the funded status of its defined benefit postretirement plans. Changes in the funded status of a defined benefit postretirement plan will now be recognized, net of tax, within accumulated other comprehensive income, effective for fiscal years ending after December 15, 2006. We utilized December 31, 2006 as our measurement date for determining pension and other benefits obligations and assets. The incremental effect of applying SFAS 158 on individual line items in the Statement of Financial Position as of December 31, 2006 is as follows:
| (In Millions) | ||||||||||
| Before Application of SFAS 158 |
SFAS 158 Adjustments |
After Application of SFAS 158 | ||||||||
| TOTAL CURRENT ASSETS |
$ | 782.3 | $ | $ | 782.3 | |||||
| NET PROPERTIES |
884.9 | 884.9 | ||||||||
| OTHER ASSETS |
||||||||||
| Prepaid pensions — salaried |
78.3 | (76.1 | ) | 2.2 | ||||||
| Intangible pension asset |
13.4 | (13.4 | ) | |||||||
| Other investments |
17.7 | (10.7 | ) | 7.0 | ||||||
| Other noncurrent assets |
263.3 | 263.3 | ||||||||
| TOTAL ASSETS |
$ | 2,039.9 | $ | (100.2 | ) | $ | 1,939.7 | |||
| CURRENT LIABILITIES |
||||||||||
| Other postretirement benefits |
$ | 23.2 | $ | (4.9 | ) | $ | 18.3 | |||
| Other current liabilities |
356.6 | 356.6 | ||||||||
| NONCURRENT LIABILITIES |
||||||||||
| Pensions |
118.8 | 21.6 | 140.4 | |||||||
| Other postretirement obligations |
78.2 | 60.8 | 139.0 | |||||||
| Deferred income taxes |
178.3 | (60.4 | ) | 117.9 | ||||||
| Other noncurrent liabilities |
157.3 | 6.3 | 163.6 | |||||||
| MINORITY INTEREST |
98.7 | (12.9 | ) | 85.8 | ||||||
| PREFERRED STOCK |
172.3 | 172.3 | ||||||||
| SHAREHOLDERS’ EQUITY |
856.5 | (110.7 | ) | 745.8 | ||||||
| TOTAL LIABILITIES AND SHAREHOLDERS’ EQUITY |
$ | 2,039.9 | $ | (100.2 | ) | $ | 1,939.7 | |||
94
Cleveland-Cliffs Inc and Consolidated Subsidiaries
Notes to Consolidated Financial Statements — (Continued)
| (In Millions) | ||||||||||||||||||||||||||||
| U.S. Pension Plans |
Canadian Pension Plans |
|||||||||||||||||||||||||||
| Salaried | Hourly | Mining | SERP | Salaried | Hourly | Total | ||||||||||||||||||||||
| Fair value of plan assets |
$ | 255.6 | $ | 312.8 | $ | 33.1 | $ | $ | 21.8 | $ | 28.2 | $ | 651.5 | |||||||||||||||
| Benefit obligation |
(253.4 | ) | (449.0 | ) | (45.0 | ) | (3.5 | ) | (21.2 | ) | (30.7 | ) | (802.8 | ) | ||||||||||||||
| Funded Status |
$ | 2.2 | $ | (136.2 | ) | $ | (11.9 | ) | $ | (3.5 | ) | $ | .6 | $ | (2.5 | ) | $ | (151.3 | ) | |||||||||
Our net pension liability of $151.3 million at December 31, 2006 is recorded as $140.4 million in Pensions, nothing recorded in current liabilities as Pensions, $2.2 million as Prepaid Pensions — Salaried, and $13.1 million reflected as equity investments.
| (In Millions) | ||||||||||||||||
| U.S. Other Benefits Postretirement |
Canadian Benefits |
Total | ||||||||||||||
| Salaried | Hourly | |||||||||||||||
| Fair value of plan assets |
$ | .1 | $ | 126.6 | $ | $ | 126.7 | |||||||||
| Benefit obligation |
(60.6 | ) | (225.3 | ) | (13.6 | ) | (299.5 | ) | ||||||||
| Funded Status |
$ | (60.5 | ) | $ | (98.7 | ) | $ | (13.6 | ) | $ | (172.8 | ) | ||||
The $172.8 million liability for Other Benefits at December 31, 2006 is recorded as $139.0 million of long-term Other postretirement benefits, and $18.3 million in current liabilities as Other postretirement benefits, and $15.5 million reflected as equity investments.
The accumulated benefit obligation for all defined benefit pension plans was $773.3 million and $760.1 million at December 31, 2006 and 2005, respectively.
Components of Net Periodic Benefit Cost
| (In Millions) | ||||||||||||||||||||||||
| Pension Benefits | Other Benefits | |||||||||||||||||||||||
| 2006 | 2005 | 2004 | 2006 | 2005 | 2004 | |||||||||||||||||||
| Service cost |
$ | 12.0 | $ | 10.6 | $ | 10.7 | $ | 2.7 | $ | 2.5 | $ | 4.0 | ||||||||||||
| Interest cost |
43.2 | 41.6 | 40.9 | 16.2 | 17.5 | 19.8 | ||||||||||||||||||
| Expected return on plan assets |
(48.5 | ) | (44.6 | ) | (38.1 | ) | (9.0 | ) | (7.1 | ) | (5.4 | ) | ||||||||||||
| Amortization: |
||||||||||||||||||||||||
| Transition (asset) obligation |
(2.4 | ) | (3.9 | ) | (3.9 | ) | (3.0 | ) | 1.7 | |||||||||||||||
| Prior service costs (credits) |
3.5 | 3.1 | 2.6 | (6.4 | ) | (6.4 | ) | (4.5 | ) | |||||||||||||||
| Net actuarial loss |
18.6 | 13.9 | 11.9 | 10.7 | 11.4 | 12.9 | ||||||||||||||||||
| Other |
(1.0 | ) | ||||||||||||||||||||||
| Net periodic benefit cost |
$ | 26.4 | $ | 20.7 | $ | 23.1 | $ | 11.2 | $ | 17.9 | $ | 28.5 | ||||||||||||
Additional Information
| (In Millions) | |||||||||||
| Pension Benefits | Other Benefits | ||||||||||
| 2006 | 2005 | 2006 | 2005 | ||||||||
| Effect of change in mine ownership & minority interest |
$ | 47.0 | $ | 43.0 | $ | 7.1 | N/A | ||||
| Minimum liability included in other comprehensive income (pre-tax) |
192.8 | 107.9 | 58.6 | N/A | |||||||
| Actual return on plan assets |
70.3 | 48.1 | 14.3 | 5.3 | |||||||
95
Cleveland-Cliffs Inc and Consolidated Subsidiaries
Notes to Consolidated Financial Statements — (Continued)
Assumptions
At December 31, 2006 we increased our discount rate for U.S. plans to 5.75 percent from 5.50 percent at December 31, 2005. The U.S. discount rates are determined by matching the projected cash flows used to determine the PBO and APBO to a projected yield curve of approximately 400 Aa graded bonds in the 10th to 90th percentiles. These bonds are either noncallable or callable with make-whole provisions. The duration matching produced rates ranging from 5.75 percent to 5.81 percent for our U.S. pension plans. Based upon these results, we selected a December 31, 2006 discount rate of 5.75 percent for our U.S. plans.
The discount rates for Canada are determined by calculating the single level discount rate that, when applied to a particular cash flow pattern, produces the same present value as discounting the cash flow pattern using spot rates generated from a high-quality corporate bond yield curve. Based on the cash flow patterns and liability duration for the Canadian plans, which are dependent on the demographic profile of each plan, we kept our discount rate for the Canadian plans at 5.00 percent, which it was at December 31, 2005.
Weighted-average assumptions used to determine benefit obligations at December 31 were:
| Pension Benefits | Other Benefits | |||||||||||
| 2006 | 2005 | 2006 | 2005 | |||||||||
| U.S. |
||||||||||||
| Discount rate |
5.75 | % | 5.50 | % | 5.75 | % | 5.50 | % | ||||
| Rate of compensation increase |
4.16 | 4.12 | 4.50 | 4.50 | ||||||||
| Canada |
||||||||||||
| Discount rate |
5.00 | 5.00 | 5.00 | 5.00 | ||||||||
| Rate of compensation increase |
4.00 | 4.00 | N/A | N/A | ||||||||
Weighted-average assumptions used to determine net benefit cost for the years 2006, 2005 and 2004 were:
| Pension Benefits | Other Benefits | |||||||||||||||||
| 2006 | 2005 | 2004 | 2006 | 2005 | 2004 | |||||||||||||
| U.S. |
||||||||||||||||||
| Discount rate |
5.50/5.75 | %(1) | 5.75 | % | 6.25 | % | 5.50 | % | 5.75 | % | 6.25 | % | ||||||
| Expected return on plan assets |
8.50 | 8.50 | 8.50 | 8.50 | 8.50 | 8.50 | ||||||||||||
| Rate of compensation increase |
4.12 | 4.16 | 4.19 | 4.50 | 4.50 | 4.19 | ||||||||||||
| Canada |
||||||||||||||||||
| Discount rate |
5.00 | 5.75 | 6.00 | 5.00 | 5.75 | 6.00 | ||||||||||||
| Expected return on plan assets |
8.00 | 8.00 | 8.00 | N/A | 3.00 | 6.50 | ||||||||||||
| Rate of compensation increase |
4.00 | 4.00 | 4.00 | N/A | N/A | N/A | ||||||||||||
| (1) | The 2006 fiscal year SFAS 87 expense was remeasured on September 12, 2006, at 5.75 percent in order to recognize benefit improvements for U.S. salaried participants. |
Assumed Health Care Cost Trend Rates at December 31 were:
| 2006 | 2005 | |||||
| U.S. |
||||||
| Health care cost trend rate assumed for next year |
7.50 | % | 8.00 | % | ||
| Ultimate health care cost trend rate |
5.00 | 5.00 | ||||
| Year that the ultimate rate is reached |
2012 | 2009 | ||||
| Canada |
||||||
| Health care cost trend rate assumed for next year |
9.50 | 8.00 | ||||
| Ultimate health care cost trend rate |
5.00 | 5.00 | ||||
| Year that the ultimate rate is reached |
2016 | 2009 |
96
Cleveland-Cliffs Inc and Consolidated Subsidiaries
Notes to Consolidated Financial Statements — (Continued)
Assumed health care cost trend rates have a significant effect on the amounts reported for the health care plans. A one-percentage-point change in assumed health care cost trend rates would have the following effects:
| (In Millions) | ||||||
| Increase | Decrease | |||||
| Effect on total of service and interest cost |
$ | 2.0 | $ | 1.6 | ||
| Effect on postretirement benefit obligation |
26.4 | 22.3 | ||||
Plan Assets
The returns and risks associated with alternative investment strategies in relation to the current and projected liabilities of the various pension and VEBA plans are reviewed regularly to determine appropriate asset allocation strategies for each plan.
Pension
The pension plans asset allocation at December 31, 2006, and 2005, and the target allocation for 2007 are as follows:
| 2007 Allocation |
Percentage of Plan Assets at December 31 |
||||||||
| Asset Category |
2006 | 2005 | |||||||
| Equity securities |
54.6 | % | 55.6 | % | 50.7 | % | |||
| Debt securities |
32.5 | 31.7 | 30.5 | ||||||
| Hedge funds |
9.2 | 8.9 | 9.1 | ||||||
| Real estate |
3.7 | 3.6 | 8.3 | ||||||
| Cash |
.2 | 1.4 | |||||||
| Total |
100.0 | % | 100.0 | % | 100.0 | % | |||
| (In Millions) Assets at December 31 | ||||||
| Asset Category |
2006 | 2005 | ||||
| Equity securities |
$ | 362.1 | $ | 296.2 | ||
| Debt securities |
206.5 | 178.1 | ||||
| Hedge funds |
58.0 | 53.3 | ||||
| Real estate |
23.6 | 48.2 | ||||
| Cash |
1.3 | 8.3 | ||||
| Total |
$ | 651.5 | $ | 584.1 | ||
The expected return on plan assets represents the weighted average of expected returns for each asset category. Expected returns are determined based on historical performance, adjusted for current trends. The expected return is net of benefit plan expenses.
97
Cleveland-Cliffs Inc and Consolidated Subsidiaries
Notes to Consolidated Financial Statements — (Continued)
VEBA & CLIR Contracts
Assets for other benefits include VEBA trusts and deposits relating to insurance contracts (“CLIR”) pursuant to bargaining agreements that are available to fund retired employees’ life insurance obligations and medical benefits. The other benefit plan asset allocation at December 31, 2006, and 2005, and target allocation for 2007 are as follows:
| 2007 Allocation |
Percentage of Plan Assets at December 31 |
||||||||
| Asset Category |
2006 | 2005 | |||||||
| Equity securities |
59.6 | % | 60.8 | % | 59.8 | % | |||
| Debt securities |
34.2 | 34.0 | 34.5 | ||||||
| Hedge funds |
6.2 | 5.0 | 5.5 | ||||||
| Cash |
.2 | .2 | |||||||
| Total |
100.0 | % | 100.0 | % | 100.0 | % | |||
| (In Millions) Assets at December 31 | ||||||
| Asset Category |
2006 | 2005 | ||||
| Equity securities |
$ | 77.0 | $ | 57.2 | ||
| Debt securities |
43.1 | 32.9 | ||||
| Hedge funds |
6.4 | 5.2 | ||||
| Cash |
.2 | .2 | ||||
| Total |
$ | 126.7 | $ | 95.5 | ||
The expected return on plan assets represents the weighted average of expected returns for each asset category. Expected returns are determined based on historical performance, adjusted for current trends. The expected return is net of benefit plan expenses.
Participant and Company Contributions
| (In Millions) | ||||||||||||
| Pension |
Other Benefits | |||||||||||
| Company Contributions |
VEBA | Direct Payments |
Total | |||||||||
| 2005 |
$ | 40.6 | $ | 15.2 | $ | 16.6 | $ | 31.8 | ||||
| 2006 |
46.2 | 18.0 | 15.1 | 33.1 | ||||||||
| 2007 (Expected) * |
39.2 | 4.9 | 19.0 | 23.9 | ||||||||
| * | Because the Hibbing and United Taconite VEBA trusts are at least 90 percent funded at December 31, 2006, contributions are not required. Pursuant to the bargaining agreement, benefits can be paid from VEBA trusts that are at least 70 percent funded. |
Annual contributions to the pension plans are made within income tax deductibility restrictions in accordance with statutory regulations. In the event of plan termination, the plan sponsors could be required to fund additional shutdown and early retirement obligations that are not included in the pension obligations.
VEBA plans are not subject to minimum regulatory funding requirements. Amounts contributed are pursuant to bargaining agreements.
Contributions by participants to the other benefit plans were $3.0 million and $3.3 million for years ended December 31, 2006 and 2005, respectively.
98
Cleveland-Cliffs Inc and Consolidated Subsidiaries
Notes to Consolidated Financial Statements — (Continued)
We are currently considering various options for the amount to be contributed to the pension plans during 2007. The amounts reflected represent minimum funding requirements and bargaining agreements.
Estimated Cost for 2007
For 2007, Cliffs, including our share of the plans of our unconsolidated ventures, estimates net periodic benefit cost for the U.S. and Canadian plans as follows:
| (In Millions) | |||
| Defined benefit pension plans |
$ | 23.3 | |
| Defined contribution plans |
5.0 | ||
| Other postretirement benefits |
8.2 | ||
| Total |
$ | 36.5 | |
Estimated Company Benefit Payments
| (In Millions) | ||||||||||||
| Pension Benefits |
Other Benefits | |||||||||||
| Gross Company Benefits |
Less Medicare Subsidy |
Net Company Payments | ||||||||||
| 2007 |
$ | 56.4 | $ | 20.9 | $ | 1.3 | $ | 19.6 | ||||
| 2008 |
58.6 | 22.2 | 1.3 | 20.9 | ||||||||
| 2009 |
58.0 | 23.0 | 1.2 | 21.8 | ||||||||
| 2010 |
58.0 | 23.7 | 1.2 | 22.5 | ||||||||
| 2011 |
58.9 | 24.3 | 1.2 | 23.1 | ||||||||
| 2012-2016 |
311.4 | 124.0 | 7.2 | 116.8 | ||||||||
Other Potential Benefit Obligations
While the foregoing reflects our obligation, including our proportionate share of unconsolidated ventures, our total exposure in the event of non-performance of other venturers (at Hibbing and Wabush) is potentially greater. Following is a summary comparison of the total obligation including other venturers’ proportionate shares versus our share:
| (In Millions) | ||||||||||||||||
| December 31, 2006 | ||||||||||||||||
| Company Share | Total | |||||||||||||||
| Defined Benefit Pensions |
Other Benefits |
Defined Benefit Pensions |
Other Benefits |
|||||||||||||
| Fair value of plan assets |
$ | 651.5 | $ | 126.7 | $ | 897.9 | $ | 166.1 | ||||||||
| Benefit obligation |
802.8 | 299.5 | 1,092.6 | 382.4 | ||||||||||||
| Underfunded status of plan |
$ | (151.3 | ) | $ | (172.8 | ) | $ | (194.7 | ) | $ | (216.3 | ) | ||||
| Additional shutdown and early retirement benefits |
$ | 55.9 | $ | 32.2 | $ | 71.0 | $ | 32.6 | ||||||||
99
Cleveland-Cliffs Inc and Consolidated Subsidiaries
Notes to Consolidated Financial Statements — (Continued)
NOTE 9 — INCOME TAXES
The components of the provision for income taxes on continuing operations consisted of the following:
| (In Millions) | ||||||||||||
| 2006 | 2005 | 2004 | ||||||||||
| Current provision: |
||||||||||||
| North American federal |
$ | 55.0 | $ | 64.3 | $ | 47.0 | ||||||
| North American state / provincial & local |
1.4 | 3.4 | 4.7 | |||||||||
| Australian |
39.3 | 21.5 | ||||||||||
| 95.7 | 89.2 | 51.7 | ||||||||||
| Deferred provision (benefit): |
||||||||||||
| North American |
9.9 | 10.1 | (86.7 | ) | ||||||||
| Australian |
(14.7 | ) | (14.5 | ) | ||||||||
| (4.8 | ) | (4.4 | ) | (86.7 | ) | |||||||
| Total provision (benefit) on continuing operations |
$ | 90.9 | $ | 84.8 | $ | (35.0 | ) | |||||
Our 2006 current provision for North American federal income taxes is the sum of U.S. federal income tax of $59.0 million and Canadian federal income tax credits of $4.0 million. The provision for North American state/provincial and local income taxes is the sum of U.S. state and local income taxes of $2.1 million, and Canadian provincial income tax credits of $.7 million.
Our 2006 North American provision for deferred income taxes of $9.9 million from operations primarily reflects a deferred tax charge of $14.2 million related to the 2006 utilization of previously recorded deferred tax assets associated with our investment in ventures and a deferred tax credit of $8.1 million related to deferred taxes associated with deferred income on undelivered product.
Our 2006 Australian provision for deferred income taxes from operations reflects a deferred tax credit attributable primarily to the reversal of deferred tax liabilities established by U.S. GAAP purchase accounting in connection with our acquisition of an 80.4 percent equity interest in Portman. Such deferred tax liabilities relate to the step-up in the financial accounting basis of the inventories, ore reserves, and plant and equipment of Portman; and reverse as post-acquisition operations sell the inventories, mine the ore reserves and utilize the Portman plant and equipment.
Our 2005 provision for North American federal income taxes was the sum of U.S. federal income tax of $63.4 million and Canadian federal income tax of $.9 million. The current provision for North American state/provincial and local income taxes is the sum of U.S. state and local income taxes of $3.3 million and Canadian provincial income taxes of $.1 million.
Our 2005 North American provision for deferred income taxes from operations primarily reflects a deferred tax charge of $18.0 million related to 2005 utilization of previously recorded deferred tax assets and a credit of $8.9 million due to the elimination of a valuation allowance associated with separate return year net operating loss carryforwards of one of our subsidiaries.
100
Cleveland-Cliffs Inc and Consolidated Subsidiaries
Notes to Consolidated Financial Statements — (Continued)
Reconciliation of our income tax attributable to continuing operations computed at the United States federal statutory rate is as follows:
| (In Millions) | ||||||||||||
| 2006 | 2005 | 2004 | ||||||||||
| Tax at U.S. statutory rate of 35 percent |
$ | 135.7 | $ | 128.8 | $ | 99.8 | ||||||
| Increase (decrease) due to: |
||||||||||||
| Percentage depletion in excess of cost depletion |
(32.7 | ) | (37.6 | ) | (16.7 | ) | ||||||
| Rate differential on Australian earnings |
(4.4 | ) | (1.1 | ) | ||||||||
| Effect of state & foreign taxes |
4.9 | .1 | ||||||||||
| Non-deductible expense |
1.1 | 5.5 | 1.4 | |||||||||
| Valuation allowance |
(8.9 | ) | (113.8 | ) | ||||||||
| Other items — net |
(8.8 | ) | (6.8 | ) | (5.8 | ) | ||||||
| Income tax expense (credit) |
$ | 90.9 | $ | 84.8 | $ | (35.0 | ) | |||||
The components of income taxes for other than continuing operations consisted of the following:
| (In Millions) | ||||||||||||
| 2006 | 2005 | 2004 | ||||||||||
| Discontinued operations |
$ | .2 | $ | (.4 | ) | $ | 1.8 | |||||
| Cumulative effect of accounting change |
2.8 | |||||||||||
| Other comprehensive (income) loss: |
||||||||||||
| Minimum pension liability |
9.7 | (10.5 | ) | 4.0 | ||||||||
| Mark-to-market available-for-sale investments |
4.2 | .8 | (34.4 | ) | ||||||||
| Mark-to-market financial hedges |
2.7 | |||||||||||
| 16.6 | (9.7 | ) | (30.4 | ) | ||||||||
| Cumulative effect of implementing SFAS 158 |
(60.4 | ) | ||||||||||
| Paid in capital — stock options |
1.4 | (2.6 | ) | 2.0 | ||||||||
During 2006, the income tax recorded to Other comprehensive income primarily consisted of a deferred tax charge of $9.7 million related to the $27.7 million pre-tax decrease in the minimum pension liability and a deferred tax charge of $4.2 million associated with marking-to-market an investment in PolyMet. The pre-tax impact of implementing SFAS 158 was $171.1 million at December 31, net of the associated tax benefit of $60.4 million.
During 2005, the income tax recorded to Other comprehensive income consisted of a deferred tax credit of $10.5 million related to the deferred tax asset for the $30.0 million increase in the minimum pension liability, partially offset by a deferred tax charge of $.8 million associated with marking-to-market an investment in PolyMet. Also, in 2005, we recorded net losses, net of tax benefits of $.4 million with respect to discontinued operations in Trinidad and Tobago and in Venezuela; as well as an adjustment to our shareholders’ equity, net of a tax benefit of $2.6 million associated with the exercise of stock options.
During 2004, the income tax recorded to Other comprehensive income primarily consisted of a deferred tax credit to reverse the $34.5 million deferred tax liability recorded in 2003 related to the mark-to-market adjustment to our investment in ISG common stock, as we fully monetized our investment in ISG, as well as an adjustment to reflect the tax impacts associated with a decrease in minimum pension obligations.
At December 31, 2006, Current Liabilities-Income taxes on the Statements of Consolidated Financial Position includes $29.1 million for federal, state, provincial and local income taxes. The liability included tax contingencies related to prior years of $3.4 million. In accordance with SFAS 5, our accrual is based upon our estimate of probable losses. The income tax contingencies also include interest expense; no penalties have been assessed or accrued.
101
Cleveland-Cliffs Inc and Consolidated Subsidiaries
Notes to Consolidated Financial Statements — (Continued)
Significant components of our deferred tax assets and liabilities as of December 31, 2006 and 2005 are as follows:
| (In Millions) | ||||||||
| 2006 | 2005 | |||||||
| Deferred tax assets: |
||||||||
| Pensions |
$ | 62.7 | $ | 33.1 | ||||
| Postretirement benefits other than pensions |
41.9 | 21.2 | ||||||
| Deferred revenue |
23.2 | |||||||
| Alternative minimum tax credit carryforwards |
12.8 | 13.0 | ||||||
| Capital loss carryforwards |
11.9 | 11.1 | ||||||
| Development |
11.9 | 8.9 | ||||||
| Asset retirement obligations |
7.7 | 5.1 | ||||||
| Operating loss carryforwards |
2.2 | 3.3 | ||||||
| Product inventories |
2.3 | |||||||
| Other liabilities |
31.7 | 25.2 | ||||||
| Total deferred tax assets before valuation allowance |
206.0 | 123.2 | ||||||
| Deferred tax asset valuation allowance |
11.9 | 11.1 | ||||||
| Net deferred tax assets |
194.1 | 112.1 | ||||||
| Deferred tax liabilities: |
||||||||
| Properties |
135.2 | 134.0 | ||||||
| Investment in ventures |
20.5 | 10.1 | ||||||
| Product inventories |
12.9 | 5.3 | ||||||
| Other assets |
28.1 | 6.4 | ||||||
| Total deferred tax liabilities |
196.7 | 155.8 | ||||||
| Net deferred tax liabilities |
$ | (2.6 | ) | $ | (43.7 | ) | ||
The deferred tax amounts are classified on the Statements of Consolidated Financial Position as current or long-term in accordance with the asset or liability to which they relate. Following is a summary:
| (In Millions) | ||||||||
| 2006 | 2005 | |||||||
| Deferred tax assets: |
||||||||
| North America |
||||||||
| Current |
$ | 9.4 | $ | 11.7 | ||||
| Long-term |
107.0 | 66.5 | ||||||
| Total deferred tax assets |
116.4 | 78.2 | ||||||
| Deferred tax liabilities: |
||||||||
| Australia |
||||||||
| Current |
1.1 | 5.2 | ||||||
| Long-term |
117.9 | 116.7 | ||||||
| Total deferred tax liabilities |
119.0 | 121.9 | ||||||
| Net deferred tax liabilities |
$ | (2.6 | ) | $ | (43.7 | ) | ||
Through our acquisition of Portman, we initially recognized $11.1 million of Australian deferred tax assets related to capital loss carryforwards of $37.0 million. As a result of foreign exchange impacts, these capital loss carryforwards increased to $40.0 million with a corresponding increase in the deferred tax asset to $11.9 million.
102
Cleveland-Cliffs Inc and Consolidated Subsidiaries
Notes to Consolidated Financial Statements — (Continued)
Under Australian income tax law, capital losses are deductible from taxable capital gains, not from ordinary taxable income, but can be carried forward indefinitely. Further, we must satisfy either a continuity of ownership test or a same business test to claim a deduction for past losses. Due to the restrictions posed by these tests, as well as Portman’s uncertainty as to when, if ever, it may generate sufficient capital gains that could be offset, we also recorded a full valuation allowance against this deferred tax asset.
At December 31, 2006, we had $12.8 million of deferred tax assets related to North American alternative minimum tax credits that can be carried forward indefinitely and $2.2 million of deferred tax assets related to North American operating loss carryforwards that expire in 2022.
The increase in North American deferred tax assets of $38.2 million primarily relates to the $60.4 million cumulative effect of implementing SFAS 158, net of $9.9 million of current year tax credits and $9.7 million related to the decrease in the minimum pension liability.
The decrease in Australian deferred tax liability of $2.9 million is the net of the current year charge of $14.7 million partially offset by credits of $9.1 million attributable to foreign exchange and $2.7 million attributable to other comprehensive income.
At December 31, 2006, cumulative undistributed earnings of our Australian subsidiaries included in consolidated retained earnings amounted to $47.7 million. These earnings are indefinitely reinvested in international operations. Accordingly, no provision has been made for deferred taxes related to the future repatriation of these earnings, nor is it practicable to determine the amount of this liability.
NOTE 10 — PREFERRED STOCK
In January 2004, we completed an offering of $172.5 million of redeemable cumulative convertible perpetual preferred stock, without par value, issued at $1,000 per share. The preferred stock pays quarterly cash dividends at a rate of 3.25 percent per annum, has a liquidation preference of $1,000 per share and is convertible into our common shares at an adjusted rate of 65.5068 common shares per share of preferred stock, which is equivalent to an adjusted conversion price of $15.27 per share at December 31, 2006, subject to further adjustment in certain circumstances. Each share of preferred stock may be converted by the holder if during any quarter ending after March 31, 2004 the closing sale price of our common stock for at least 20 trading days in a period of 30 consecutive trading days ending on the last trading day of the preceding quarter exceeds 110 percent of the applicable conversion price on such trading day ($16.80 at December 31, 2006; this threshold was met as of December 31, 2006). The satisfaction of this condition allows conversion of the preferred stock during the quarter ending March 31, 2007. Holders of preferred stock may also convert: (1) if during the five business day period after any five consecutive trading-day period in which the trading price per share of preferred stock for each day of that period was less than 98 percent of the product of the closing sale price of our common stock and the applicable conversion rate on each such day; (2) upon the occurrence of certain corporate transactions; or (3) if the preferred stock has been called for redemption.
On or after January 20, 2009, we may, at our option, redeem some or all of the preferred stock at a redemption price equal to 100 percent of the liquidation preference, plus accumulated but unpaid dividends, but only if the closing price exceeds 135 percent of the conversion price, subject to adjustment, for 20 trading days within a period of 30 consecutive trading days ending on the trading day before the date we give the redemption notice. We may also exchange the preferred stock for convertible subordinated debentures in certain circumstances. We have reserved approximately 11.2 million common treasury shares for possible future issuance for the conversion of the preferred stock. Our shelf registration statement with respect to the resale of the preferred stock, the convertible subordinated debentures that we may issue in exchange for the preferred stock and the common shares issuable upon conversion of the preferred stock and the convertible subordinated debentures was declared effective by the SEC on July 22, 2004. We are no longer contractually obligated to maintain the effectiveness of the registration statement due to the expiration of the effectiveness period.
103
Cleveland-Cliffs Inc and Consolidated Subsidiaries
Notes to Consolidated Financial Statements — (Continued)
Accordingly, on February 14, 2006, we deregistered 92,655 shares of Preferred Stock, $172.5 million in aggregate principal amount of debentures and approximately 11.2 million common shares that have not been resold. The preferred stock is classified for accounting purposes as “temporary equity” reflecting certain provisions of the agreement that could, under remote circumstances (the delisting of our common stock on a U.S. national securities exchange or quotation thereof in an inter-dealer quotation system of any registered U.S. national securities association), require us to redeem the preferred stock for cash. If we are in a default in the payment of six quarterly dividends on the preferred stock, the holders of the preferred stock will thereafter be entitled to elect two directors until all accrued and unpaid dividends are paid.
The net proceeds after offering expenses were approximately $166 million. A portion of the proceeds was utilized to repay the remaining outstanding $25.0 million in principal amount of our senior unsecured notes in the first quarter of 2004. We also used $63.0 million to fund our underfunded pension plans and contributed $13.1 million to our VEBAs in 2004. As of December 31, 2006, 200 shares of preferred stock have been converted to 13,066 common shares reducing our preferred issuance to $172.3 million.
NOTE 11 — STOCK PLANS
The 1992 Incentive Equity Plan, as amended in 1999, authorizes us to issue up to 6,800,000 common shares to employees upon the exercise of Options Rights, as Restricted Shares, in payment of Performance Shares or Performance Units that have been earned, as Deferred Shares, or in payment of dividend equivalents paid on awards made under the Plan. Such shares may be shares of original issuance, treasury shares, or a combination of both. Stock options may be granted at a price not less than the fair market value of the stock on the date the option is granted, generally are not subject to repricing, and must be exercisable not later than ten years and one day after the date of grant. Common shares may be awarded or sold to certain employees with disposition restrictions over specified periods.
The 1996 Nonemployee Directors’ Compensation Plan (As amended and Restated January 1, 2005) (“Directors’ Plan”) was amended in 2001 to authorize us to issue up to 400,000 common shares to Nonemployee Directors. The Directors’ Plan provides for Director Share Ownership Guidelines (“Guidelines”). A Director is required by the end of a four-year period to own either (i) a total of at least 4,000 common shares, or (ii) hold common shares with a market value of at least $100,000. If the Nonemployee Director does not meet the Guidelines assessed December 1, annually, the Nonemployee Director must take $15,000 of the annual retainer ($32,500) in common shares (“Required Retainer”) until such time the Nonemployee Director reaches the Guidelines. Once the Nonemployee Director meets the Guidelines, the Nonemployee Director may elect to receive the Required Retainer in cash.
In order to help Nonemployee Directors achieve their Guidelines, the Directors’ Plan also provides for an Annual Equity Grant (“Equity Grant”). The Equity Grant is awarded at our Annual Meeting each year to all Nonemployee Directors elected or re-elected by the shareholders. The value of the Equity Grant is $32,500 payable in restricted shares with a three-year vesting period from the date of grant. The closing market price of our common shares on our Annual Meeting Date is divided into the $32,500 Equity Grant to determine the number of restricted shares awarded. A Director who is 69 or older at the Equity Grant date will receive common shares with no restrictions.
In July 2005, 6,032 restricted Equity Grant shares were awarded to the current Nonemployee Directors upon approval of the Directors’ Plan. One Director joined the Board in September 2005 and received 564 Equity Grant shares. On May 9, 2006, we granted a total of 5,232 Equity Grant shares, 654 shares of which were deferred into the Nonemployee Directors’ Deferred Compensation Plan (“Compensation Plan”).
The Directors’ Plan offers the Nonemployee Director the opportunity to defer all or a portion of the Annual Directors’ Retainer fees ($32,500), Chair retainers, meeting fees, and the Equity Grant into the Compensation Plan. Two Directors actively deferred in the Compensation Plan in 2006.
104
Cleveland-Cliffs Inc and Consolidated Subsidiaries
Notes to Consolidated Financial Statements — (Continued)
In March 2006, we issued 156,682 shares of restricted stock with a vesting date of March 14, 2009. In March 2005, we issued 136,000 shares of restricted stock with a vesting date of December 31, 2007. As of November 30, 2005, we re-measured the shares for retiree-eligible employees to defer the immediate recognition of tax to the recipient. We immediately vested one-half of the restricted grant awards, resulting in the acceleration of $1.9 million of expense. There were no options issued in 2006, 2005 or 2004.
We recorded other stock-based compensation expense of $10.3 million in 2006, $17.4 million in 2005, and $11.4 million in 2004, primarily in Administrative, selling and general expenses on the Statements of Consolidated Operations. Our other stock-based compensation expense is comprised of Performance Shares, including retention units, and Restricted stock. Following is a summary of our Performance Share Award Agreements currently outstanding:
| Performance |
Performance Shares Outstanding |
Forfeitures* | Grant |
Performance Period | ||||
| 2006 |
6,800 | December 11, 2006 | 1/1/2006-12/31/2008 | |||||
| 2006 |
20,697 | September 1, 2006 | 1/1/2006-12/31/2008 | |||||
| 2006 |
74,516 | 29,454 | May 8, 2006 | 1/1/2006-12/31/2008 | ||||
| 2005 |
7,096 | September 1, 2006 | 1/1/2005-12/31/2007 | |||||
| 2005 |
2,550 | November 15, 2005 | 1/1/2005-12/31/2007 | |||||
| 2005 |
6,460 | May 23, 2005 | 1/1/2005-12/31/2007 | |||||
| 2005 |
72,288 | 16,794 | March 8, 2005 | 1/1/2005-12/31/2007 | ||||
| 2004 |
8,273 | September 1, 2006 | 1/1/2004-12/31/2006 | |||||
| 2004 |
206,391 | 31,809 | March 8, 2004 | 1/1/2004-12/31/2006 |
| * | The 2006 and 2005 Plans are based on assumed forfeitures. The 2004 Plan is based on actual forfeitures. |
For all three Plan Year Agreements, each performance share, if earned, entitles the holder to receive a number of common shares within the range between a threshold and maximum number of shares, with the actual number of common shares earned dependent upon whether the Company achieves certain objectives established by the Compensation Committee of its Board of Directors. The performance payout is determined primarily by Cliffs’ Total Shareholder Return (“TSR”) for the period as measured against a predetermined peer group of mining and metals companies. For the 2006 and 2005 Agreements, the TSR calculated payout may be reduced by up to 50 percent in the event that Cliffs’ pre-tax return on net assets (“RONA”) for the incentive period falls below 12 percent. The 2004 Agreement includes a discrete performance measure and payout based on our pre-tax RONA. Additionally, the payout for both the 2005 and 2004 Agreements may be increased or reduced by up to 25 percent of the target based on management’s performance relative to our strategic objectives over the performance period as evaluated by the Compensation Committee. The final payout may vary from zero to 175 percent of the performance shares awarded for both the 2005 and 2004 Agreements subject to a maximum payout of two times the grant date price. The final payout for the 2006 Agreement varies from zero to 150 percent of the performance shares awarded.
Impact of the Adoption of SFAS 123R
Under existing restricted stock plans awarded prior to January 1, 2006, we will continue to recognize compensation cost for awards to retiree-eligible employees without substantive forfeiture risk over the nominal vesting period. This recognition method differs from the requirements for immediate recognition for awards granted with similar provisions after the January 1, 2006 adoption of SFAS 123R. Accordingly, compensation expense of $1.6 million related to restricted stock awards to retiree-eligible employees granted on March 14, 2006 was recognized in the first quarter of 2006.
105
Cleveland-Cliffs Inc and Consolidated Subsidiaries
Notes to Consolidated Financial Statements — (Continued)
Our income from continuing operations for 2006 includes $10.3 million in pre-tax share-based employee compensation calculated under the provisions of SFAS 123R, which compares with $9.2 million of pre-tax expense had we accounted for share-based compensation under the provisions of SFAS 123 for 2006.
The following table summarizes the share-based compensation expense that we recorded for continuing operations in accordance with SFAS 123R for 2006:
| (In Millions, Except Per Common Share) |
||||
| 2006 | ||||
| Cost of goods sold |
$ | .6 | ||
| Administrative, selling and general expenses |
9.7 | |||
| Reduction of operating income from continuing operations before income taxes and minority interest |
10.3 | |||
| Income tax benefit |
(3.6 | ) | ||
| Reduction of net income |
$ | 6.7 | ||
| Reduction of earnings per share: |
||||
| Basic |
$ | .16 | ||
| Diluted |
$ | .12 | ||
Prior to the adoption of SFAS 123R, we presented all tax benefits for actual deductions in excess of compensation expense as operating cash flows on our Statements of Consolidated Cash Flows. SFAS 123R requires the cash flows resulting from the tax benefits for tax deductions in excess of the compensation expense to be classified as financing cash flows. Accordingly, we classified $1.2 million in excess tax benefits as cash from financing activities rather than cash from operating activities on our Statements of Consolidated Cash Flows for the year ended December 31, 2006.
Determining fair value
We estimated fair value using a Monte Carlo simulation to forecast relative TSR performance. Consistent with the guidelines of SFAS 123R, a correlation matrix of historic and projected stock prices was developed for both Cliffs and its predetermined peer group of mining and metals companies.
The expected term of the grant represented the time from the grant date to the end of the service period for each of the three performance Agreements. We estimated the volatility of our common stock and that of the peer group of mining and metals companies using daily price intervals for all companies. The risk-free interest rate was the rate at the valuation date on zero-coupon government bonds, with a term commensurate with the remaining life of the performance plans.
106
Cleveland-Cliffs Inc and Consolidated Subsidiaries
Notes to Consolidated Financial Statements — (Continued)
The assumptions utilized to estimate the fair value of the Agreements incorporating Cliffs’ relative TSR and the calculated fair values are as follows:
| Plan Year |
Grant Date | Grant Date Market Price |
Average Expected Term (Years) |
Expected Volatility |
Risk-Free Interest Rate |
Dividend Yield |
Fair Value (Percent of Grant Date Market Price) |
||||||||||||
| 2006 |
12/11/2006 | $ | 47.99 | 2.1 | 44 | % | 4.62 | % | 1.04 | % | 8.33 | % | |||||||
| 2006 |
9/1/2006 | 37.45 | 1.8 | 46 | 4.71 | .67 | 10.71 | ||||||||||||
| 2006 |
5/8/2006 | 48.17 | 2.6 | 46 | 4.96 | 1.04 | 27.73 | ||||||||||||
| 2005 |
9/1/2006 | 37.45 | .7 | 44 | 4.73 | .67 | 120.72 | ||||||||||||
| 2005 |
11/15/2005 | 44.10 | 2.1 | 48 | 4.43 | .91 | 130.20 | ||||||||||||
| 2005 |
5/23/2005 | 28.02 | 2.6 | 48 | 3.62 | .71 | 114.58 | ||||||||||||
| 2005 |
3/8/2005 | 39.26 | 2.8 | 48 | 3.72 | .51 | 116.81 | ||||||||||||
| 2004 |
9/1/2006 | 37.45 | .3 | 45 | 4.69 | .67 | 62.96 | ||||||||||||
| 2004 |
3/8/2004 | 17.10 | 2.8 | 47 | 1.94 | 1.17 | 60.44 | ||||||||||||
We adjusted the number of shares awarded under our share-based equity plans concurrent with our June 30, 2006 two-for-one stock split. Management has concluded that the equity anti-dilution adjustments were required and accordingly, the adjustments did not require the recognition of incremental compensation expense.
107
Cleveland-Cliffs Inc and Consolidated Subsidiaries
Notes to Consolidated Financial Statements — (Continued)
Stock option, restricted stock, deferred stock allocation and performance share activity under our Incentive Equity Plans and Non-employee Directors’ Compensation Plans are as follows:
| 2006 | 2005 | 2004 | ||||||||||||||||
| Shares | Weighted- Average Exercise Price |
Shares | Weighted- Average Exercise Price |
Shares | Weighted- Average Exercise Price | |||||||||||||
| Stock options: |
||||||||||||||||||
| Options outstanding at beginning of year |
54,268 | $ | 14.69 | 436,168 | $ | 15.59 | 1,913,864 | $ | 13.20 | |||||||||
| Granted during the year |
||||||||||||||||||
| Exercised |
(42,468 | ) | 15.97 | (350,100 | ) | 16.27 | (1,439,560 | ) | 12.47 | |||||||||
| Cancelled or expired |
(31,800 | ) | 9.60 | (38,136 | ) | 13.66 | ||||||||||||
| Options outstanding at end of year |
11,800 | 10.07 | 54,268 | 14.69 | 436,168 | 15.59 | ||||||||||||
| Options exercisable at end of year |
11,800 | 10.07 | 54,268 | 14.69 | 436,168 | 15.59 | ||||||||||||
| Restricted awards: |
||||||||||||||||||
| Awarded and restricted at beginning of year |
193,180 | 121,500 | 176,228 | |||||||||||||||
| Awarded during the year |
162,208 | 151,126 | ||||||||||||||||
| Vested |
(30,726 | ) | (79,446 | ) | (54,728 | ) | ||||||||||||
| Cancelled |
||||||||||||||||||
| Awarded and restricted at end of year |
324,662 | 193,180 | 121,500 | |||||||||||||||
| Performance shares: |
||||||||||||||||||
| Allocated at beginning of year |
822,118 | 1,234,364 | 1,538,424 | |||||||||||||||
| Allocated during the year |
118,080 | 111,812 | 243,120 | |||||||||||||||
| Issued |
(202,518 | ) | (271,456 | ) | (177,064 | ) | ||||||||||||
| Forfeited/cancelled |
(306,844 | ) | (252,602 | ) | (370,116 | ) | ||||||||||||
| Allocated at end of year |
430,836 | 822,118 | 1,234,364 | |||||||||||||||
| Vested or expected to vest at December 31, 2006 |
405,071 | |||||||||||||||||
| Directors’ retainer and voluntary shares: |
||||||||||||||||||
| Awarded at beginning of year |
1,856 | 12,720 | 37,368 | |||||||||||||||
| Awarded during the year |
1,082 | 2,458 | 12,720 | |||||||||||||||
| Issued |
(2,388 | ) | (13,322 | ) | (37,368 | ) | ||||||||||||
| Awarded at end of year |
550 | 1,856 | 12,720 | |||||||||||||||
| Reserved for future grants or awards at end of year: |
||||||||||||||||||
| Employee plans |
1,334,296 | 1,271,302 | 1,242,376 | |||||||||||||||
| Directors’ plans |
86,774 | 93,328 | 103,248 | |||||||||||||||
| Total |
1,421,070 | 1,364,630 | 1,345,624 | |||||||||||||||
The intrinsic value of options exercised during 2006, 2005 and 2004 was $.7 million, $2.8 million and $8.7 million, respectively.
108
Cleveland-Cliffs Inc and Consolidated Subsidiaries
Notes to Consolidated Financial Statements — (Continued)
A summary of our non-vested shares as of December 31, 2006 is shown below:
| Shares | Weighted Average Grant Date Fair Value | |||||
| Nonvested, beginning of year |
1,017,154 | $ | 16.66 | |||
| Granted |
281,370 | 45.20 | ||||
| Vested |
(277,488 | ) | 10.44 | |||
| Forfeited/expired |
(307,456 | ) | 5.05 | |||
| Nonvested, end of year |
713,580 | $ | 35.33 | |||
The total compensation cost related to non-vested awards not yet recognized is $6.1 million.
Effective January 1, 2003, we adopted the fair value method, which was considered the preferable accounting method for recording stock-based employee compensation as contained in SFAS 123. As prescribed in SFAS 148, we elected to use the “prospective method”. The prospective method requires expense to be recognized for all awards granted, modified or settled beginning in the year of adoption. Historically, we applied the intrinsic method as provided in APB No. 25, Accounting for Stock Issued to Employees and related interpretations, and accordingly, no compensation cost had been recognized for stock options in prior years. As a result of adopting the fair value method for stock options, any future awards will be expensed over the stock options’ vesting period. The following table illustrates the pro forma effect on our net income and earnings per common share as if we had applied the fair value recognition provisions of SFAS 123 to all awards unvested for the previous two years:
| (In Millions, Except | ||||||||
| Per Common Share) | ||||||||
| 2005 | 2004 | |||||||
| Net income as reported |
$ | 277.6 | $ | 323.6 | ||||
| Stock-based employee compensation, net of tax: |
||||||||
| Add expense included in reported results |
8.5 | 6.6 | ||||||
| Deduct fair value based method |
(6.1 | ) | (5.4 | ) | ||||
| Pro forma net income |
$ | 280.0 | $ | 324.8 | ||||
| Earnings attributable to common shares: |
||||||||
| Basic—as reported |
$ | 6.26 | $ | 7.47 | ||||
| Basic—pro forma |
$ | 6.32 | $ | 7.50 | ||||
| Diluted—as reported |
$ | 4.99 | $ | 5.90 | ||||
| Diluted—pro forma |
$ | 5.03 | $ | 5.92 | ||||
Exercise prices for stock options outstanding as of December 31, 2006 ranged from $7.39 to $11.14, summarized as follows:
| Outstanding and Exercisable | |||||||
| Range of exercise prices |
Number of Shares Underlying Options |
Weighted Average Remaining Contractual Life |
Weighted Average Exercise Price | ||||
| Below $10 |
2,800 | 3.0 | $ | 7.39 | |||
| $10 — $20 |
2,000 | 1.0 | 11.14 | ||||
| $10 — $20 |
7,000 | 2.0 | 10.84 | ||||
| 11,800 | 2.1 | $ | 10.07 | ||||
109
Cleveland-Cliffs Inc and Consolidated Subsidiaries
Notes to Consolidated Financial Statements — (Continued)
NOTE 12 — ACCUMULATED OTHER COMPREHENSIVE INCOME (LOSS)
Components of Accumulated Other Comprehensive Income (Loss) and related tax effects allocated to each are shown below:
| (In Millions) | ||||||||||||
| Pre-tax Amount |
Tax Benefit (Provision) |
After-tax Amount |
||||||||||
| Year-ended December 31, 2004: |
||||||||||||
| Minimum pension liability |
$ | (77.8 | ) | $ | (3.4 | ) | $ | (81.2 | ) | |||
| Unrealized gain on securities |
.3 | (.1 | ) | .2 | ||||||||
| $ | (77.5 | ) | $ | (3.5 | ) | $ | (81.0 | ) | ||||
| Year ended December 31, 2005: |
||||||||||||
| Minimum pension liability |
$ | (107.9 | ) | $ | 7.1 | $ | (100.8 | ) | ||||
| Foreign currency translation adjustments |
(24.7 | ) | (24.7 | ) | ||||||||
| Unrealized loss on derivative financial instruments |
(2.6 | ) | .8 | (1.8 | ) | |||||||
| Unrealized gain on securities |
2.6 | (.9 | ) | 1.7 | ||||||||
| $ | (132.6 | ) | $ | 7.0 | $ | (125.6 | ) | |||||
| Year ended December 31, 2006: |
||||||||||||
| Minimum pension liability |
$ | (80.3 | ) | $ | (2.6 | ) | $ | (82.9 | ) | |||
| Foreign currency translation adjustments |
9.6 | 9.6 | ||||||||||
| Unrealized (gain) loss on derivative financial instruments |
6.4 | (1.9 | ) | 4.5 | ||||||||
| Unrealized gain on securities |
14.7 | (5.1 | ) | 9.6 | ||||||||
| Cumulative effect of implementing SFAS 158 |
(171.1 | ) | 60.4 | (110.7 | ) | |||||||
| $ | (220.7 | ) | $ | 50.8 | $ | (169.9 | ) | |||||
Accumulated Other Comprehensive Income (Loss) balances are as follows:
| (In Millions) | ||||||||||||||||||||||||
| Minimum Pension Liability |
Unrealized Gain on Securities |
Foreign Currency Translation |
Unrealized Loss on Derivative Financial Instruments |
Effect of Implementing SFAS 158 |
Accumulated Other Comprehensive Income (Loss) |
|||||||||||||||||||
| Balance December 31, 2003 |
$ | (88.5 | ) | $ | 144.9 | $ | $ | $ | $ | 56.4 | ||||||||||||||
| Change during 2004 |
7.3 | (144.7 | ) | (137.4 | ) | |||||||||||||||||||
| Balance December 31, 2004 |
(81.2 | ) | .2 | (81.0 | ) | |||||||||||||||||||
| Change during 2005 |
(19.6 | ) | 1.5 | (24.7 | ) | (1.8 | ) | (44.6 | ) | |||||||||||||||
| Balance December 31, 2005 |
(100.8 | ) | 1.7 | (24.7 | ) | (1.8 | ) | (125.6 | ) | |||||||||||||||
| Change during 2006 |
17.9 | 7.9 | 34.3 | 6.3 | (110.7 | ) | (44.3 | ) | ||||||||||||||||
| Balance December 31, 2006 |
$ | (82.9 | ) | $ | 9.6 | $ | 9.6 | $ | 4.5 | $ | (110.7 | ) | $ | (169.9 | ) | |||||||||
NOTE 13 — SHAREHOLDERS’ EQUITY
Under our share purchase rights plan, one-quarter of a right is attached to each of our common shares outstanding or subsequently issued. One right entitles the holder to buy from us one-hundredth of one common share. The rights expire on September 19, 2007 and are not exercisable until the occurrence of certain triggering
110
Cleveland-Cliffs Inc and Consolidated Subsidiaries
Notes to Consolidated Financial Statements — (Continued)
events, which include the acquisition of, or tender or exchange offer for, 20 percent or more of our common shares. There are approximately 672,000 common shares, reserved for these rights. We are entitled to redeem the rights upon the occurrence of certain events.
NOTE 14 — FAIR VALUE OF FINANCIAL INSTRUMENTS
The carrying amount and fair value of our financial instruments at December 31, 2006 and 2005 were as follows:
| (In Millions) | ||||||||||||
| 2006 | 2005 | |||||||||||
| Carrying Value |
Fair Value |
Carrying Value |
Fair Value | |||||||||
| Cash and cash equivalents |
$ | 351.7 | $ | 351.7 | $ | 192.8 | $ | 192.8 | ||||
| Marketable securities (short-term) |
9.9 | 9.9 | ||||||||||
| Derivative assets |
32.9 | 32.9 | 19.2 | 19.2 | ||||||||
| Long-term receivable* |
55.7 | 68.4 | 60.7 | 76.9 | ||||||||
| Marketable securities (long-term) |
28.9 | 28.9 | 10.6 | 10.6 | ||||||||
| Hedge contracts (long-term) |
3.6 | 3.6 | ||||||||||
| Hedge contracts payable |
1.3 | 1.3 | ||||||||||
| Long-term debt* |
6.9 | 6.6 | 7.7 | 7.3 | ||||||||
| * | Includes current portion. |
The carrying amount of cash and cash equivalents, marketable securities, derivative assets and hedge contracts equals fair value.
Certain supply agreements with one of our North American customers include provisions for supplemental revenue or refunds based on the customer’s annual steel pricing for the year the product is consumed in the customer’s blast furnace. The supplemental pricing is characterized as an embedded derivative instrument and is required to be accounted for separately from the contract base price. The derivative which is finalized based on a future price, is marked to fair value as revenue adjustments each reporting period until the product is consumed and the amount is settled. Derivative assets, representing the fair value of pricing factors, were $26.6 million and $18.6 million on the December 31, 2006 and December 31, 2005 Statements of Consolidated Financial Position, respectively.
The fair value of the long-term receivable from Mittal Steel USA of $68.4 million and $76.9 million at December 31, 2006 and December 31, 2005, respectively, is based on the discount rate utilized by the Company, which represents an approximate fixed borrowing rate. Portman has a non-interest bearing rail credit receivable of $.8 million and $.9 million at December 31, 2006 and December 31, 2005 respectively.
On February 16, 2004, we entered into an option agreement with PolyMet that granted PolyMet the exclusive right to acquire certain land, crushing and concentrating and other ancillary facilities located at our Cliffs Erie site (formerly owned by LTVSMC). The iron ore mining and pelletizing operations were permanently closed in January 2001. PolyMet’s parent company, PolyMet Corp, is a non-ferrous mining company located in Vancouver, B.C. Canada. PolyMet Corp’s stock trades on the AMEX in the U.S. under the symbol PLM.
Under terms of the agreement, we received $.5 million and one million shares of PolyMet Corp for maintaining certain identified components of the facility, while PolyMet conducted a feasibility study on the development of its Northmet PolyMetallic non-ferrous ore deposits located near the Cliffs Erie site. PolyMet had until June 30, 2006 to exercise its option and acquire the assets covered under the agreement for additional
111
Cleveland-Cliffs Inc and Consolidated Subsidiaries
Notes to Consolidated Financial Statements — (Continued)
consideration. We recorded the $.5 million option payment and one million common shares (valued at approximately $.2 million on the agreement date) under the deposit method and deferred recognition of the gain. We classified the PolyMet Corp shares as available-for-sale and recorded mark-to-market changes in the value of the shares to other comprehensive income.
On November 15, 2005, we reached an agreement with PolyMet regarding the terms for the early exercise of PolyMet’s option to acquire the assets under the agreement and closed the sales transaction resulting in a $9.5 million pre-tax gain. Under the terms of the agreement, we received cash of $1.0 million and approximately 6.2 million common shares of PolyMet Corp, which closed that day at $1.25 per share. ($3.14 per share at December 31, 2006). The additional PolyMet Corp shares received in this transaction are classified as available-for-sale in Other assets. We expect to receive additional cash proceeds of $2.4 million in quarterly installments by and according to the terms of the contract for deed executed by the parties, which installments will be recognized as received.
In September 2006, we entered into a Letter of Intent with PolyMet with respect to the sale of certain owned or leased real property, various mining, railroad and service facilities and associated service permits. The transaction was completed on December 20, 2006. The property includes, but is not limited to, a 120-car rail fleet, locomotive fueling and railway maintenance buildings, railway track and rights, an administration building, pump houses, pipelines, power lines and support equipment. Proceeds from the transaction are:
| • | $1.0 million in cash; |
| • | Two million shares of the common stock of PolyMet Corp, valued at $3.09 per common share at December 20, 2006; which were valued at $3.14 at December 31, 2006; |
| • | $7.0 million in cash payable in quarterly installments of $.25 million commencing December 31, 2006, with the balance payable upon receipt of PolyMet’s commercial finance. Interest will be payable quarterly from December 31 at the Wall Street Journal Prime Rate; and |
| • | $7.0 million in cash payable in quarterly installments of $.25 million commencing on December 31, 2009, with a balloon payment of the remaining amount due December 31, 2011, plus interest on the unpaid balance from December 31, 2009, which installments will be recognized as received. |
We recognized a $7.4 million pre-tax gain in the fourth quarter of 2006 as a result of the December 2006 transaction. As a final component of the purchase price, PolyMet will assume from Cliffs certain on-going site related environmental and reclamation obligations. See Mine Closure in NOTE 5 — ENVIRONMENTAL AND MINE CLOSURE OBLIGATIONS. We also recognized a $1.0 million pre-tax gain resulting from the 2006 receipt of four quarterly installments of $.25 million associated with the November 2005 PolyMet transaction. Cliffs now owns 9.2 million shares of PolyMet Corp common stock, representing 7.7 percent of issued shares. We intend to hold our shares of PolyMet indefinitely. Cliffs has the right to participate in up to 7.7 percent of any future financing and PolyMet has the first right to acquire or place Cliffs shares should it choose to sell. The two million shares received in the December 2006 transaction could not be sold, transferred or traded in Canada until April 21, 2007. Sales of the unregistered shares in the United States are subject to the trading volume restrictions outlined in Rule 144 of the Securities Act of 1933. It has been determined that the shares are appropriately classified as “Marketable securities” on the balance sheet and valued (marked-to-market) at the current trading price. There are no restrictions related to the 7.2 million shares previously owned.
At December 31, 2006 and 2005, our U.S. mining ventures had in place forward purchase contracts, designated as normal purchases, of natural gas and diesel fuel in the notional amount of $80.0 million (our share — $72.5 million) and $28.6 million (our share — $24.7 million), respectively. The unrecognized fair value loss on the contracts at December 31, 2006, which mature at various times through December 2007 was estimated to be $12.6 million (our share — $11.3 million) based on December 31, 2006 forward rates.
Portman hedges a portion of its United States currency-denominated sales in accordance with a formal policy. The primary objective for using derivative financial instruments is to reduce the earnings volatility
112
Cleveland-Cliffs Inc and Consolidated Subsidiaries
Notes to Consolidated Financial Statements — (Continued)
attributable to changes in Australian and United States currency fluctuations. We had $6.3 million and $.6 millon of hedge contracts recorded as Derivative assets on the December 31, 2006 and 2005 Statements of Consolidated Financial Position, respectively, and $3.6 million of hedge contracts recorded as long-term assets as Deposits and miscellaneous on the Statements of Consolidated Financial Position at December 31, 2006. Hedge contracts payable totaling $1.3 million were included as Other Liabilities on the December 31, 2005 Statements of Consolidated Financial Position.
The fair value of Portman’s long-term debt was determined based on a discounted cash flow analysis and estimated current borrowing rates.
NOTE 15 — EARNINGS PER SHARE
The following table summarizes the computation of basic and diluted earnings per share.
| (In Millions, Except per common share) | ||||||||||||||||||||||||
| 2006 | 2005 | 2004 | ||||||||||||||||||||||
| Amount | Per Share |
Amount | Per Share |
Amount | Per Share |
|||||||||||||||||||
| Income from continuing operations |
$ | 279.8 | $ | 6.65 | $ | 273.2 | $ | 6.29 | $ | 320.2 | $ | 7.51 | ||||||||||||
| Preferred dividend |
(5.6 | ) | (.13 | ) | (5.6 | ) | (.13 | ) | (5.3 | ) | (.12 | ) | ||||||||||||
| Income from continuing operations applicable to common shares |
274.2 | 6.52 | 267.6 | 6.16 | 314.9 | 7.39 | ||||||||||||||||||
| Discontinued operations |
.3 | .01 | (.8 | ) | (.02 | ) | 3.4 | .08 | ||||||||||||||||
| Cumulative effect |
5.2 | .12 | ||||||||||||||||||||||
| Income applicable to common shares — basic |
274.5 | $ | 6.53 | 272.0 | $ | 6.26 | 318.3 | $ | 7.47 | |||||||||||||||
| Dilutive effect preferred dividend |
5.6 | 5.6 | 5.3 | |||||||||||||||||||||
| Income applicable to common shares plus assumed conversions — diluted |
$ | 280.1 | $ | 5.20 | $ | 277.6 | $ | 4.99 | $ | 323.6 | $ | 5.90 | ||||||||||||
| Average number of shares (in thousands) |
||||||||||||||||||||||||
| Basic |
42,072 | 43,456 | 42,616 | |||||||||||||||||||||
| Employee stock plans |
481 | 1,061 | 1,097 | |||||||||||||||||||||
| Convertible preferred stock |
11,274 | 11,156 | 11,132 | |||||||||||||||||||||
| Diluted |
53,827 | 55,673 | 54,845 | |||||||||||||||||||||
NOTE 16 — CONTINGENCIES
Cliffs’ and its ventures are periodically involved in litigation incidental to our operations. Management believes that any pending litigation will not result in a material liability in relation to our consolidated financial statements.
113
Cleveland-Cliffs Inc and Consolidated Subsidiaries
Notes to Consolidated Financial Statements — (Continued)
NOTE 17—QUARTERLY RESULTS OF OPERATIONS
(In Millions, Except Per Common Share)
| 2006 | |||||||||||||||
| Quarters | |||||||||||||||
| First | Second | Third | Fourth | Year | |||||||||||
| Revenues from product sales and services |
$ | 306.4 | $ | 486.2 | $ | 580.1 | $ | 549.0 | $ | 1,921.7 | |||||
| Operating income |
46.2 | 116.4 | 119.5 | 83.6 | 365.7 | ||||||||||
| Income before extraordinary gain and cumulative effect of accounting change |
37.9 | 83.1 | 89.1 | 70.0 | 280.1 | ||||||||||
| Net income |
37.9 | 83.1 | 89.1 | 70.0 | 280.1 | ||||||||||
| Earnings per share |
|||||||||||||||
| Basic |
$ | .83 | $ | 1.91 | $ | 2.13 | $ | 1.69 | $ | 6.53 | |||||
| Diluted |
.68 | 1.53 | 1.68 | 1.33 | 5.20 | ||||||||||
The sum of quarterly EPS may not equal EPS for the year due to discrete quarterly calculations.
Second quarter results included a $3.8 million pre-tax accrual for additional clean-up costs related to a November 2005 PCB spill at Tilden. Third quarter results included a pre-tax customer bankruptcy recovery of $3.9 million from WCI. Fourth quarter results included a $7.7 million pre-tax gain on the sale of certain assets to PolyMet, compared with a $9.5 million pre-tax gain recognized in 2005. Fourth quarter expense was also impacted by an approximate $15 million pre-tax cost effect related to production curtailments caused by the October 12 explosions at the United Taconite processing plant and a $3.0 million insurance deductible recorded in Miscellaneous-net in the Statements of Consolidated Operations.
| 2005 | |||||||||||||||
| Quarters | |||||||||||||||
| First | Second | Third | Fourth | Year | |||||||||||
| Revenues from product sales and services |
$ | 271.2 | $ | 485.3 | $ | 514.1 | $ | 468.9 | $ | 1,739.5 | |||||
| Operating income |
34.1 | 138.9 | 122.4 | 61.1 | 356.5 | ||||||||||
| Income before extraordinary gain and cumulative effect of accounting change |
21.0 | 99.7 | 85.6 | 66.1 | 272.4 | ||||||||||
| Net income |
26.2 | 99.7 | 85.6 | 66.1 | 277.6 | ||||||||||
| Earnings per share |
|||||||||||||||
| Basic |
$ | .58 | $ | 2.26 | $ | 1.94 | $ | 1.48 | $ | 6.26 | |||||
| Diluted |
.48 | 1.79 | 1.54 | 1.18 | 4.99 | ||||||||||
First quarter results included an $8.0 million pre-tax gain for a cumulative effect adjustment related to stripping costs and a $9.8 million pre-tax charge for currency hedging costs related to the acquisition of Portman. Our 2005 financial statements include Portman’s results since the March 31, 2005 acquisition. Second quarter results included a $10.6 million pre-tax business interruption recovery. Fourth quarter results included a $9.5 million pre-tax gain on the sale of certain assets to PolyMet.
114
Report of Independent Registered Public Accounting Firm
To the Board of Directors and Stockholders of
Cleveland-Cliffs Inc
Cleveland, OH
We have audited management’s assessment, included in the accompanying Management Report on Internal Controls Over Financial Reporting in Item 9A, that Cleveland-Cliffs Inc and subsidiaries (the “Company”) did not maintain effective internal control over financial reporting as of December 31, 2006, because of the effect of the material weakness identified in management’s assessment, based on criteria established in Internal Control—Integrated Framework issued by the Committee of Sponsoring Organizations of the Treadway Commission. The Company’s management is responsible for maintaining effective internal control over financial reporting and for its assessment of the effectiveness of internal control over financial reporting. Our responsibility is to express an opinion on management’s assessment and an opinion on the effectiveness of the Company’s internal control over financial reporting based on our audit.
We conducted our audit in accordance with the standards of the Public Company Accounting Oversight Board (United States). Those standards require that we plan and perform the audit to obtain reasonable assurance about whether effective internal control over financial reporting was maintained in all material respects. Our audit included obtaining an understanding of internal control over financial reporting, evaluating management’s assessment, testing and evaluating the design and operating effectiveness of internal control, and performing such other procedures as we considered necessary in the circumstances. We believe that our audit provides a reasonable basis for our opinions.
A company’s internal control over financial reporting is a process designed by, or under the supervision of, the company’s principal executive and principal financial officers, or persons performing similar functions, and effected by the company’s board of directors, management, and other personnel to provide reasonable assurance regarding the reliability of financial reporting and the preparation of financial statements for external purposes in accordance with generally accepted accounting principles. A company’s internal control over financial reporting includes those policies and procedures that (1) pertain to the maintenance of records that, in reasonable detail, accurately and fairly reflect the transactions and dispositions of the assets of the company; (2) provide reasonable assurance that transactions are recorded as necessary to permit preparation of financial statements in accordance with generally accepted accounting principles, and that receipts and expenditures of the company are being made only in accordance with authorizations of management and directors of the company; and (3) provide reasonable assurance regarding prevention or timely detection of unauthorized acquisition, use, or disposition of the company’s assets that could have a material effect on the financial statements.
Because of the inherent limitations of internal control over financial reporting, including the possibility of collusion or improper management override of controls, material misstatements due to error or fraud may not be prevented or detected on a timely basis. Also, projections of any evaluation of the effectiveness of the internal control over financial reporting to future periods are subject to the risk that the controls may become inadequate because of changes in conditions, or that the degree of compliance with the policies or procedures may deteriorate.
A material weakness is a significant deficiency, or combination of significant deficiencies, that results in more than a remote likelihood that a material misstatement of the annual or interim financial statements will not be prevented or detected. The following material weakness has been identified and included in management’s assessment resulting from deficiencies in the design of the control:
The Company did not maintain a sufficient complement of personnel with an appropriate level of technical accounting knowledge, experience and training to consistently perform independent secondary reviews and to appropriately interpret and apply complex accounting standards. This was evidenced by the number of adjustments noted during the year-end closing process including the assessment that the Company’s previous interpretation and related documentation of the revenue recognition criteria for collect and hold transactions was not appropriate. This material weakness, if not remediated, has the potential to cause a material misstatement in the future.
115
This material weakness was considered in determining the nature, timing, and extent of audit tests applied in our audit of the consolidated financial statements as of and for the year ended December 31, 2006, of the Company and this report does not affect our report on such financial statements.
In our opinion, management’s assessment that the Company did not maintain effective internal control over financial reporting as of December 31, 2006, is fairly stated, in all material respects, based on the criteria established in Internal Control — Integrated Framework issued by the Committee of Sponsoring Organizations of the Treadway Commission. Also in our opinion, because of the effect of the material weakness described above on the achievement of the objectives of the control criteria, the Company has not maintained effective internal control over financial reporting as of December 31, 2006, based on the criteria established in Internal Control — Integrated Framework issued by the Committee of Sponsoring Organizations of the Treadway Commission.
We have also audited, in accordance with the standards of the Public Company Accounting Oversight Board (United States), the consolidated financial statements as of and for the year ended December 31, 2006, of the Company and our report dated May 25, 2007, expressed an unqualified opinion on those financial statements and included an explanatory paragraph regarding the Company’s adoption of new accounting standards.
/s/ DELOITTE & TOUCHE LLP
Cleveland, OH
May 25, 2007
116
Report of Independent Registered Public Accounting Firm
To the Board of Directors and Stockholders of
Cleveland-Cliffs Inc
Cleveland, OH
We have audited the accompanying statements of consolidated financial position of Cleveland-Cliffs Inc and subsidiaries (the “Company”) as of December 31, 2006 and 2005, and the related statements of consolidated operations, shareholders’ equity, and cash flows for each of the three years in the period ended December 31, 2006. Our audits also included the financial statement schedule listed in the Index at Item 15(a). These financial statements and financial statement schedule are the responsibility of the Company’s management. Our responsibility is to express an opinion on the financial statements and financial statement schedule based on our audits.
We conducted our audits in accordance with the standards of the Public Company Accounting Oversight Board (United States). Those standards require that we plan and perform the audit to obtain reasonable assurance about whether the financial statements are free of material misstatement. An audit includes examining, on a test basis, evidence supporting the amounts and disclosures in the financial statements. An audit also includes assessing the accounting principles used and significant estimates made by management, as well as evaluating the overall financial statement presentation. We believe that our audits provide a reasonable basis for our opinion.
In our opinion, such consolidated financial statements present fairly, in all material respects, the financial position of Cleveland-Cliffs Inc and subsidiaries as of December 31, 2006 and 2005, and the results of their operations and their cash flows for each of the three years in the period ended December 31, 2006, in conformity with accounting principles generally accepted in the United States of America. Also, in our opinion, such financial statement schedule, when considered in relation to the basic consolidated financial statements taken as a whole, presents fairly, in all material respects, the information set forth therein.
We have also audited, in accordance with the standards of the Public Company Accounting Oversight Board (United States), the effectiveness of the Company’s internal control over financial reporting as of December 31, 2006, based on the criteria established in Internal Control—Integrated Framework issued by the Committee of Sponsoring Organizations of the Treadway Commission and our report dated May 25, 2007, expressed an unqualified opinion on management’s assessment of the effectiveness of the Company’s internal control over financial reporting and an adverse opinion on the effectiveness of the Company’s internal control over financial reporting.
As discussed in Notes 1, 8, and 11 to the consolidated financial statements, the Company adopted Statement of Financial Accounting Standards (“SFAS”) No. 123(R), Share-Based Payment, and SFAS No. 158, Employers’ Accounting for Defined Benefit Pension and Other Postretirement Plans, in 2006. Additionally, as discussed in Note 1 to the consolidated financial statements, in 2005 the Company changed its method of accounting for stripping costs incurred during the production phase of a mine.
/s/ DELOITTE & TOUCHE LLP
Cleveland, OH
May 25, 2007
117
Item 9. Changes in and Disagreements With Accountants on Accounting and Financial Disclosure.
None.
Item 9A. Controls and Procedures.
The Company maintains disclosure controls and procedures that are designed to ensure that information required to be disclosed in the Company’s Exchange Act reports is recorded, processed, summarized and reported within the time periods specified in the SEC’s rules and forms, and that such information is accumulated and communicated to the Company’s management, including its Chief Executive Officer and Chief Financial Officer, as appropriate, to allow timely decisions regarding required disclosure based closely on the definition of “disclosure controls and procedures” in Rule 13a-15(e) promulgated under the Exchange Act. In designing and evaluating the disclosure controls and procedures, management recognized that any controls and procedures, no matter how well designed and operated, can provide only reasonable assurance of achieving the desired control objectives, and management necessarily was required to apply its judgment in evaluating the cost-benefit relationship of possible controls and procedures.
As of the end of the period covered by this report, the Company carried out an evaluation, under the supervision and with the participation of the Company’s management, including the Company’s Chief Executive Officer and the Company’s Chief Financial Officer, of the effectiveness of the design and operation of the Company’s disclosure controls and procedures. Based on the foregoing, the Company’s Chief Executive Officer and Chief Financial Officer concluded that the Company’s disclosure controls and procedures were not effective as of the date of the evaluation conducted by our Chief Executive Officer and Chief Financial Officer because of a material weakness in our internal control over financial reporting which we view as an integral part of our disclosure controls and procedures.
The Company did not maintain a sufficient complement of personnel with an appropriate level of technical accounting knowledge, experience and training to consistently perform independent secondary reviews and to appropriately interpret and apply complex accounting standards. This was evidenced by the number of adjustments noted during the year-end closing process including the assessment that the Company’s previous interpretation and related documentation of the revenue recognition criteria for collect and hold transactions was not appropriate. This material weakness, if not remediated, has the potential to cause a material misstatement in the future.
118
Management Report on Internal Controls Over Financial Reporting
The Company’s management is responsible for establishing and maintaining adequate internal control over financial reporting. The Company’s internal control system was designed to provide reasonable assurance to the Company’s management and Board of Directors regarding the preparation and fair presentation of published financial statements.
All internal control systems, no matter how well designed, have inherent limitations. Therefore, even those systems determined to be effective can provide only reasonable assurance with respect to financial statement preparation and presentation.
Management assessed the effectiveness of the Company’s internal control over financial reporting as of December 31, 2006. In making this assessment, it used the criteria set forth by the Committee of Sponsoring Organizations of the Treadway Commission (COSO) in Internal Control — Integrated Framework. Based on its assessment, management believes that, as of December 31, 2006, the Company’s internal control over financial reporting were not effective, based on those criteria.
A material weakness is a significant deficiency, or combination of significant deficiencies, that results in there being a more than remote likelihood that a material misstatement of the annual or interim financial statements will not be prevented or detected. In our assessment of the effectiveness of internal control over financial reporting as of December 31, 2006, we determined that there was a control deficiency that constituted a material weakness.
The Company did not maintain a sufficient complement of personnel with an appropriate level of technical accounting knowledge, experience and training to consistently perform independent secondary reviews and to appropriately interpret and apply complex accounting standards. This was evidenced by the number of adjustments noted during the year-end closing process including the assessment that the Company’s previous interpretation and related documentation of the revenue recognition criteria for collect and hold transactions was not appropriate. This material weakness, if not remediated, has the potential to cause a material misstatement in the future.
On September 11, 2006, the Board of Directors of the Company adopted Amendment No. 2 (“Amendment No. 2”) to the Cleveland-Cliffs Inc Supplemental Retirement Benefit Plan (As Amended and Restated Effective January 1, 2001) (the “Plan”). The Plan provides for the payment of the benefits that would be lost by Plan participants as a result of present or future Internal Revenue Code or other government limitations. Under the Plan as in effect prior to Amendment No. 2, a participant’s benefit accrued at the end of each calendar year was required to be distributed as soon as practicable following the end of the calendar year. Amendment No. 2 revised the Plan to specify that distributions on or after January 1, 2005 shall be made no later than March 15 of the calendar year immediately following the calendar year of accrual. Amendment No. 2 also specified that, with respect to any participant who retires on or after July 1, 2006, any remaining accrued benefit will be distributed as soon as reasonably possible after the date of the participant’s retirement. Amendment No. 2 was effective for all participants who retire on or after July 1, 2006.
On November 7, 2006, the Board of Directors of the Company adopted Amendment No. 3 (“Amendment No. 3”) to the Plan. Amendment No. 3 revised the distribution provisions of the Plan so that a participant would receive his or her benefits under the Plan, based on the prior election of the participant, either in (a) a lump sum payment no earlier than six months after retirement or termination of employment; or (b) ten annual installments commencing six months after retirement or termination of employment. Amendment No. 3 applies only to participants who are active employees of the Company on or after December 1, 2006.
Amendment No. 2 and Amendment No. 3 are included as Exhibits 10(c) and 10(d), respectively. The foregoing discussions of the terms of the Amendment No. 2 and Amendment No. 3 are qualified in their entirety by reference to the full text of such exhibits, which are incorporated by reference herein.
119
PART III
Item 10. Directors, Executive Officers and Corporate Governance.
INFORMATION CONCERNING DIRECTORS AND NOMINEES
Based upon information received from the respective Directors and nominees as of May 24 2007, the following information is furnished with respect to each person nominated for election as a Director.
| Name, Age and Principal Occupation and |
First Became Director | |
| RONALD C. CAMBRE, 68, Former Chairman of the Board of Newmont Mining Corporation, an international mining company, from January 1995 through December 2001. Mr. Cambre served as Chief Executive Officer of Newmont Mining Corporation, from November 1993 to December 2000. Mr. Cambre is a Director of W. R. Grace & Co. and McDermott International, Inc. |
1996 | |
| JOSEPH A. CARRABBA, 54, Chairman, President and Chief Executive Officer since May 8, 2007. Mr. Carrabba served as our President and Chief Executive Officer from September 2006 through May 8, 2007 and as our President and Chief Operating Officer from May 2005 to September 2006. Mr. Carrabba previously served as President and Chief Operating Officer of Diavik Diamond Mines, Inc. from April 2003 to May 2005 and General Manager of Weipa Bauxite Operation of Comalco Aluminum from March 2000 to April 2003, both subsidiaries of Rio Tinto plc. |
2006 | |
| SUSAN M. CUNNINGHAM, 51, Senior Vice President of Exploration and Corporate Reserves of Noble Energy Inc., an international oil and gas exploration and production company, since October 2005. Ms. Cunningham served as Senior Vice President of Exploration of Noble Energy Inc. since 2001. |
2005 | |
| BARRY J. ELDRIDGE, 61, Former Managing Director and Chief Executive Officer of Portman Limited, an international iron ore mining company in Australia, from October 2002 through April 2005. Mr. Eldridge served as Managing Director and Chief Executive Officer of Griffin Coal, a mining operation and division of Griffin Energy Pty Ltd in Western Australia, from January 2001 through September 2002. Mr. Eldridge was previously with North Limited, a major metal mining and natural resources operation in Western Australia, serving as Director — Major Projects from 1998 through 2002. Mr. Eldridge is a Deputy Chairman and Audit Committee Member of Mundo Minerals Pty. Ltd. and Chairman of Vulcan Resources Ltd., both of which are listed on the Australian Stock Exchange. |
2005 | |
| SUSAN M. GREEN, 47, Former Montgomery County, Maryland Council Aide from December 2002 to August 2005. Ms. Green served as Associate Deputy Secretary with the U.S. Department of Labor from January 2000 to January 2001. The Board of Directors has nominated Ms. Green for election as a Director. Ms. Green was proposed as a nominee for the Board of Directors by the USW, pursuant to the terms of our 2004 labor agreement. |
— | |
| JAMES D. IRELAND III, 57, Managing Director since January 1993 of Capital One Partners, Inc., a private equity investment firm, which through an affiliate, serves as the General Partner of Early Stage Partners L.P., a venture capital investment partnership. Mr. Ireland is a Director of OurPets Co. |
1986 | |
| FRANCIS R. McALLISTER, 64, Chairman and Chief Executive Officer of Stillwater Mining Company, a palladium and platinum producer, since February 12, 2001. Mr. McAllister is a Director of Stillwater Mining Company. |
1996 | |
120
| Name, Age and Principal Occupation and |
First Became Director | |
| ROGER PHILLIPS, 67, Former President and Chief Executive Officer of IPSCO Inc., a North American steel producing company, from February 1982 through January 2002. Mr. Phillips is a Director of Canadian Pacific Railway Limited, Imperial Oil Limited and Toronto Dominion Bank. |
2002 | |
| RICHARD K. RIEDERER, 63, Chief Executive Officer of RKR Asset Management, a consulting organization since June 2006. Mr. Riederer served as Chief Executive Officer (from January 1996) and President (from January 1995) of Weirton Steel Corporation, a steel producing company, through February 2001. Mr. Riederer is a Director of First American Funds, Chairman and Director of Idea Foundry, and serves on the Board of Trustees of Franciscan University of Steubenville. |
2002 | |
| ALAN SCHWARTZ, 67, Professor of Law at the Yale Law School and Professor at the Yale School of Management since 1987. |
1991 | |
Mr. Brinzo, who retired from Cleveland-Cliffs effective September 1, 2006, and Mr. Gunning, Chairman and Vice Chairman, respectively, retired from the Board of Directors effective May 8, 2007. Both retirements had been expected.
SECTION 16(a) BENEFICIAL OWNERSHIP REPORTING COMPLIANCE
Section 16(a) of the Securities Exchange Act of 1934 requires our Directors and officers and persons who own ten percent or more of a registered class of our equity securities to file reports of ownership and changes in ownership on Forms 3, 4 and 5 with the SEC. Directors, officers and ten percent or greater shareholders are required by SEC regulations to furnish us with copies of all Forms 3, 4 and 5 they file.
Based solely on our review of the copies of such forms we have received, and written representations by such persons, we believe that all of our Directors, officers and ten percent or greater shareholders complied with all filing requirements applicable to them with respect to transactions in our equity securities during the fiscal year ended December 31, 2006. Due to an administrative oversight, an exchange of a deferred cash bonus for shares on behalf of Mr. Trethewey transacted on February 13, 2007 was reported March 7, 2007. It has also come to our attention that eight Forms 4 filed on March 15, 2004 were two days late because they incorrectly identify March 11, 2004, rather than March 8, 2004, as the grant date for awarding retention units to all of our executive officers at the time under our Long Term Incentive Plan.
BUSINESS ETHICS POLICY
We have adopted a Code of Business Conduct and Ethics that applies to all of our Directors, officers and employees. The Code of Business Conduct and Ethics is available on our website at http://www.cleveland- cliffs.com and is also available upon request at GeneralCounsel@cleveland-cliffs.com, (800) 214-0739 or (216) 694-5459. We intend to post amendments to or waivers from our Code of Business Conduct (to the extent applicable to our principal executive officer, principal financial officer or principal accounting officer) on our website.
AUDIT COMMITTEE
The Audit Committee, consisting of Messrs. Riederer (chairman), Eldridge, Ireland, and Ms. Cunningham, reviews with our management, the internal auditors and the independent auditors, the adequacy and effectiveness of our system of internal control over financial reporting; reviews significant accounting matters; reviews quarterly unaudited financial information prior to public release; approves the audited financial statements prior to public distribution; approves our assertions related to internal controls prior to public distribution; reviews any significant changes in our accounting principles or financial reporting practices; reviews, approves and retains the services performed by our independent auditors; has the authority and responsibility to evaluate independent auditors; discusses with the auditors their independence and considers the compatibility of non-audit services with such independence; annually selects and retains our independent auditors to examine our financial statements; approves management’s appointment, termination, or replacement of the Chief Internal Auditor; and conducts a legal compliance review. Pursuant to the rules of the SEC, the members of the Audit Committee are independent, as that term is defined in the NYSE listing standards. The Board of Directors identified Messrs. Riederer and Ireland as audit committee financial experts (as defined in Item 407(d)(5)(ii) of Regulation S-K).
121
Item 11. Executive Compensation.
COMPENSATION DISCUSSION AND ANALYSIS
Introduction
We are the largest producer of iron ore pellets in North America and sell the majority of our pellets to integrated steel companies in the United States and Canada. In 2006, we operated a total of six iron ore mines located in Michigan, Minnesota and Eastern Canada, producing 33.6 million tons of pellets (20.8 million tons being our share) and generating $1.3 billion in pellet sales revenue. In addition, we are the majority owner of Portman Limited, an iron ore mining company located in Australia, serving the Asian iron ore markets. Portman provided US$361 million in revenue to Cleveland-Cliffs.
Most of our sales are under multi-year term supply agreements. These agreements are subject to various price escalators, including world settlement prices for iron ore pellets, hot-band steel prices, the producer price index, and other similar factors. As a result of these escalators, we have limited direct control over pricing for our product in the short-term.
Our market has also been substantially altered by the significant increase in worldwide demand for iron ore products over the last several years. Our revenues have grown from under $900 million annually in 2003 to $1.9 billion in 2006 (including our share of Portman’s revenues).
Both of these factors (significant price increases driven by market factors and rapid revenue growth) have had a meaningful impact on our executive compensation in recent years. Specifically, the Compensation and Organization Committee, which we refer to as the Compensation Committee, has sought to strike a balance in program design and execution among several competing objectives, including:
| • | Attraction and retention of executive talent |
| • | Recognition for business performance |
| • | Maintaining focus on controllable results |
| • | Limiting the potential for undue windfalls or losses to executives |
| • | Recognition of changes in scope of the business (revenues and profitability) |
| • | Supporting our strategic repositioning |
| - | Building capacity |
| - | Growth and diversification of revenue streams |
| - | Internationalization |
| • | Ensuring alignment with shareholder interests |
The specific compensation principles, components, and decisions designed to achieve these objectives are discussed in more detail below.
Oversight of Executive Compensation
The Compensation Committee administers the executive compensation program, including compensation for our Chief Executive Officer, or CEO, Chief Financial Officer, or CFO, and our three other most highly compensated executive officers, who, along with Mr. Brinzo, we refer to as our named executive officers. Specific responsibilities of the Compensation Committee related to executive compensation include:
| • | Oversee development and implementation of our compensation policies and programs for executive officers; |
| • | Review and approve CEO and other elected officer compensation, including setting goals, evaluating performance, and determining results; |
122
| • | Oversee our equity-based employee incentive compensation plans and approve grants (except grants or awards under plans relating to Director compensation, which are administered by the Board Affairs Committee); |
| • | Ensure that the criteria for awards under our incentive and equity plans are appropriately related to our operating performance objectives; |
| • | Oversee certain aspects of regulatory compliance with respect to compensation matters; |
| • | Review and approve any proposed severance or retention plans or agreements. |
The Compensation Committee regularly meets five times per year and has special meetings as required. The Committee regularly reports its activities to the Board at the next scheduled Board meeting or at such other times as the Compensation Committee or the Board deems appropriate.
Executive Compensation Philosophy and Core Principles
The Compensation Committee has designed the compensation structure to attract, motivate, reward and retain high-performing executives. The goal is to align pay with our performance in the short term through measures of profitability and operational excellence, and over the long term through stock-based incentives. Our compensation philosophy places a significant portion of compensation at risk with our individual performance, increasing the portion at risk with the responsibility level of the individual, consistent with market practices. We also seek to balance this performance focus with sufficient retention incentives and a focus on controllable results to limit the risk of losing key executives during periods of unfavorable industry conditions, in a manner that the Compensation Committee deems fair to the executives and to the shareholders.
More specifically, the guiding principles of our compensation plan design and administration are as follows:
| • | Target pay opportunity for executive officers should be at the median of market levels. |
| • | Align pay with results delivered to shareholders, while recognizing the potentially cyclical nature of the industry in which we operate. The goal is to avoid undue windfalls to executives in years of good performance or the undue loss of all compensation opportunities in down cycles. |
| • | Focus performance measures on a combination of absolute performance objectives tied to our business plan (profitability and cost control), achievement of key initiatives that reflect the business strategy (e.g., sales initiatives, cost control activities, etc.) and relative objectives reflecting market conditions (relative Total Shareholder Return (share price appreciation plus reinvested dividends, if any), or TSR). |
| • | Provide competitive fixed compensation elements over the short-term (salary) and long-term (retention grants and retirement benefits) to encourage long-term retention of our executives. |
| • | Design pay programs to be as simple and transparent as possible to facilitate focus and understanding. |
Executive compensation and benefits consist of salary, annual cash incentives, long-term incentives consisting of performance shares, retention units, and restricted shares, retirement benefits, and limited perquisites and other benefits. Descriptions of each of these elements are discussed in more detail in the following sections.
Compensation Policies
Market Positioning. We manage total compensation (base plus target annual incentives and the grant value of long-term incentives) to the median of the market in which we compete for talent. We believe that a median pay positioning will allow us to attract and retain the needed level of talent for the organization while managing costs to an objectively reasonable level. Actual pay may be higher or lower than this target positioning overall based on company and individual performance. The target compensation for each executive may also be higher or lower than this market positioning based on such factors as individual skills, experience, contribution and performance, internal equity, or other factors that the Compensation Committee may take into account that are relevant to the individual executive.
123
Market for Talent. The Compensation Committee conducts an annual review of market pay practices for executive officers with the assistance of an outside compensation advisor. This review is based on several published compensation surveys and includes a broad selection of companies outside of our industry but that are similar in size and complexity to us. For 2006, the pay review targeted general industry pay practices for companies with approximately $2 billion in revenues, reflecting the increased scope of our worldwide operations.
Because there are no other North American iron ore mining companies of our size and few mining companies in general of our size, the Compensation Committee does not believe that it can establish a more targeted peer group of companies in our industry to evaluate for pay comparison purposes. However, the Compensation Committee has on occasion tested the general industry pay practices against a small group of companies in other mining sectors and other industrial companies in the Cleveland area. The results of these tests support the conclusion that the non-industry specific pay data used by us is a reasonable representation of the market for talent.
Pay Mix. Because the executive officers are in a position to directly influence our overall performance, a significant portion of their compensation is at risk through short- and long-term incentive programs. Our CEO, Mr. Carrabba, has the most pay at risk, with approximately 70 percent of his total compensation at risk. This includes the target annual incentive and target long-term incentive grant values, not benefits or retirement programs. All of the other named executive officers excluding the CEO have over 60 percent of their target total compensation at risk. These levels of pay at risk are consistent with each executive’s level of impact and responsibility and consistent with market practices for fixed versus variable pay.
Forms of Compensation. We use cash for salaries and for annual incentive plan payouts, consistent with market practices and the short-term nature of performance. For longer-term performance, we currently use performance shares, retention units, and restricted share grants to reward and retain executives. The retention units are denominated in our common shares and vary with our share price but are payable in cash. The performance shares and restricted share grants are denominated and payable in our common shares to align the interests of our executives with shareholders though direct ownership.
Each year, we establish a target long-term incentive award value for each executive based on market practices. Actual awards to each executive may vary +/- 25 percent from this target based on the CEO’s assessment of individual performance in the case of executives other than the CEO, and based on the Compensation Committee’s assessment of the CEO’s performance in the case of grants made to the CEO. In 2006, the Compensation Committee awarded 15 percent of the long-term incentive opportunity for each executive officer in the form of retention units. Each retention unit represents the value of one common share, which is payable in cash based on the participant’s continued employment throughout a three-year retention period. Retention units are guaranteed a payout at 100 percent of the original grant. The balance of each individual’s long-term incentive award was in the form of performance shares, with actual payouts tied to our TSR relative to industry peers over a three-year performance period (see below for further detail).
Restricted share awards were granted on a selective basis to senior executives during 2006 in recognition of the continued extremely positive industry conditions and our exceptional performance during the prior year. The CEO’s assessment of each individual’s current and future potential contribution was considered for grants to non-retirement eligible executives. For those individuals that were retirement eligible, the CEO considered the prior year’s exceptional performance. The restrictions on restricted shares normally lapse after three years of continued employment.
Other Factors. When making individual compensation decisions for executives, we take many factors into account, including the individual’s performance, tenure and experience, our performance overall, any retention concerns, the individual’s historical compensation, and internal equity considerations.
The Compensation Committee relies significantly on the CEOs’ input and recommendations when evaluating these factors relative to the executive officers other than the CEO. The Compensation Committee also reviews a five-year pay history for each executive and considers the progression of salary increases over time compared to the individual’s development and performance, the unvested and vested value inherent in outstanding equity awards, and the cumulative impact of all previous compensation decisions. The Compensation Committee uses the same factors in evaluating the CEO’s performance and compensation as it uses with the other executive officers.
124
Committee Process. All decisions relating to the CEO’s pay are made by the Compensation Committee in executive session, without management present. In assessing the CEO’s pay, the Compensation Committee considers our performance, the CEO’s contribution to that performance, and other factors as described above in the same manner as for any other executive. The Compensation Committee approves the CEO’s salary, incentive plan payment (consistent with the terms of the plan as described below) and long-term incentive awards each year.
For the other named executive officers, the CEO in partnership with Human Resources conducts an assessment of each executive at the end of each year against a spectrum of behaviors and specific goals established for each executive at the beginning of the year. The CEO then provides the Compensation Committee with his assessment of the performance of the executives and his perspective on the factors described above in developing his recommendations for each executive’s compensation, including salary adjustments, annual incentive payouts, and equity grants relative to the guidelines. The Compensation Committee discusses the CEO’s recommendations, including how the recommendations compare against the external market data and how the compensation levels of the executives compare to each other, to the CEO’s, and to the historic pay for each executive. Based on this discussion, the Compensation Committee then approves or modifies the recommendations in collaboration with the CEO.
Note on CEO Succession. Effective September 1, 2006, Mr. Brinzo was succeeded as CEO by Mr. Carrabba. Mr. Brinzo remained Chairman of the Board in a non-executive capacity. Unless otherwise noted, all discussion of CEO compensation refers to Mr. Carrabba. The compensation arrangements for Mr. Brinzo during 2006 were generally determined to reflect his transition to the non-executive Chairman role.
Elements of Compensation
We use multiple components to provide a competitive overall compensation and benefits package that is reasonable relative to market and industry practices and tied appropriately to performance.
Base Salary. Our philosophy is that base salaries should meet the objective of attracting and retaining the executive talent needed to run the business. Therefore, we seek to target base pay levels for executives at the 50th percentile of market survey data, although each executive may have a base salary above or below the median of the market. Actual salaries reflect responsibility, performance, and experience, among other factors described above.
Base salary adjustments can affect the value of other compensation and benefit elements. A higher base salary will result in a higher annual incentive, assuming the same level of achievement against goals. Base salaries also affect the level of performance-based contributions to the Cleveland-Cliffs Inc and its Associated Employers Salaried Employees Supplemental Retirement Savings Plan, a tax-qualified 401(k) Savings Plan, which we refer to as the Savings Plan, disability benefits, severance and change in control benefits, and pension benefits for those executives who participate in our pension plan.
For 2006, the Compensation Committee recognized our substantially increased size in terms of revenues, the increased complexity of the organization on a global basis, and the overall increase in our ability to pay for top talent due to the heightened level of profitability relative to prior years. The market benchmarks used by the Compensation Committee reflected these factors and as a result showed that executives were currently positioned below the competitive market median. In order to address this competitive shortfall, the Compensation Committee agreed to make market-based adjustments to salaries for most of the executives during 2006, in addition to the normal merit-based pay adjustments. The salaries shown for the named executive officers in the Summary Compensation Table below reflect such market adjustments, where applicable.
Annual Incentive Plan. We provide an annual Management Performance Incentive Plan, or MPI Plan, which provides an opportunity for the executive officers and other management employees to earn an annual cash incentive based on a bonus pool determined by our financial performance relative to business plans and achievement against key corporate objectives. The objective of this plan is to provide executives with a competitive annual cash compensation opportunity while aligning actual pay results with our short-term business performance.
125
Award Opportunities: The funded bonus pool for officers, including the named executive officers, can range from zero to a maximum of 200 percent of the officers’ aggregate target bonuses. The target annual incentive opportunity for the CEO was 100 percent of base salary in 2006 and for each of the other named executive officers the target incentive was 60 percent of base salary. These target award opportunities were increased from 2005 levels in recognition of our increased market scope and taking into consideration competitive compensation practices and base salary increases.
The target opportunity for Mr. Carrabba was prorated during 2006 based on his promotion to CEO. His target was 80 percent through the end of August and increased to 100 percent beginning September through December. Mr. Brinzo did not receive a performance-based bonus for 2006 under the MPI Plan as his annual incentive opportunity was incorporated into his retirement package as discussed below under “Additional Payments Upon Retirement”.
Upon approval of the Compensation Committee, an additional bonus pool of ten percent of target bonuses can be set aside for distribution at the discretion of the CEO, excluding payments to the CEO. When used, discretionary awards will reward participants whose contributions to achievement of our performance objectives exceeded expectations. Each of the named executive officers except Mr. Carrabba, Mr. Brinzo, and Ms. Brlas, the newly hired CFO, received a discretionary CEO payment under the MPI Plan for 2006, as reflected in the “Non-Equity Incentive Plan Compensation” column of the Summary Compensation Table below.
MPI Performance Measures: The MPI Plan uses a “performance scorecard” with multiple performance standards that are related to our annual business plan and current strategic priorities. For 2006, the Compensation Committee developed a scorecard targeted at those areas that it believes would most directly improve financial results for shareholders in the near term, while maintaining incentives for long-term strategic improvements. The elements and their respective weightings for 2006 were as follows:
| Objective |
Weight | ||
| Pre-Tax Earnings |
50 | % | |
| Adjusted Cost Control |
25 | % | |
| Corporate Objectives |
25 | % |
Pre-Tax Earnings is a measure of our profitability and is measured on a consolidated basis. Adjusted cost control is a measure of the cost of production per ton, adjusted to hold energy prices at a fixed rate throughout the year in order to eliminate the (positive and negative) impact of a large and potentially volatile uncontrollable cost on compensation. Although cost control is a component of pre-tax earnings, the Compensation Committee believes a more targeted focus on managing production cost per ton is essential to our long-term health. Adjusted Cost Control is measured only for North American operations, based on the Compensation Committee’s belief that cost control in this region was most critical to our success during 2006. Similarly, the Compensation Committee evaluates management on a subjective basis against key strategic and operational goals that are not as easily quantified as financial results, to ensure that short-term profitability is balanced with the long-term success of the organization. For 2006, Corporate Objectives included goals in the areas of business development, workforce planning, safety, specific cost initiatives, IT infrastructure development, and sales initiatives.
MPI Target Setting and 2006 Results: Performance targets for the financial objectives of the MPI Plan are established at the beginning of each year. Each metric has a threshold, target, and maximum goal, with a potential funding of between 0 percent and 200 percent of target. At threshold performance, each goal would be funded at 50 percent of target, with 0 percent funding for performance below threshold.
Each year, the Compensation Committee approves performance targets and ranges for each of the financial performance measures, taking into consideration management financial plans for the coming year, prior years’ performance, performance relative to steel companies and other metals and mining companies, and the relative degree of difficulty of attaining performance goals under different product-pricing scenarios. Performance targets are approved each year by the Compensation Committee early in the year, with an adjustment as necessary for the specific impact of world pellet price settlements on price escalators in our contracts. This price adjustment is formulaic and objective, tied directly to our term supply agreements.
126
For 2006, the MPI Plan was funded at 130 percent of the aggregate target bonuses. The Compensation Committee arrived at this funding level by taking the following factors into consideration:
| • | Preliminary results for 2006 pre-tax earnings were reviewed in early 2007 and compared to target performance levels set at the beginning of 2006 of $355 million and a minimum and maximum range of $285 million to $425 million (+/- 20 percent of target). Preliminary results were above target. The funding multiple for this factor was 178 percent of target. This factor was weighted 50 percent, resulting in funding of 89 percent of target bonuses. |
| • | Adjusted cost control was below the threshold established for the year, resulting in no funding for this performance factor (weighted 25 percent). |
| • | The Compensation Committee evaluated Corporate Objectives established at the beginning of the year and rated those objectives at a performance level of 164 percent. This factor was weighted 25 percent, resulting in funding of 41 percent of target bonuses. |
| • | Bonuses for 2006 under the MPI Plan were paid out in February 2007. Adjustments were subsequently made to pre-tax earnings as a result of the reversal of certain ore stockpile sales that occurred in December 2006. The Committee adjusted the 2007 MPI Plan targets to take into account these adjustments and their impact on 2007 pre-tax earnings to ensure that management does not receive a windfall in 2007 under the MPI Plan. |
In evaluating performance for the year, the Compensation Committee did evaluate and consider a number of additional performance factors that were not explicitly incorporated into the formulaic results for the year. These factors included:
| • | A poor performance rating in the area of safety due to three fatal injuries at our operations during 2006; and |
| • | The negative impact on bonuses of specific, intentional actions on the part of management that were in our best long-term interests yet resulted in missing the cost control thresholds (for example, forward-stripping of certain mining operations). |
Given our strong financial performance and overall strategic improvements made during the year, the Compensation Committee determined, in its discretion, that the formulaic results of 130 percent bonus funding represented the right outcomes given the balance of these other positive and negative factors.
The specific performance goals for Adjusted Cost Control is not disclosed as we believe, and the Compensation Committee concurs, that providing detailed information about our cost structure could limit our ability to negotiate supply agreements or spot sales on terms that would be favorable to our shareholders, thereby resulting in meaningful competitive harm. Likewise, we and the Compensation Committee believe that disclosing specific, non-quantitative Corporate Objectives for the year would provide detailed information on business operations and forward looking strategic plans to our customers and competitors that could result in substantial competitive harm.
The Compensation Committee did test the Adjusted Cost Control performance targets by comparing to business plans, past performance, and the impact of cost per ton on the range of pre-tax earnings goals, including the impact under different product-pricing scenarios. Based on these evaluations, the Compensation Committee believes that the range of performance objectives established for 2006 were relatively difficult to attain and represented a meaningful stretch. Corporate Objectives are subjective in nature and therefore the degree of difficulty cannot be readily quantified.
On March 13, 2007, the Compensation Committee and Board of Directors approved, subject to shareholder approval, the Executive Management Performance Incentive Plan, which we call the EMPI Plan, in order to provide annual incentive compensation to selected senior executive officers in such a method to qualify as “performance-based” compensation under Internal Revenue Section 162(m). Under the EMPI Plan, the Compensation Committee will determine the eligible participants and establish target levels of awards to be paid to participants upon the achievement of certain pre-determined performance objective(s) in compliance with
127
Section 162(m). The Compensation Committee will select the method for computing the amount of each award that a participant will be paid and such method will be stated in terms of an objective formula or standard. At the end of each plan year, the Compensation Committee will determine each participant’s award based on our performance against the relevant performance objective(s) for that plan year and will certify achievement of the objective(s) prior to payment of any award.
Long-Term Incentives. The objectives of our long-term incentives are to reward executives for sustained performance over multiple years while recognizing the potential volatility of industry conditions and limiting the potential for undue windfalls or losses to executives for factors outside of management’s control. In addition, our long-term incentive programs are designed to enhance retention of executives by delaying the vesting of compensation opportunities, and to align the long-term interests of executives with shareholders through the use of equity to deliver compensation.
Administrative Process: Long-term incentive awards for senior executives are generally made annually and are based on the executive’s position, experience, performance, prior equity-based compensation awards, and competitive equity-based compensation levels. The grant date is the date of the Compensation Committee approval or a later date as set by the Compensation Committee. Grants for new hires or promotions are approved by the Compensation Committee at the next regularly scheduled Compensation Committee meeting following the hire or promotion date or in a special meeting, as needed. The grant date for new hire or promotional grants is the date of such approval or such later date as the Compensation Committee determines. We do not time grants to coordinate with the release of material non-public information.
As with base salaries, the review of market practices in 2006 indicated that we were below the desired market pay positioning for total compensation, including long-term incentives. As a result, the Compensation Committee approved increases to the grant guidelines for 2006 based on market pay practices.
To facilitate the administration of the program, the Compensation Committee delegates to the CEO the authority to grant long-term incentive awards to employees who are not executive officers or mine managers. For 2006, the delegated authority included 7,500 shares approved at the May 2006 meeting. This authority was delegated to Mr. Brinzo in his role as CEO during 2006. Such grants are made at the same time as the annual grants to the executives, as approved by the Compensation Committee.
Performance Share Program: Performance shares are the primary vehicle used by us to deliver long-term incentives. A performance share is the opportunity to earn a common share based on our performance over a three-year period, with potential funding of between 0 percent and 150 percent of the target share grant depending on the level of performance against goals. We use performance shares to reward for shareholder results relative to industry conditions, taking into consideration returns to shareholders as compared to other companies in the steel and mining industries.
Specifically, each executive officer is granted a target number of performance shares at the beginning of each three-year period. The TSR for us and our performance peers identified below is then measured quarterly on a cumulative basis since the beginning of the performance period, and we are ranked relative to peers at the end of each quarter. At the end of three years, we calculate the average of these quarterly percentile rankings of TSR performance relative to peers to determine the total performance over the three-year period and the number of shares earned at the end of the period. The calibration of the pay for performance relationship is as follows:
| Performance Factor |
Performance Level | |||||
| Threshold |
Target | Maximum | ||||
| Relative TSR |
35th%ile | 55th%ile | 75th%ile | |||
| Payout |
50% | 100% | 150% | |||
| Pre-Tax RONA |
Calculated payout reduced 50% if RONA is below 12% at the end of the three year period (approximately equivalent to the cost of capital on a pre-tax basis) | |||||
On March 12, 2007, the Compensation Committee adopted a new methodology for the calculation of payment of performance shares in connection with the EMPI Plan. Participants in the LTIP also have the option
128
to have the new methodology apply to their outstanding performance share grants. See the discussion under “Grants of Plan Based Awards” for more information on this change in methodology.
Funding for performance below threshold will be 0 percent. An absolute threshold is also provided for Return on Net Asset, which we refer to as RONA, performance. If average RONA is below a minimum standard (intended to approximate the cost of capital) over the three years of the plan, then any payouts will be reduced by 50 percent regardless of relative TSR. RONA is defined as pre-tax income divided by average assets less average current liabilities, excluding short-term debt included in current liabilities, for each year of the plan.
Prior to 2005, the performance share plan included a RONA component that provided upside and downside opportunity independent of the relative TSR components, as well as a discretionary modifier for performance against strategic initiatives. The RONA goal also had a minimum, target, and maximum performance range weighted 50 percent along with Relative TSR and provided for a potential payout range of 0 percent to 75 percent of the target shares. This feature was eliminated by the Compensation Committee in favor of a RONA threshold beginning with grants made in 2005.
Prior to 2006, the performance share plan had an absolute cap so that the value of the final shares earned could be no more than twice the value at the time of grant. Therefore, if the share price increased more than 100 percent over any three-year period, the number of shares actually paid would be reduced so that the value realized by each executive was capped at 100 percent share price growth. The Compensation Committee determined that this value cap was unduly limiting the recognition of exceptional company performance and also inconsistent with market practices. In addition, the Compensation Committee believes that limiting the value to be realized by management through share price appreciation is inconsistent with the goal of aligning executive rewards with shareholder interests. Therefore, the Compensation Committee eliminated this cap as a plan feature for the 2006 grant.
The performance peer group used for the relative performance share plan during the 2006-2008 cycle is as follows:
| AK Steel Holding Corp. | Gibraltar Industries | Reliance Steel & Aluminum | ||
| Algoma Steel Inc. | INCO Ltd. | Rio Tinto plc | ||
| BHP Billiton | IPSCO Inc. | Ryerson Inc. | ||
| Carpenter Technology | Mittal Steel Company NV | Southern Copper | ||
| Commercial Metals | Nucor Corp. | Steel Dynamics Inc. | ||
| CVRD | Oregon Steel Mills Inc. | USX | ||
| Gerdau Ameristeel Corp. | Phelps Dodge Corp. | Worthington Industries |
The peer group currently focuses on steel, metals, and commodity mineral mining companies that will be generally affected by the same long-term market conditions as we are. The Compensation Committee evaluates this peer group for each new cycle of the performance share plan and makes adjustments as needed based on changes in the industry makeup and relevance of our specific peers. During a cycle, any peer that is acquired, files for bankruptcy, or otherwise ceases to trade on a major stock exchange will be excluded from the calculation of relative performance for each quarter subsequent to the de-listing event.
In January 2007, the Compensation Committee determined that, for the three-year performance period ended December 31, 2006, we achieved an average performance of 75 percent with respect to our objective for TSR, 75 percent with respect to our RONA, and +25 percent with respect to accomplishment of strategic objectives. This provided a total performance factor of 175 percent for the 2004 through 2006 performance period. However, based on the application of the maximum value cap in place for grants before 2006, the actual payout was reduced to 71 percent of the uncapped value. A payout for such performance period was made in common shares on March 1, 2007 to Messrs. Gunning, Calfee, Gallagher, and Brinzo with a distribution date of February 26, 2007. The performance share award for the named executive officers for the 2004 through 2006 performance period is disclosed under the “2006 Option Exercises and Stock Vested” table in footnote 5.
Retention Units: Starting in 2000, the Compensation Committee began granting a part of the performance share grants as retention units. The retention awards included in the Long Term Incentive Program, or LTIP, assist us in retaining key executives throughout industry cycles by providing a minimum floor to the long-term
129
incentive opportunity based solely on executives remaining with us. In 2006, the Compensation Committee awarded executive officers 15 percent of their long-term incentive opportunity in the form of retention units. Each retention unit represents the value of one common share and is payable in cash based upon the participant’s continued employment throughout the three-year retention period.
During 2006, the retention units granted on February 1, 2004 to the named executive officers employed on that date vested on December 31, 2006 and were paid out in cash on March 1, 2007, as shown in footnote 6 under the “2006 Option Exercises and Stock Vested Table.” Our closing share price on December 29, 2006 of $48.44 per share was used to determine the value of this payout.
Restricted Share Grants: During 2006, the Compensation Committee approved extraordinary restricted share grants for each of the named executive officers, excluding Ms. Brlas. The purpose of these grants was, in part, to reward for extraordinary past performance that, in the judgment of the Compensation Committee, was not otherwise fully recognized in the existing incentive plans. In addition, and at the direction of the Compensation Committee, the size and distribution of these grants for each individual was determined based on the CEO’s assessment of current and future potential contribution to us. Each restricted share grant vests at the end of three years for Messrs. Carrabba, Gunning, and Gallagher.
Since restricted share grants became immediately taxable for retirement eligible participants, which included Messrs. Brinzo and Calfee in 2006, one-half or their grant value was delivered in the form of restricted shares (with immediate vesting because they are retirement eligible) and one-half in the form of cash. The cash portion of the grant is reflected in the “2006 Summary Compensation Table” under the “Bonus” column for Messrs. Brinzo and Calfee.
On March 13, 2007, the Compensation Committee and Board of Directors approved, subject to shareholder approval, the 2007 Incentive Equity Plan, which we refer to as the 2007 ICE Plan, to replace the existing incentive plans. The 2007 ICE Plan authorizes a certain amount of common shares to be issued as stock options, stock appreciation rights, restricted shares, restricted share units, retention units, deferred shares, performance shares, or performance units. The Compensation Committee will have the power and authority to administer the 2007 ICE Plan, to interpret the terms and intent of the 2007 ICE Plan, determine eligibility for and the terms of awards for participants, and make all other determinations for the administration of the 2007 ICE Plan.
Retirement and Deferred Compensation Benefits
Defined Benefit Pension Plan: We maintain a defined benefit pension plan, which we refer to as the Pension Plan, and a supplemental executive retirement program, which we refer to as the SERP and in which all of the named executive officers are eligible for participation following one year of service. The Compensation Committee believes that pension benefits are a typical component of total remuneration for employees and executives in industries similar to ours and that providing such benefits is important to delivering a competitive package to retain employees. The objective of the SERP is to provide benefits above the statutory limits for qualified pension plans for highly paid executives.
In July 2003, benefit levels under the prior final-average pay defined benefit pension formula for all salaried employees were frozen, and participants began accruing benefits under a new cash-balance pension formula. This change was made and based upon market practices as a means of reducing our current pension obligations given the difficult performance environment at the time.
During 2006, the Compensation Committee approved an adjustment to the previous and future accruals under the Pension Plan and the SERP. Specifically, with guidance from the plan actuary, the Compensation Committee determined that the transition date for the final average pay formula would be retroactively shifted from July 2003 to July 2008. This change will provide up to five more years of service and pay in both the qualified defined benefit formula and the SERP for named executive officers employed prior to June 30, 2003. In addition, the Compensation Committee approved increasing the pay credits and interest credits for the cash balance formula to reflect current market norms. These changes were made for both the Pension Plan and the SERP in order to ensure that retiree benefits stay competitive with the marketplace and to lessen the risk of turnover of key employees.
130
In evaluating these changes as they impacted our named executive officers, the Compensation Committee considered market practices, our financial history, the specific impact on these changes for each executive individually and on a relative basis to each other, and the total compensation pay history for each executive to ensure that the Compensation Committee had not previously provided other compensation elements to executives that would mitigate the need to enhance the pension arrangements. The impact on each of the named executive officers affected by these changes is reflected in the “2006 Summary Compensation Table” in the “Change in Pension Value and Nonqualified Deferred Compensation Earnings” column. Other details about the benefits are described in the narrative accompanying the “2006 Pension Benefits” table that is included below.
Deferred Compensation Plan: Under the Voluntary Non-Qualified Deferred Compensation Plan, which we refer to as the VNQDC Plan, the named executive officers and other senior management employees are permitted to defer, on a pre-tax basis, up to 50 percent of their base salary, all or a portion of their annual incentive under the MPI Plan, and their share award or cash award which may be payable under the LTIP. The Compensation Committee believes the opportunity to defer compensation is a competitive benefit and addresses the goal of attracting and retaining talent.
Cash awards can be deferred into a cash deferral account or a stock unit account. Stock awards can only be deferred into stock units. Cash deferrals earn interest at the Moody’s Corporate Average Bond Yield rate. Unit deferrals are denominated in our common shares and vary with our share price performance.
In order to encourage stock ownership and the alignment of executive interests with shareholder interests, as well as to assist executives in meeting their share ownership guidelines, any cash compensation awards deferred into stock units are matched with a 25 percent Company match that vests at the end of five years. During 2006, none of the named executive officers received such a deferred compensation match in our common shares.
Finally, the VNQDC Plan provides that if a participant is entitled to receive a performance-based contribution under the Savings Plan but is limited in the amounts that can be contributed to the Savings Plan by certain Internal Revenue Code limitations, then any such performance-based contributions in excess of the Internal Revenue Code limits are deferred into the VNQDC Plan. These specific cash accounts are not convertible to stock units.
Other benefits: Our other benefits and perquisites for senior executives include company paid parking, personal financial services, and company paid club memberships. In addition, Mr. Brinzo received reimbursement for post-retirement secretarial services. The Compensation Committee believes these benefits are competitive and reasonable and generally support the goal of attracting and retaining talent. These benefits are disclosed below in the “2006 Summary Compensation Table” under “All Other Compensation” and described in footnote 5.
Supplementary Compensation Policies. We use several additional policies to ensure that the overall compensation structure is aligned with shareholder interests and competitive with market practices. Specific policies include:
Stock Ownership Guidelines: The Board of Directors adopted stock ownership guidelines to ensure that senior executives have a meaningful direct ownership stake in Cleveland-Cliffs and that the interests of executives are thereby aligned with shareholders. The guidelines call for the CEO to own shares equal in value to four-and-a-half (4.5) times annual base salary. Other executives, depending on their level, are required to hold between one-and-a-half (1.5) and two-and-a-half (2.5) times annual base salary in shares. For awards made after January 1, 2007, executives are not permitted to sell shares received under the Performance Share Program unless the executive is in compliance with the ownership guidelines except as may be necessary to pay income taxes. An officer’s direct ownership of shares, including restricted shares and stock units held in the VNQDC Plan, count toward meeting the ownership guidelines.
Severance and Change in Control Agreements: We have entered into severance agreements with all of the named executive officers that provide for certain payments upon termination following a change in control. The Compensation Committee believes that such agreements support the goals of attracting and retaining highly talented individuals by clarifying the terms of employment and reducing the risks to the executive in situations where the executive believes that Cleveland-Cliffs may undergo a merger or be acquired. In addition, the Compensation Committee believes that such agreements align the interests of executives with the interests of
131
shareholders if a qualified offer to acquire us is made, in that each of the named executive officers would likely be aware of or involved in any such negotiation and it is to the benefit of shareholders to have the executives negotiating in our best interests without regard to their personal financial interests.
The agreements generally provide for the following change-in-control provisions (see accompanying narrative below for more details):
| • | Automatic vesting of unvested equity incentives upon change-in-control |
| • | Three (3) times annual base salary and target annual incentive as severance upon termination following a change in control, and continuation of welfare benefits for three years |
| • | Full tax gross-up payments on any excise taxes imposed upon any change in control payments |
| • | Non-compete, confidentiality, and non-solicitation provisions for executives who receive severance payments following a change in control |
Exchange Act Rule 10b5-1 plans: Both Mr. Brinzo and Mr. Calfee each have entered into Rule 10b5-1 Trading Plans with a third-party broker. The objective of these plans is to allow the executives who may otherwise be subject to trading restrictions due to potential insider knowledge of Cleveland-Cliffs to sell a specified number of shares on specified dates and at specified prices without regard to whether there is a trading blackout in effect. By entering into a plan in advance with a third-party broker and by eliminating the personal ability to time the sales of common shares, executives with such plans can legally sell shares without running the risk of violating insider trading rules. Mr. Brinzo has completed the sales under the term of his Rule 10b5-1 Plan as of December 18, 2006.
Our General Counsel has been duly notified that such plans were being entered into. The Compensation Committee believes that such plans are fair and reasonable for executives who have met the share ownership guidelines and does not have any policy or practice to restrict named executive officers from entering into such arrangements.
Other Material Tax and Accounting Implications: Section 162(m) of the Internal Revenue Code limits the deductibility of certain executive compensation in excess of $1 million. The aggregate combination of distributions from the MPI Plan, LTIP, vesting of restricted shares, and dividends on restricted shares, and the separation package for Mr. Brinzo, has caused, with respect to 2006, the $1 million limit to be exceeded with respect to five of the named executive officers, and will cause the $1 million limit to be exceeded in subsequent years with respect to one or more of the named executive officers. While we believe that it is important to maintain compensation programs that are competitive and motivate executives irrespective of the deductibility of such payments under the Internal Revenue Code, we have adopted, subject to shareholder approval, the Executive Management Performance Incentive Plan, also known as the EMPI Plan, and the 2007 ICE Plan to replace the existing plans with plans where performance based compensation will be exempt from the $1 million limit. Even with the adoption of these new plans, retention units and restricted share grants will still not qualify as performance based compensation and thus will not be excluded from the calculation of the $1 million limit.
Summary Compensation Table
The following table sets forth the compensation earned by the named executive officers for services rendered to us and our subsidiaries for the fiscal year ended December 31, 2006.
The table discloses compensation information for the CEO, Joseph A. Carrabba, the CFO, Laurie Brlas, the three highest paid other employees on December 31, 2006, David H. Gunning, William R. Calfee and Donald J. Gallagher, and the former CEO, John S. Brinzo, who retired on September 1, 2006.
This table discloses in column (c) the salary of each named executive officer. “Salary” under column (c) includes base salary before salary reduction contributions to Benefits Choice Plan, which provides health, life and disability benefits, salary reduction contributions to our Savings Plan and salary reduction contributions to our VNQDC Plan. The Savings Plan and VNQDC Plan are described more fully in the “Compensation Discussion and Analysis” section above.
132
Column (d) of the table, “Bonus”, discloses non-incentive special payments to certain executives whether such payments were designated bonus or not. Such payments include payments to Mr. Calfee and Mr. Brinzo in cash of 50 percent of the award each of them would otherwise have received as restricted shares under the Cleveland-Cliffs Inc 1992 Incentive Equity Plan, which we refer to as the ICE Plan. Since the restricted share agreements do not forfeit the restricted shares of employees who retire, both Mr. Calfee and Mr. Brinzo, who are retirement eligible, were taxed on the value of the restricted shares on the date of grant. The payment of 50 percent of the award in cash was intended to assist them in paying the taxes on the restricted shares award. Column (d) also includes a special signing bonus and guaranteed bonus payable to Ms. Brlas who was employed as our CFO and Treasurer on December 11, 2006. Amounts payable to the named executive officers under our annual bonus program, the MPI Plan, are not shown in column (d) but are instead shown under column (f), “Non-Equity Incentive Plan Compensation.”
Column (e) of the table, “Stock Awards,” reflects the dollar amount recognized for financial statement reporting purposes for the fiscal year ended December 31, 2006 in accordance with SFAS 123(R) of performance shares held by the named executive officers. Performance shares vest and become payable at the end of a three-year performance period. The performance share grants are described more fully in the “Compensation Discussion and Analysis” section above.
Column (e) of the table, “Stock Awards,” also reflects an amount under SFAS 123(R) relating to performance shares granted to the named executive officers under our LTIP which retention units are measured by the value of our common shares but are payable in cash rather than common shares. Such retention units vest and become payable at the end of the third year in the three-year period that includes the date of grant. The retention units are described more fully in the “Compensation Discussion and Analysis” section above.
In addition, column (e) of the table, “Stock Awards,” reflects the amount under SFAS 123(R) relating to restricted shares held by the named executive officers under our ICE Plan which restricted shares normally vest and the restrictions lapse at the end of the third year in the three-year period that includes the date of grant. The restricted share awards are described more fully in the “Compensation Discussion and Analysis” section above.
As noted above, column (f), “Non-equity Incentive Plan Compensation,” includes amounts payable to the named executives under our annual bonus program, the MPI Plan. The MPI Plan is described more fully in the “Compensation Discussion and Analysis” section above. Column (f) also includes the amount of performance based contribution credited to the accounts of the named executive officers under our Savings Plan and our VNQDC Plan for 2006. Such performance based contribution is made on behalf of all salaried employees and is equal to 10 percent of 401(k) eligible wages for all salaried employees for 2006. To the extent that such contribution caused the total contributions to the Savings Plan to exceed certain Internal Revenue Code limitations, the balance of the contribution was credited to the accounts of the named executive officers under the VNQDC Plan.
Column (g) of the table, “Change in Pension Value and Nonqualified Deferred Compensation Earnings,” includes accruals under our Pension Plan and our SERP. There were no above-market or preferential earnings on compensation deferred on a basis that is not tax-qualified, including such earnings on nonqualified defined contribution plans. As a consequence, no earnings on nonqualified deferred compensation are included in column (g). The Pension Plan and SERP are described more fully in the “Compensation Discussion and Analysis” section above and before the Pension Benefits tables below.
Column (h) of the table, “All Other Compensation,” shows the combined value of the named executive officers’ perquisites. These perquisites include payments by us for parking, financial services, club memberships, and post-retirement secretarial services. Column (h) also includes matching contributions to the Savings Plan and the VNQDC Plan. Additionally, for Mr. Brinzo, column (h) includes a special retirement/severance payment due to his retirement on September 1, 2006. Other benefits are described more fully in the “Compensation Discussion and Analysis” section above and before the Pension Benefits tables below.
On average, salary accounted for 12 percent of the named executive officers’ total compensation.
133
2006 Summary Compensation Table
| Name and Principal Position (a) |
Year (b) |
Salary (c) |
Bonus (d) |
Stock Awards (e) |
Non-Equity Incentive Plan (f) |
Change in (g) |
All Other Compensation (h) |
Total ($) (i) | |||||||||||
| Joseph A. Carrabba |
2006 | 520,833 | (6) | 1,281,779 | 752,083 | 125,300 | 93,700 | 2,773,695 | |||||||||||
| Chairman, President and Chief Executive Officer |
|||||||||||||||||||
| Laurie Brlas |
2006 | (7) | 22,228 | 399,700 | (8) | 422 | 2,222 | 502 | 425,074 | ||||||||||
| Sr. Vice President and Chief Financial Officer and Treasurer |
|||||||||||||||||||
| David H. Gunning |
2006 | 426,250 | (6) | 1,390,380 | 397,625 | 313,800 | 12,673 | 2,540,728 | |||||||||||
| Vice Chairman of the Board |
|||||||||||||||||||
| William R. Calfee |
2006 | 331,750 | (6) | 375,000 | (9) | 742,087 | 318,175 | 528,700 | 39,776 | 2,335,488 | |||||||||
| Executive Vice President—Commercial North American Iron Ore |
|||||||||||||||||||
| Donald J. Gallagher |
2006 | (10) | 339,583 | (6) | 1,061,740 | 349,167 | 618,900 | 23,319 | 2,392,709 | ||||||||||
| President North American Iron Ore and former Chief Financial Officer |
|||||||||||||||||||
| John S. Brinzo |
2006 | (11) | 531,250 | (12) | 750,000 | (9) | 2,587,530 | 44,791 | 2,734,200 | 1,188,049 | 7,835,820 | ||||||||
| Former Chairman of the Board and Former Chief Executive Officer |
|||||||||||||||||||
| (1) | Columns (c), (e) and (f) reflect the salary, equity compensation, and non-equity incentive compensation of each named executive officer before pre-tax reductions for contributions to the Savings Plan and/or the VNQDC Plan. Amounts by which salary, equity compensation and non-equity incentive compensation were reduced pursuant to the named executive officers’ elections to make contributions to the VNQDC Plan appear in column (b) of the “2006 Nonqualified Deferred Compensation” table below. |
| (2) | The amounts in column (e) reflect the dollar amount recognized for financial statement reporting purposes for the fiscal year ended December 31, 2006, in accordance with SFAS 123(R), of awards of restricted shares, performance shares and retention units, and thus includes amounts from awards granted in and prior to 2006. For additional information, refer to note 11 to our financial statements in Item 8 of this Form 10-K. These types of awards are discussed in further detail in the “Compensation Discussion and Analysis” section above under the headings “Performance Share Program,” “Retention Units,” and “Restricted Stock Grants.” See the “2006 Grants of Plan-Based Awards” table for more detail on the awards of restricted shares, retention units and performance shares. |
| (3) | The amounts in column (f) reflect the sum of (i) incentive bonus awards that were earned in 2006 under the MPI Plan, which is discussed in further detail in the “Compensation Discussion and Analysis” section above under the heading “Annual Incentive Plan,” and were paid in cash to the named executive officers February 13, 2007, and (ii) amounts allocated to the named executive officers as performance-based contributions under the Savings Plan, which equaled in 2006 for all participants in the Savings Plan 10 percent of their 401(k) eligible wages. To the extent that such performance-based contributions exceeded Internal Revenue Code limits for a qualified profit sharing plan, they were credited to the accounts of the executives under the VNQDC Plan. The amounts of incentive bonus for the named executive officers were: Carrabba — $700,000; Gunning — $355,000; Calfee — $285,000; and Gallagher — $315,000. The amounts representing the performance-based contributions under the Savings Plan and/or the VNQDC Plan for the named executive officers are: Carrabba — $52,083; Brlas — $2,222; Gunning — $42,625; Calfee — $33,175; Gallagher — $34,167; and Brinzo — $44,791. |
| (4) | The amounts in column (g) reflect the actuarial increase in the present value of the named executive officer’s benefits under the Pension Plan and the SERP, both of which are discussed in further detail in the “Compensation Discussion and Analysis” section above under the heading “Defined Benefit Pension Plan,” determined using interest rate and mortality assumptions consistent with those used in our financial statements and may include amounts that the named executive officer is not currently entitled to receive because his or her benefits are not fully vested. The increase in the value of the benefits of the named executive officers under the Pension Plan were: Carrabba — $15,900; Gunning — $96,600; Calfee — $42,200; Gallagher — $180,200; and Brinzo — $107,300. The increase in the value of the benefits of the named executive officers under the SERP were: Carrabba — $109,400; Gunning — $217,200; Calfee — $486,500; Gallagher — $438,700; and Brinzo — $2,626,900. No amounts are included in column (g) representing above market interest on deferred compensation. |
134
| (5) | The amounts in column (h) reflect the combined value of the named executive officer’s perquisites attributable to our paid parking, financial services, club memberships, post-retirement secretarial services, matching contributions made by us on behalf of the executives under the Savings Plan and the VNQDC Plan, and in the case of Mr. Brinzo, a special $1,000,000 retirement/severance payment made by reason of his retirement on September 1, 2006. Mr. Brinzo also received $130,000 to reflect the accrued pension benefit that Mr. Brinzo would have had if the aforementioned payment had been recognized as pensionable under the cash balance formula in the Company’s Pension Plan. Additional information on this payment is located under “Additional Payments Upon Retirement” below. The values of our paid parking for the named executive officers are: Carrabba — $2,328; Brlas — $194; Gunning — $2,328; Calfee — $2,328; Gallagher — $2,328; and Brinzo — $1,552. The amounts paid for financial services for the named executive officers are: Carrabba — $3,700; Brlas — $308; Calfee — $7,200; Gallagher — $7,596; and Brinzo — $7,460. The amounts paid for club memberships for the named executive officers are: Carrabba — $67,539; Gunning — $2,660; Calfee — $17,815; Gallagher — $4,595; and Brinzo — $42,537. The amount paid for post-retirement secretarial services for Mr. Brinzo was estimated to be approximately $1,000. The amounts paid as matching contributions under the Savings Plan for the named executive officers are: Carrabba — $7,431; Gunning — $7,685; Calfee—$8,800; Gallagher — $8,800; and Brinzo — $5,500. The amounts paid as matching contributions under the VNQDC Plan are: Carrabba — $12,702 and Calfee — $3,633. |
| (6) | The salary of the named executive officers includes their base salary before salary reductions for the Benefits Choice Plan, the Savings Plan, and the VNQDC Plan. The base salary of the named executive officers were: Carrabba — $520,833; Gunning — $426,250; Calfee — $331,750; and Gallagher — $339,583. The 401(k) salary deferrals of the named executive officers were: Carrabba — $8,263; Gunning — $8,770; Calfee — $14,300; and Gallagher — $11,000. The catch-up 401(k) salary deferrals of the named executive officers were: Carrabba — $4,800; Gunning — $5,000; Calfee — $4,991; and Gallagher — $5,000. The pre-tax contributions for compensation earned in 2006 and deferred into the VNQDC Plan for the named executive officers were: Carrabba — $36,667; Calfee — $11,611; and Gallagher — $45,000. |
| (7) | Ms. Brlas commenced employment with us on December 11, 2006 as Senior Vice President — Chief Financial Officer and Treasurer. |
| (8) | The amount shown in column (d) for Ms. Brlas reflects a signing bonus of $115,000 plus a MPI Plan bonus of $284,700. The MPI Plan bonus was intended to compensate her for the loss of a bonus from her prior employer. |
| (9) | Upon the granting of restricted shares on May 8, 2006, certain executives were then eligible to retire without forfeiting the restricted shares thereby resulting in the restricted shares being taxable to the executive immediately rather than when the restrictions lapsed. For such executives, it was determined to pay an amount in cash in lieu of half of the restricted shares that would otherwise be granted to the executive. Such cash would provide the executives with sufficient funds to pay federal, state and local income taxes on the total value of the restricted shares and the cash payment. The amounts in column (d) for Mr. Calfee and Mr. Brinzo reflect the cash paid, in lieu of one-half of the restricted shares which would have otherwise been granted to them. |
| (10) | Mr. Gallagher served as our Chief Financial Officer and Treasurer for part of 2006. |
| (11) | Mr. Brinzo served as our Chief Executive Officer and Chairman of the Board through September 1, 2006, at which time he retired from our employment and as our Chief Executive Officer. From September 1, 2006 until May 8, 2007, Mr. Brinzo had served as a non-employee Chairman of the Board. |
| (12) | The amount shown in column (c) for Mr. Brinzo is the salary paid to him as Chief Executive Officer and Chairman of the Board through August 31, 2006, $447,917, and the retainer paid to Mr. Brinzo as Chairman of the Board after August 31, 2006, $83,333. Mr. Brinzo’s salary is his base salary before salary reductions as described above. |
Grants Of Plan Based Awards
This table discloses in columns (d), (e) and (f) the potential payouts at the Threshold, Target and Maximum levels of the awards under the MPI Plan for 2006. See the “Compensation Discussion and Analysis” section above for a description of the MPI Plan. As is shown in footnotes (3) and (8) to the “2006 Summary Compensation Table”, the actual payouts for the named executive officers were: Carrabba — $700,000; Brlas — $284,700; Gunning — $355,000; Calfee — $285,000; and Gallagher — $315,000. The amount for Mr. Brinzo below is the proposed MPI payment approved by the Compensation Committee in early 2006. Upon Mr. Brinzo’s retirement on September 1, 2006, the MPI Plan award of Mr. Brinzo was cancelled, and he was paid $1,000,000 in lieu of the MPI Plan award and in lieu of salary he would have received had he remained an employee and CEO until May 2007.
This table also shows in columns (g), (h) and (i) the potential payouts at the Threshold, Target and Maximum levels of the 2006 performance share awards under the LTIP. Such performance shares are for a three-year period ending December 31, 2008.
The table also shows in columns (j) and (k) the actual numbers of awards granted and the grant date fair value of (1) restricted share awards under our ICE Plan and (2) retention units under our LTIP. The 2006 restricted share awards vest March 14, 2009 and the 2006 retention units will vest at the end of a three-year period ending December 31, 2008. Amendments to Mr. Brinzo’s restricted share agreements allowed his forfeitable restricted shares to vest May 9, 2007, the day following the Company’s May 2007 Board meeting.
135
The table does not show any stock option grants because we did not grant any stock options during 2006.
2006 Grants Of Plan-Based Awards
| Name (a) |
Grant (b) |
Approval (c) |
Estimated Future Payouts under Non-Equity Incentive Plan Awards (1) |
Estimated Future Payouts under Equity Incentive Plan Awards(2) |
All (j) |
Grant (k) | |||||||||||||||||||
| Threshold (d) |
Target (e) |
Maximum (f) |
Threshold (g) |
Target (h) |
Maximum (i) |
||||||||||||||||||||
| Joseph A. Carrabba |
3/14/2006 | $ | 233,333 | $ | 466,667 | $ | 933,334 | ||||||||||||||||||
| 3/14/2006 | 27,906 | $ | 1,179,517 | ||||||||||||||||||||||
| 5/8/2006 | 7,055 | 14,110 | 21,165 | 2,490 | $ | 789,870 | |||||||||||||||||||
| 9/1/2006 | (3) | 8/17/2006 | 7,055 | 14,110 | 21,165 | 2,490 | $ | 616,275 | |||||||||||||||||
| Laurie Brlas |
12/11/2006 | 11/13/2006 | $ | 219,000 | $ | 219,000 | $ | 438,000 | |||||||||||||||||
| 12/11/2006 | (4) | 11/13/2006 | 3,400 | 6,800 | 10,200 | 1,200 | $ | 384,720 | |||||||||||||||||
| David H. Gunning |
3/14/2006 | $ | 130,500 | $ | 261,000 | $ | 522,000 | ||||||||||||||||||
| 3/14/2006 | 20,930 | $ | 884,659 | ||||||||||||||||||||||
| 5/8/2006 | 5,185 | 10,370 | 15,555 | 1,830 | $ | 580,507 | |||||||||||||||||||
| William R. Calfee |
3/14/2006 | $ | 100,500 | $ | 201,000 | $ | 402,000 | ||||||||||||||||||
| 3/14/2006 | 8,720 | $ | 368,573 | ||||||||||||||||||||||
| 5/8/2006 | 3,315 | 6,630 | 9,945 | 1,170 | $ | 371,144 | |||||||||||||||||||
| Donald J. Gallagher |
3/14/2006 | $ | 112,500 | $ | 225,000 | $ | 450,000 | ||||||||||||||||||
| 3/14/2006 | 17,442 | $ | 737,230 | ||||||||||||||||||||||
| 5/8/2006 | 3,570 | 7,140 | 10,710 | 1,260 | $ | 399,693 | |||||||||||||||||||
| John S. Brinzo |
3/14/2006 | 350,000 | 700,000 | 1,400,000 | |||||||||||||||||||||
| 3/14/2006 | 17,442 | $ | 737,230 | ||||||||||||||||||||||
| 5/8/2006 | 13,175 | 26,350 | 39,525 | 4,650 | $ | 1,475,058 | |||||||||||||||||||
| (1) | Except as otherwise indicated below, the amounts in column (d) reflect the threshold payment level under the MPI Plan, which is 50 percent of the target amount shown in column (e). The amount shown in column (f) is 200 percent of such target amount. These amounts are based on the individual’s current salary and position. Ms. Brlas’ employment contract guarantees 100 percent of the target amount shown in column (e) for 2006. |
| (2) | The amounts in column (g) reflect the threshold payout level of performance shares under the LTIP, which is 50 percent of the target amount shown in column (h). The amount shown in column (i) is 150 percent of such target amount. |
| (3) | Mr. Carrabba was given a special award of 14,110 performance shares and 2,490 retention units on September 1, 2006, when he became CEO. |
| (4) | In connection with beginning her employment on December 11, 2006, Ms. Brlas was granted 6,800 performance shares and 1,200 retention units on such date. |
Change in Calculation Methodology for Performance Shares
In connection with the adoption of the EMPI Plan, the Compensation Committee adopted a new methodology for calculating the payment of performance shares. Under the LTIP, a portion of the calculation was based on a cumulative quarter-by-quarter basis calculation of TSR. Under the EMPI Plan, this portion of the calculation will be eliminated, and the calculation will instead be based on cumulative TSR between the start and end of the performance period. The Compensation Committee has also given participants in the LTIP the option of having the old or new methodology apply to their outstanding performance shares for the 2005-2007 and 2006-2008 performance periods. Ms. Brlas and Messrs. Carrabba and Gunning have elected to apply the new methodology to their outstanding grants, and Messrs. Brinzo, Calfee, and Gallagher have elected to continue to have the old methodology apply to their outstanding grants. While the total impact of this change cannot be calculated at this time given the applicable performance periods have not been completed, the new methodology to date would result in a slightly lower TSR performance factor for the 2005-2007 performance period and a slightly higher TSR performance factor for 2006-2008 performance shares.
136
Outstanding Equity Awards At Fiscal Year-End
The following table shows in columns (b) and (c) the actual numbers of shares, and the fair market value of all (1) unvested restricted share awards under our ICE Plan and (2) unvested retention units under our LTIP outstanding on December 31, 2006. The fair market value of each restricted share and retention unit on December 31, 2006 was $48.44.
The table also shows in columns (d) and (e), for the named executive officers, the actual numbers of performance shares and the fair market value as of December 31, 2006 of all unvested and unearned performance shares assuming a market value of $48.44 per share (the closing market price of our common shares on December 29, 2006) and assumes that the performance shares pay off at the target level.
2006 Outstanding Equity Awards At Fiscal Year-End Table(1)
| Stock Awards | ||||||||||||
| Name (a) |
Number of Shares or (b) |
Market Value of Shares or ($) (c) |
Equity Incentive Plan (d) |
Equity Incentive Plan Awards: ($) (e) | ||||||||
| Joseph A. Carrabba |
5,066 | (3) | $ | 245,397 | 6,460 | (4) | $ | 312,922 | ||||
| 27,906 | (5) | 1,351,767 | 14,110 | (6) | 683,488 | |||||||
| 1,140 | (7) | 55,222 | 14,110 | (9) | 683,488 | |||||||
| 2,490 | (8) | 120,616 | ||||||||||
| 2,490 | (9) | 120,616 | ||||||||||
| Laurie Brlas |
1,200 | (10) | 58,128 | 6,800 | (11) | 329,392 | ||||||
| David H. Gunning |
25,000 | (12) | 1,211,000 | 11,560 | (7) | 559,966 | ||||||
| 20,930 | (5) | 1,013,849 | ||||||||||
| 2,040 | (7) | 98,818 | 10,370 | (6) | 502,323 | |||||||
| 1,830 | (8) | 88,645 | ||||||||||
| William R. Calfee |
8,720 | (5) | 422,397 | 6,970 | (4) | 337,627 | ||||||
| 7,300 | (13) | 353,612 | 6,630 | (6) | 321,157 | |||||||
| 1,230 | (7) | 59,581 | ||||||||||
| 1,170 | (8) | 56,675 | ||||||||||
| Donald J. Gallagher |
17,442 | (5) | 844,890 | 6,970 | (4) | 337,627 | ||||||
| 7,300 | (13) | 353,612 | 7,140 | (6) | 345,862 | |||||||
| 1,230 | (7) | 59,581 | ||||||||||
| 1,260 | (8) | 61,034 | ||||||||||
| John S. Brinzo |
17,442 | (5)(14) | 844,890 | 28,390 | (4) | 1,375,212 | ||||||
| 30,420 | (13)(14) | 1,473,545 | 26,350 | (6) | 1,276,394 | |||||||
| 5,010 | (7) | 242,684 | ||||||||||
| 4,650 | (8) | 225,246 | ||||||||||
| (1) | Normally outstanding options would be listed on this table. There are no outstanding stock options for any named executive officers. |
| (2) | The amounts shown in this column reflect the number of unvested restricted shares granted under the ICE Plan and the number of retention units under the LTIP. Unless otherwise indicated, all of these awards vest on the last day of the second year following the year in which the award was granted. |
| (3) | One-half of these restricted shares will vest May 23, 2007 and May 23, 2008. |
| (4) | This represents a performance share grant for the 2005-2007 performance period. |
| (5) | These restricted shares were granted on March 14, 2006 with a vesting date of March 14, 2009. |
| (6) | This represents a performance share grant for the 2006-2008 performance period. |
137
| (7) | This represents a grant of retention units for the 2005-2007 performance period. |
| (8) | This represents a grant of retention units for the 2006-2008 performance period. |
| (9) | This represents additional performance shares (14,110) and retention units (2,490) for the 2006-2008 performance period granted to Mr. Carrabba on September 1, 2006 upon becoming CEO. |
| (10) | This represents a grant of retention units for the 2006-2008 performance period made to Ms. Brlas upon becoming CFO on December 11, 2006. No proration will apply to this grant. |
| (11) | This represents a grant of performance shares for the 2006-2008 performance period made to Ms. Brlas upon becoming CFO on December 11, 2006. No proration will apply to this grant. |
| (12) | This represents a portion of the grant of restricted shares made on March 10, 2003 to Mr. Gunning. The restricted shares that have already vested from this grant are included in the “2006 Option Exercises and Stock Vested” table below. The restriction on the restricted shares listed above lifted on March 10, 2007. |
| (13) | This represents a grant of restricted shares made on March 8, 2005 that will vest on December 31, 2007. |
| (14) | Amendments to Mr. Brinzo’s restricted shares agreements dated September 18, 2006 and effective September 1, 2006, and another amendment dated may 17, 2007 and effective May 9, 2007, allows the restrictions on his restricted shares to vest the day after the May 2007 Board meeting. |
Option Exercises And Stock Vested
The following table in columns (b) and (c) sets forth certain information regarding performance shares, retention units and restricted share awards that vested during 2006 for the persons named in the “2006 Summary Compensation Table” above based on the applicable fair market value. None of our named executive officers had stock options during the fiscal year ended December 31, 2006 and thus could not exercise them.
2006 Option Exercises And Stock Vested
| Stock Awards | ||||||
| Name (a) |
Number of (b) |
Value (c) | ||||
| Joseph A. Carrabba(2) |
2,534 | (3) | $ | 91,591 | ||
| Laurie Brlas(2) |
||||||
| David H. Gunning |
25,000 | (4) | 1,049,938 | |||
| 29,826 | (5) | 1,806,859 | ||||
| 4,260 | (6) | 206,354 | ||||
| William R. Calfee |
24,365 | (5) | 1,476,032 | |||
| 3,480 | (6) | 168,571 | ||||
| Donald J. Gallagher |
19,323 | (5) | 1,170,587 | |||
| 2,760 | (6) | 133,694 | ||||
| John S. Brinzo |
91,998 | (5) | 5,573,239 | |||
| 13,140 | (6) | 636,502 | ||||
| (1) | The value realized shown in column (c) is computed by multiplying the number of restricted shares, performance shares and retention units by the closing price of a common share on the date of vesting. Except as otherwise indicated, all awards vested on December 31, 2006. The closing price of a common share on December 29, 2006 was $48.44. |
| (2) | Mr. Carrabba and Ms. Brlas did not participate in the LTIP for the 2004-2006 performance period. |
| (3) | These restricted shares were granted on May 23, 2005. They vested on May 23, 2006 with a fair market value of $36.14 (on a post-split basis) on May 24, 2006. |
138
| (4) | This represents one-fourth of the restricted shares that were granted on March 10, 2003. These restricted shares vested on March 10, 2006 with a fair market value of $42.00 (on a post-split basis). |
| (5) | This represents a performance share award granted on March 8, 2004 for the 2004-2006 performance period paid out to participants on March 1, 2007 at a fair market value of $60.58 per share on February 26, 2007. The performance shares would have been, based on the performance criteria, paid out at 175 percent. However, because of the maximum cap on payments, they were actually paid at 71 percent of the uncapped value, which was 133 percent. |
| (6) | This represents an award of retention units under the LTIP paid out to participants for the 2004-2006 performance period. |
Pension Benefits
The table below shows the present value of accumulated benefits payable to the each named executive officer and the number of years of service credited to each such named executive officer under the Pension Plan and the SERP. The calculation was determined using interest rate and mortality rate assumptions consistent with those used in our financial statements.
The Pension Plan provides participants, including the named executive officers, with the greater of:
| (a) | the sum of: |
| (1) | For service with us through June 30, 2008, his or her accrued benefit under the plan’s Final Average Pay Formula described below; and |
| (2) | For service with us after June 30, 2008, his or her cash balance credits and interest under the Cash Balance Formula described below; or |
| (b) | the sum of: |
| (1) | For service with us through June 30, 2003, his or her accrued benefit under the Final Average Pay Formula described below; and |
| (2) | For service with us after June 30, 2003, his or her cash balance credits and interest after June 30, 2003 under the Cash Balance Formula described below. |
The Final Average Pay Formula provides a benefit that is generally based on a 1.65 percent pension formula. For each year of service up to June 30, 2003 or June 30, 2008, as the case may be, the plan provides 1.65 percent of Average Monthly Compensation. Average Monthly Compensation is defined as the average annual compensation earned during the 60 consecutive months providing the highest such average during the last 120 months preceding the applicable date. The benefit is subject to an offset of 50 percent of Social Security benefits through the applicable date. Benefits are payable as an annuity, unreduced for early commencement, upon the attainment of normal retirement at age 65, or at 30 years of service, or at age 62 with 15 years of service. Benefits are payable as an annuity reduced for early commencement upon the attainment of age 55 with 15 years of service.
The Cash Balance Formula provides a benefit payable at any time equal to the value of a notional cash balance account. For each calendar quarter, after the applicable date, a credit is made to the account equal to a percentage of his or her pay ranging from four percent to ten percent based upon his or her age and service with transitional pay credits up to 13 percent during the transition period from June 30, 2003 to June 30, 2008. Interest is credited to the account balance on a quarterly basis. At retirement or termination of employment, the accumulated account balance can be paid as either a lump sum or actuarially equivalent annuity.
The compensation used to determine benefits under our Pension Plan is the sum of salary and annual incentive compensation paid under the MPI Plan to a participant during a calendar year. Pensionable earnings for each of our named executive officers during 2006 include the amount shown for 2006 in column (c) of the “2006 Summary Compensation Table” above, plus the amount of incentive compensation earned in 2005 and paid in 2006.
139
The SERP generally provides the named executive officers with the benefits which would have been payable under the Pension Plan if certain Internal Revenue Code limitations did not apply to the Pension Plan. Until November 2006, the SERP provided that each year’s accrued benefits were paid as soon as possible after the end of the year. Thus, in early 2006, the accruals under the SERP for 2005 were paid to all vested participants including Messrs. Calfee, Gallagher and Brinzo. In November, 2006 the SERP was amended effective for 2006 and future accruals, to eliminate the annual payments and to provide that SERP accruals will be paid at retirement.
2006 Pension Benefits
| Name (a) |
Plan Name (b) |
Number of (c) |
Present (d) |
Payments (e) |
|||||
| Joseph A. Carrabba |
Salaried Pension Plan | 1.7 | 24,000 | ||||||
| Supplemental Retirement Benefit Plan | 1.7 | 854,800 | |||||||
| Laurie Brlas |
Salaried Pension Plan | ||||||||
| Supplemental Retirement Benefit Plan | |||||||||
| David H. Gunning |
Salaried Pension Plan | 5.7 | 190,800 | ||||||
| Supplemental Retirement Benefit Plan | 5.7 | 340,400 | |||||||
| William R. Calfee |
Salaried Pension Plan | 34.5 | 1,187,600 | ||||||
| Supplemental Retirement Benefit Plan | 34.5 | 486,500 | 49,019 | (3) | |||||
| Donald J. Gallagher |
Salaried Pension Plan | 25.4 | 594,500 | ||||||
| Supplemental Retirement Benefit Plan | 25.4 | 438,700 | 32,714 | (3) | |||||
| John S. Brinzo |
Salaried Pension Plan | 37.4 | 1,072,600 | 75,800 | |||||
| Supplemental Retirement Benefit Plan | 37.4 | 2,626,900 | (3)(4) | ||||||
| (1) | The present value of accrued benefits were calculated using a 5.75 percent discount rate, the assumption that the executive would receive the benefits at age 65 unless he or she is entitled to an unreduced benefit at an earlier age, and using the GAM 1994 sex distinct mortality table. |
| (2) | Mr. Carrabba is not vested in the benefit amount shown in column (d). |
| (3) | In early 2006, Messrs. Calfee, Gallagher and Brinzo received payment of their accruals under the SERP for 2005: Mr. Calfee — $49,019; Mr. Gallagher — $32,714; and Mr. Brinzo — $147,065. |
| (4) | Upon his retirement September 1, 2006, Mr. Brinzo received a lump sum payment of all his benefits under the SERP equal to $2,479,835. |
Nonqualified Deferred Compensation
Pursuant to our VNQDC Plan, the named executive officers and other senior management employees are permitted to defer, on a pre-tax basis, up to 50 percent of their base salary, all or a portion of their annual incentive under the MPI Plan, and their stock award or cash award which may be payable under the LTIP. Cash compensation awards deferred into stock units will be matched with a 25 percent match by us.
Cash deferrals earn interest at the Moody’s Corporate Average Bond Yield rate. Stock awards, which can only be deferred into stock units, are denominated in our common shares and vary with our share price performance.
Additionally, the VNQDC Plan provides that if a participant is entitled to receive a discretionary performance based contribution under the Savings Plan, but is limited in the amounts which can be contributed to the Savings Plan by certain Internal Revenue Code limitations, then the balance of such performance based contribution will be credited to the participant’s account under the VNQDC Plan. Similarly, if a named executive
140
officer’s salary reduction contributions to the Savings Plan are limited by Internal Revenue Code limitations, the amount that exceeds the limit will be credited to the executive’s account under the VNQDC Plan together with the match he or she would have had under the Savings Plan.
This table discloses in column (b), “Executive Contributions in Last FY,” the contributions by each named executive officer to the VNQDC Plan. These contributions include pre-tax contributions of salary, pre-tax contributions of incentive bonuses, pre-tax contributions of stock awards, and pre-tax contributions of cash awards.
Column (c) of the table, “Registrant Contributions in Last FY,” includes matching contributions we made of behalf of the named executive officers to the VNQDC Plan and performance-based contributions authorized under the Savings Plan that were credited to the VNQDC Plan.
Column (d) of the table, “Aggregate Earnings in Last FY,” includes interest earned on cash deferrals, dividends earned on deferred shares, and the change in value of the deferred shares held in the participant’s account during the course of the year.
2006 Nonqualified Deferred Compensation
| Name (a) |
Executive (b) |
Registrant (c) |
Aggregate (d) |
Aggregate (e) |
Aggregate (f) | ||||||||||||
| Joseph A. Carrabba |
$ | 36,667 | $ | 12,702 | $ | 3,497 | $ | 80,053 | |||||||||
| Laurie Brlas |
|||||||||||||||||
| David H. Gunning |
19,575 | 3,182 | 43,619 | ||||||||||||||
| William R. Calfee |
11,611 | 15,983 | 146,711 | 1,279,099 | |||||||||||||
| Donald J. Gallagher |
222,435 | 12,140 | 153,552 | 2,436,907 | |||||||||||||
| John S. Brinzo |
41,775 | (1,204,842 | ) | $ | 5,398,162 | (5) | 106,905 | ||||||||||
| (1) | The amounts in column (b) represents pre-tax contributions of salary, incentive bonuses, and performance share and retention unit awards to the VNQDC Plan by the named executive officers. |
| (2) | The amounts in column (c) reflect the sum of (i) our matching contributions made on behalf of the named executive officers to the VNQDC Plan, and (ii) performance-based contributions authorized under the Savings Plan but that were credited to the VNQDC Plan. The matching contributions for the named executive officers were: Carrabba — $12,702; and Calfee — $3,633. The performance-based contributions for the named executive officers were: Gunning — $19,575; Calfee — $12,350; Gallagher — $12,140; and Brinzo — $41,775. |
| (3) | The amounts in column (d) reflect the sum of (i) interest earned on cash deferrals, (ii) dividends earned on deferred shares, and (iii) the increase (or decrease) in the value of deferred common shares held in the participant’s account from January 1, 2006 through December 31, 2006, or in the case of Mr. Brinzo, the date of distribution from the VNQDC Plan. The interest earned by the named executive officers was: Carrabba —$3,497; Gunning — $3,182; Calfee — $94,304; Gallagher — $16,027; and Brinzo — $8,255. The dividends earned by the named executive officers were: Calfee — $9,425; Gallagher — $22,183; and Brinzo — $50,314. Messrs. Calfee and Gallagher reinvested a portion of their dividends into common deferred shares. The change in valuation of the deferred common shares for Messrs. Calfee, Gallagher, and Brinzo was $42,982, $115,343, and ($1,263,411), respectively. |
| (4) | In column (f) Mr. Gallagher’s aggregate balance includes 47,887 deferred common shares and Mr. Calfee’s aggregate balance includes 19,873 deferred common shares. Our common shares had a closing market price of $48.44 on December 29, 2006. |
| (5) | Mr. Brinzo received a distribution of $3,705,733.43, consisting of 99,817 common shares and $27.33 in cash on September 5, 2006 and a distribution of $1,692,428.69, consisting of 44,136 common shares and $33.77 in cash on October 2, 2006. |
141
Potential Payments Upon Termination Or Change Of Control
The table below reflects the compensation payable to each of the named executive officers in the event of termination of such executive’s employment under a variety of different circumstances including the named executive officer’s voluntary termination, involuntary not-for-cause termination, and termination following a change of control. In addition, for Mr. Calfee the amount payable upon his early retirement is shown and for Mr. Brinzo the amounts actually paid on his retirement August 31, 2006 are shown. The amounts shown assume in all cases other than Mr. Brinzo that such termination was effective as of December 29, 2006. All amounts shown except for Mr. Brinzo are estimates of the amounts which would be paid out to the executives upon their termination. The actual amounts to be paid out can only be determined at the time of such executive’s separation.
Payments Made Upon All Terminations
If a named executive officer’s employment terminates, he is entitled to receive certain amounts earned during his or her term of employment no matter the cause of termination. Such amounts include:
| • | Salary through the date of termination; |
| • | Unused vacation pay; |
| • | Accrued and vested benefits under our Pension Plan, our SERP, our Savings Plan, and our VNQDC Plan; |
| • | Undistributed performance shares and unpaid retention units for periods which have been completed; and |
| • | Restricted shares where the restrictions have lapsed. |
Additional Payments Upon Involuntary Termination Without Cause
In the event that a named executive officer is terminated involuntarily without cause, he or she would typically receive the following additional payments or benefits in the sole discretionary judgment of the Compensation Committee taking into account the nature of the termination, the length of the executive’s service, and the executive’s grade level. There is no legally binding agreement requiring that any such payments or benefits be paid to any named executive officer except in the case of a change in control prior to the termination:
| • | Severance payments; |
| • | Continued health insurance benefits; |
| • | Out-placement services; and |
| • | Financial services. |
Since all such benefits are at the discretion of the Compensation Committee, it is impossible to estimate the amount that would be paid in such circumstances.
Additional Payments Upon Retirement
None of the named executive officers were eligible to retire on December 29, 2006 other than Mr. Calfee. In the event of his retirement the following additional amounts will be paid in addition to the amounts payable to all terminated salaried employees:
| • | a pro-rata portion of the annual incentive award under the MPI Plan for the year in which he retires; |
| • | any unpaid annual incentive award under the MPI Plan for the year prior to the year of retirement; |
| • | a pro-rata portion of his performance shares and retention units will be paid when such shares and units would otherwise be paid; and |
| • | a pro-rata portion of any performance based contribution to the Savings Plan and the VNQDC Plan for the year of retirement. |
142
In addition, he will keep his restricted shares and the restrictions on sale of the shares will lapse at the end of the restriction period, he will be entitled to retiree medical and life insurance for the rest of his life and the life of his spouse on the same terms as any other salaried employee hired prior to 1993, and he will become vested in certain matching contributions under the VNQDC Plan provided that the amounts are not withdrawn until the end of the five-year vesting period.
As of September 1, 2006 Mr. Brinzo retired. This was eight months earlier than anticipated because he was expected to continue to serve as CEO until the annual meeting. In so retiring, Mr. Brinzo gave up substantial opportunities for salary and annual incentive compensation. In recognition of the salary and incentive compensation being forgone and in recognition of his service to us, Mr. Brinzo was provided the following additional benefits:
| • | a lump sum payment of $1,000,000; |
| • | an extra lump sum payment of $130,000 was paid to Mr. Brinzo reflecting the accrued pension benefit Mr. Brinzo would have had if the $1,000,000 payment were recognized as pensionable under the cash balance formula in our Pension Plan; |
| • | a modification of the performance share agreements so that his service as a non-employee Chairman of the Board will be recognized in determining the portion of the performance shares that he will earn, a cost to the Company of $542,379; |
| • | a modification of his restricted share agreements so that all restrictions on his restricted shares will lapse on the day after the May 8, 2007 Board meeting; |
| • | secretarial services until age 72, an estimated cost of $21,000; |
| • | a lifetime membership in the Union Club, Cleveland, Ohio, a value of $36,000; and |
| • | financial services for three years an estimated benefit of $7,500 per year. |
Additional Payments Because of Change in Control Without Termination
Under the terms of the restricted shares agreements and performance share agreements, each named executive officer is entitled to the following benefits upon the occurrence of a change in control regardless whether the employment of the named executive officer is terminated:
| • | the restrictions on the restricted shares lapse immediately; |
| • | the performance shares vest immediately; and |
| • | the retention units vest immediately. |
For this purpose, a change in control generally means the occurrence of any of the following events:
| (1) | The acquisition by any individual, entity or group of beneficial ownership of 30 percent or more of the combined voting power of our then outstanding voting stock (subject to exception); |
| (2) | a majority of the members of the Board of Directors on the date of the agreement are replaced other than in certain circumstances; |
| (3) | consummation of a merger, reorganization, consolidation, sale of substantially all the assets or other transaction involving us, unless, in each case, immediately following such transaction we are the survivor and certain requirements are satisfied; or |
| (4) | approval by our shareholders of a complete liquidation or dissolution, except certain transactions. |
Additional Payments Upon Termination Without Cause After Change in Control
Each of the named executive officers other than Mr. Brinzo has a written severance agreement that applies only in the event of termination during the two years after a change in control. If one of the named executive
143
officers is involuntarily terminated during the two years after a change in control, for a reason other than cause, he or she will be entitled to the following additional benefits:
| (1) | A lump sum payment in an amount equal to three (3) times the sum of (A) base salary (at the highest rate in effect for any period prior to the termination date), plus (B) annual incentive pay at the target level for the current year or prior year whichever is greater. |
| (2) | Coverage for a period of thirty-six (36) months following the termination date, by health, life insurance and disability benefits. |
| (3) | A lump sum payment in an amount equal to the sum of the future pension benefits that the executive would have been entitled to receive three (3) years following the termination date under the SERP. |
| (4) | Pro-rata incentive pay for the year in which the termination date occurs. |
| (5) | Outplacement services in an amount up to 15 percent of the executive’s base salary. |
| (6) | Post-retirement medical, hospital, surgical and prescription drug coverage for the lifetime of the executive, his or her spouse and any eligible dependents at the normal participant cost based on the executive’s age. |
| (7) | A gross-up payment for any taxes imposed on the executive under Internal Revenue Code section 4999 relating to excess parachute payments. |
| (8) | He or she will become vested in certain matching contributions under the VNQDC Plan provided that the amounts are not withdrawn until the end of the five-year vesting period. |
Similar benefits are paid if the executive voluntarily terminates his or her employment during the two years following a change in control by reason of any one of the following happening:
| (1) | Failure to maintain the executive in the office or position, or a substantially equivalent office or position, which the executive held immediately prior to a change in control; |
| (2) | (a) a significant adverse change in the nature or scope of the executive’s authorities, powers, functions, responsibilities or duties, (b) a reduction in the executive’s base salary, (c) a reduction in the executive’s opportunity to receive incentive pay, or (d) the termination or denial of the executive’s rights to employee benefits or a reduction in the scope or value thereof; |
| (3) | A change in circumstances that has substantially hindered executive’s performance of his or her job; |
| (4) | Certain corporate transactions; |
| (5) | We relocate our principal executive offices in excess of 25 miles from the prior location; or |
| (6) | Breach of the agreement. |
For purposes of the severance agreements, “cause” generally means termination of an executive for the following acts: (a) conviction of a criminal violation involving fraud, embezzlement or theft in connection with his or her duties or in the course of his or her employment with us; (b) intentional wrongful damage to our property; (c) intentional wrongful disclosure of our secret processes or confidential information; or (d) intentional wrongful engagement in any competitive activity.
In order to receive benefits under the severance agreements, the named executive officers may not disclose our confidential and proprietary information, may not go into competition with us, and may not solicit our employees to leave our employment.
144
The following tables show the benefits payable to the named executive officers upon various types of terminations of employment and change in control assuming an effective date of December 29, 2006:
| Joseph Carrabba | |||||||||||||||||
| Benefit |
Voluntary Termination or For Cause Termination |
Retirement | Involuntary Termination |
Change in Control Without Termination |
Termination Without Cause after Change in Control | ||||||||||||
| Cash Severance |
$ | $ | $ | $ | $ | 3,900,000 | |||||||||||
| Bonus |
$ | $ | $ | $ | $ | 466,667 | |||||||||||
| Equity |
|||||||||||||||||
| Restricted Share Grants | $ | $ | $ | 1,604,450 | $ | 1,604,450 | $ | 1,604,450 | |||||||||
| Performance Shares |
635,563 | 2,374,122 | 2,374,122 | ||||||||||||||
| Retention Units |
85,958 | 297,799 | 297,799 | ||||||||||||||
| Total | $ | $ | $ | 2,325,971 | $ | 4,276,371 | $ | 4,276,371 | |||||||||
| Retirement Benefits |
|||||||||||||||||
| Pension | $ | $ | $ | $ | $ | 1,184,000 | |||||||||||
| Retiree Welfare | $ | 136,000 | |||||||||||||||
| Total | $ | $ | $ | $ | $ | 1,320,000 | |||||||||||
| Nonqualified Deferred Compensation |
$80,053 | $ | 80,053 | $ | 80,053 | $ | 80,053 | $ | 80,053 | ||||||||
| Other Benefits |
|||||||||||||||||
| Health & Welfare | $ | $ | $ | $ | $ | 32,090 | |||||||||||
| Outplacement |
90,000 | ||||||||||||||||
| Perquisites |
20,161 | ||||||||||||||||
| Tax Gross-Ups |
3,841,022 | ||||||||||||||||
| Total | $ | $ | $ | $ | $ | 3,983,273 | |||||||||||
| Total |
$ | 80,053 | $ | 80,053 | $ | 2,406,024 | $ | 4,356,424 | $ | 14,026,364 | |||||||
145
| Laurie Brlas | |||||||||||||||||
| Benefit |
Voluntary Termination or For Cause Termination |
Retirement | Involuntary Termination |
Change in Control Without Termination |
Termination Without Cause after Change in Control | ||||||||||||
| Cash Severance |
$ | $ | $ | $ | $ | 1,755,000 | |||||||||||
| Bonus |
$ | $ | $ | $ | $ | 220,000 | |||||||||||
| Equity |
|||||||||||||||||
| Restricted Share Grants | $ | $ | $ | $ | $ | ||||||||||||
| Performance Shares |
6,038 | 330,888 | 330,888 | ||||||||||||||
| Retention Units |
1,066 | 58,392 | 58,392 | ||||||||||||||
| Total | $ | $ | $ | 7,104 | $ | 389,280 | $ | 389,280 | |||||||||
| Retirement Benefits |
|||||||||||||||||
| Pension | $ | $ | $ | $ | $ | 76,600 | |||||||||||
| Retiree Welfare | |||||||||||||||||
| Total | $ | $ | $ | $ | $ | 76,600 | |||||||||||
| Nonqualified Deferred Compensation |
$ | $ | $ | $ | $ | ||||||||||||
| Health & Welfare | $ | $ | $ | $ | $ | 32,090 | |||||||||||
| Outplacement |
54,750 | ||||||||||||||||
| Perquisites |
|||||||||||||||||
| Tax Gross-Ups |
1,062,336 | ||||||||||||||||
| Total | $ | $ | $ | $ | $ | 1,149,176 | |||||||||||
| Total |
$ | $ | $ | 7,104 | $ | 389,280 | $ | 3,590,056 | |||||||||
146
| David Gunning | |||||||||||||||||
| Benefit |
Voluntary Termination or For Cause Termination |
Retirement | Involuntary Termination |
Change in Control Without Termination |
Termination Without Cause after Change in Control | ||||||||||||
| Cash Severance |
$ | $ | $ | $ | $ | 2,370,000 | |||||||||||
| Bonus |
$ | $ | $ | $ | $ | 260,769 | |||||||||||
| Equity |
|||||||||||||||||
| Restricted Share Grants | $ | $ | $ | 2,234,954 | $ | 2,234,954 | $ | 2,234,954 | |||||||||
| Performance Shares |
1,548,953 | 2,241,766 | 2,241,766 | ||||||||||||||
| Retention Units |
273,345 | 395,606 | 395,606 | ||||||||||||||
| Total | $ | $ | $ | 4,057,252 | $ | 4,872,326 | $ | 4,872,326 | |||||||||
| Retirement Benefits |
|||||||||||||||||
| Pension | $ | 531,200 | $ | $ | 531,200 | $ | $ | 614,100 | |||||||||
| Retiree Welfare | 134,900 | ||||||||||||||||
| Total | $ | 531,200 | $ | $ | 531,200 | $ | $ | 749,000 | |||||||||
| Nonqualified Deferred Compensation |
$43,619 | $ | 43,619 | $ | 43,619 | $ | 43,619 | $ | 43,619 | ||||||||
| Other Benefits |
|||||||||||||||||
| Health & Welfare | $ | $ | $ | $ | $ | 32,090 | |||||||||||
| Outplacement |
65,250 | ||||||||||||||||
| Perquisites |
13,339 | ||||||||||||||||
| Tax Gross-Ups |
2,233,171 | ||||||||||||||||
| Total | $ | $ | $ | $ | $ | 2,343,850 | |||||||||||
| Total |
$ | 574,819 | $ | 43,619 | $ | 4,632,071 | $ | 4,915,945 | $ | 10,639,564 | |||||||
147
| William Calfee | |||||||||||||||||
| Benefit |
Voluntary Termination or For Cause Termination |
Retirement | Involuntary Termination |
Change in Control Without Termination |
Termination Without Cause after Change in Control | ||||||||||||
| Cash Severance |
$ | $ | $ | $ | $ | 1,860,000 | |||||||||||
| Bonus |
$ | $ | 285,000 | $ | $ | $ | 201,000 | ||||||||||
| Equity |
|||||||||||||||||
| Restricted Share Grants | $ | $ | $ | 779,533 | $ | 779,533 | $ | 779,533 | |||||||||
| Performance Shares |
1,173,162 | 1,621,351 | 1,621,351 | ||||||||||||||
| Retention Units |
207,029 | 286,121 | 286,121 | ||||||||||||||
| Total | $ | $ | $ | 2,159,724 | $ | 2,687,005 | $ | 2,687,005 | |||||||||
| Retirement Benefits |
|||||||||||||||||
| Pension | $ | 1,674,000 | $ | 1,674,000 | $ | 1,674,000 | $ | $ | 1,937,500 | ||||||||
| Retiree Welfare | 164,970 | 164,970 | 164,970 | 169,000 | |||||||||||||
| Total | $ | 1,838,970 | $ | 1,838,970 | $ | 1,838,970 | $ | $ | 2,106,500 | ||||||||
| Nonqualified Deferred Compensation |
$1,268,890 | $ | 1,268,890 | $ | 1,268,890 | $ | 1,268,890 | $ | 1,268,890 | ||||||||
| Other Benefits |
|||||||||||||||||
| Health & Welfare | $ | $ | $ | $ | $ | 32,090 | |||||||||||
| Outplacement |
50,250 | ||||||||||||||||
| Perquisites |
73,120 | ||||||||||||||||
| Tax Gross-Ups |
1,688,740 | ||||||||||||||||
| Total | $ | $ | $ | $ | 1,844,200 | ||||||||||||
| Total |
$ | 3,107,860 | $ | 3,392,860 | $ | 5,267,584 | $ | 3,955,895 | $ | 9,967,595 | |||||||
148
| Don Gallagher | |||||||||||||||||
| Benefit |
Voluntary Termination or For Cause Termination |
Retirement | Involuntary Termination |
Change in Control Without Termination |
Termination Without Cause after Change in Control | ||||||||||||
| Cash Severance |
$ | $ | $ | $ | $ | 2,070,000 | |||||||||||
| Bonus |
$ | $ | $ | $ | $ | 225,000 | |||||||||||
| Equity |
|||||||||||||||||
| Restricted Share Grants | $ | $ | $ | 1,203,946 | $ | 1,203,946 | $ | 1,203,946 | |||||||||
| Performance Shares |
992,687 | 1,447,634 | 1,447,634 | ||||||||||||||
| Retention Units |
175,180 | 255,466 | 255,466 | ||||||||||||||
| Total | $ | $ | $ | 2,371,813 | $ | 2,907,046 | $ | 2,907,046 | |||||||||
| Retirement Benefits |
|||||||||||||||||
| Pension | $ | 654,300 | $ | $ | 654,300 | $ | $ | 1,606,800 | |||||||||
| Retiree Welfare | 123,400 | ||||||||||||||||
| Total | $ | 654,300 | $ | $ | 654,300 | $ | $ | 1,730,200 | |||||||||
| Nonqualified Deferred Compensation |
$ | 2,411,487 | $ | 2,411,487 | $ | 2,411,487 | $ | 2,411,487 | $ | 2,411,487 | |||||||
| Other Benefits |
|||||||||||||||||
| Health & Welfare | $ | $ | $ | $ | $ | 32,090 | |||||||||||
| Outplacement |
56,250 | ||||||||||||||||
| Perquisites |
38,826 | ||||||||||||||||
| Tax Gross-Ups |
2,382,559 | ||||||||||||||||
| Total | $ | $ | $ | $ | $ | 2,509,725 | |||||||||||
| Total |
$ | 3,065,787 | $ | 2,411,487 | $ | 5,437,600 | $ | 5,318,533 | $ | 11,853,458 | |||||||
149
COMPENSATION COMMITTEE REPORT
The following report has been submitted by the Compensation Committee:
The Compensation Committee of the Board of Directors has reviewed and discussed the Compensation Discussion and Analysis with management. Based on this review and discussion, the Compensation Committee recommended to the Board of Directors that the Compensation Discussion and Analysis be included in the Cleveland-Cliffs Inc’s Annual Report on Form 10-K for the year ended December 31, 2006 and its definitive proxy statement on Schedule 14A for its 2007 annual meeting, as filed with the Securities and Exchange Commission.
Francis R. McAllister, Chairman
James D. Ireland III
Roger Phillips
Richard K. Riederer
DIRECTORS’ COMPENSATION
Directors who are not our employees receive an annual retainer fee of $32,500 and an annual equity award of $32,500. Board meeting fees and Committee meeting fees are $1,500 and $1,000, respectively. The Lead Director annual retainer fee is $10,000. Annual committee chair retainers are as follows: Audit Committee, $10,000, and Board Affairs, Finance, and Compensation Committees $5,000. Employee Directors receive no compensation for their service as Directors.
The Nonemployee Directors’ Compensation Plan (as Amended and Restated as of January 1, 2005), which we refer to as the Directors’ Plan, implements the annual equity grant program referenced above. Directors who are under age 69 on the date of the annual meeting receive an automatic annual grant of $32,500 worth of restricted shares with a three-year vesting requirement. Nonemployee Directors who are 69 years of age or older on the date of the annual meeting receive an automatic annual grant of $32,500 worth of common shares (with no restrictions).
The Directors’ Plan also provides that a Director should own by the end of a four-year period either (i) 4,000 or more common shares or (ii) common shares having a market value of at least $100,000, in accordance with the current Director Share Ownership Guidelines. If a nonemployee Director meets these guidelines in December of each year, the Director may elect to receive all or a portion of his or her annual retainer of $32,500 for the following year in cash. If the Director does not meet these guidelines, the Director is required to receive an equivalent value of $15,000 in common shares until he or she meets one of the two guidelines. Nonemployee Directors may elect to receive up to 100 percent of their retainer and other fees in common shares. In addition, the Directors’ Plan gives nonemployee Directors the opportunity to defer all or a portion of their annual retainer and other fees, whether payable in cash or common shares. Beginning with the 2006 annual equity award, nonemployee Directors may elect to receive deferred shares in lieu of their annual equity award of restricted common shares or common shares. A Director may also elect that all cash dividends with respect to such restricted shares be deferred and reinvested in additional common shares during the restriction period of such restricted shares. Those additional common shares are subject to the same restrictions as the underlying award. Cash dividends not subject to the restriction described above will be paid to the Director without restriction.
Nonemployee Directors who joined the Board before January 1, 1999 were able to participate in either the Retirement Plan for Non-Employee Directors adopted in 1984, which we refer to as the 1984 Plan, or the Nonemployee Directors Supplemental Compensation Plan established in 1995, which we refer to as the 1995 Plan. The 1984 Plan provides that a nonemployee Director elected before July 1, 1995, with at least five years of service, receives during his or her lifetime after retirement an amount equal to the annual retainer currently paid to nonemployee Directors. Under the 1995 Plan, a nonemployee Director elected on or after July 1, 1995, with at least five years of service, receives after retirement a quarterly amount equal to 50 percent of the stated quarterly retainer in effect at the time of retirement for the period equal to the Director’s service. Under either plan, in the event of a “change in control” causing the Director’s retirement, he or she receives the retirement payment
150
prorated for any service less than five years. Directors who join the Board on or after January 1, 1999 are not eligible to participate in either plan.
On January 14, 2003, the Board of Directors adopted respective amendments to both plans to provide for a voluntary immediate lump sum cash-out election of the present value of the accrued pension and deferred benefits to all nonemployee Directors participating under both plans. Under the terms of both plans, as amended, the lump-sum benefit was payable to the participants on June 30, 2003. Of the 14 participants, three elected not to participate in the lump sum benefit. The aggregate value for participants electing a payout was approximately $2.3 million. The payout election by the 11 participants means those participants have no further opportunity for a pension adjustment under either plan for future changes in our annual retainer. Mr. Ireland is the only current Director eligible for a retirement benefit, which will be paid from the 1984 Plan.
We have trust agreements with KeyBank National Association relating to the Directors’ Plan, the 1984 Plan and the 1995 Plan, in order to establish arrangements for the funding and payment of our obligations under such plans.
Director Compensation Table
The following table, supported by the accompanying footnotes and narrative, sets forth for fiscal year 2006 all compensation earned by the individuals who served as our nonemployee Directors at any time during 2006.
| Name |
Fees Earned or Paid in Cash ($) (1) |
Stock Awards ($) (2) |
Change in Pension Value and Nonqualified Deferred Compensation Earnings ($) (3) |
Total ($) | ||||
| R. C. Cambre |
51,500 | 16,538 | 68,038 | |||||
| R. Cucuz(4) |
23,750 | 23,292 | 47,042 | |||||
| S. M. Cunningham |
51,000 | 14,271 | 65,271 | |||||
| B. J. Eldridge |
47,000 | 16,216 | 63,216 | |||||
| J. D. Ireland III |
58,000 | 16,538 | 580 | 75,118 | ||||
| F. R. McAllister |
69,000 | 16,538 | 85,538 | |||||
| R. Phillips |
53,000 | 26,862 | 79,862 | |||||
| R. K. Riederer |
68,000 | 26,862 | 94,862 | |||||
| A. Schwartz |
56,000 | 16,538 | 72,538 |
| (1) | The amounts listed in this column reflect the cash dollar value of all earnings in 2006 for quarterly Board and Chairman retainers and meeting fees on the date earned, whether received in required retainer shares, voluntary shares, or cash, or a combination thereof. |
A nonemployee Director may voluntarily elect to receive up to 100 percent of his or her annual retainer, Chairman retainer, and meeting fees in common shares. Messrs. Cambre, Eldridge, and Schwartz have met the Director Share Ownership Guidelines and have continued an election to receive a portion of their retainers and/or fees in common shares. Of the annual amount listed, Messrs. Cambre, Eldridge, and Schwartz have elected to receive $32,500, $30,123, and $15,000 respectively, to common shares. Ms. Cunningham had not met the guidelines as of December 1, 2005 and received $15,000 in common shares during 2006.
As discussed above, the Directors’ Plan gives nonemployee Directors the opportunity to defer all or a portion of their annual retainer and Chairman retainers and meeting fees, whether payable in cash or common shares in the Nonemployee Directors’ Deferred Compensation Plan, which we refer to as the Directors Deferred Plan. In 2006, Mr. Riederer deferred $15,000 in retainer fees converted to common shares and Mr. Ireland deferred $15,000 in cash pursuant to the Directors Deferred Plan.
| (2) | The amounts in this column reflect the dollar amount recognized for financial statement reporting purposes for the fiscal year ended December 31, 2006, in accordance with SFAS 123(R), of awards of restricted shares and includes amounts from awards granted in and prior to 2006. See footnote 11 to our 2006 consolidated financial statements included in Item 8. In 2006, an automatic annual equity grant of 654 |
151
| restricted shares having a grant date fair market value of $49.69 per share was made to each of the nonemployee Directors listed above, except for Mr. Cucuz who was not a director at the time of the May 9, 2006 grant. Mr. Riederer elected to receive deferred shares in lieu of restricted shares. |
As of December 31, 2006, the aggregate number of restricted shares subject to forfeiture held by each Nonemployee Director were as follows: Mr. Cambre — 1,520; Ms. Cunningham — 1,218; Mr. Eldridge — 1,490; Mr. Ireland — 1,520; Mr. McAllister — 1,536; Mr. Phillips — 9,520; Mr. Riederer — 9,049; and Mr. Schwartz — 1,520.
As of December 31, 2006, the aggregate number of unvested deferred shares credited to Mr. Riederer under the Directors’ Plan was 659.9124 shares.
| (3) | Mr. Ireland is the only independent Director eligible for retirement benefits under the 1984 Plan. |
| (4) | Mr. Cucuz retired from the Board of Directors in May 2006. In connection with his retirement, the Board, upon recommendation of the Board Affairs Committee, accelerated the vesting of 866 restricted shares granted to Mr. Cucuz in July 2005. The additional value of his award resulting from such acceleration in accordance with SFAS 123(R) ($13,975) is included in the value shown in the table under “Stock Awards.” The actual market value received upon accelerated vesting of the restricted shares was $43,128. |
152
| Item 12. Security | Ownership of Certain Beneficial Owners and Management and Related Stockholder Matters. |
EQUITY COMPENSATION PLAN INFORMATION
The table below sets forth certain information regarding the following equity compensation plans of ours as of December 31, 2006: the ICE Plan, the MPI Plan, the Mine Performance Bonus Plan, which we refer to as the Mine Plan, the VNQDC Plan and the Directors’ Plan. Only the ICE plan has been approved by shareholders.
| Plan category |
Number of securities to be issued upon exercise of outstanding options, warrants and rights |
Weighted-average exercise price of outstanding options, warrants and rights |
Number of securities remaining available for future issuance under equity compensation plans (excluding securities reflected in column(a)) |
||||||
| (a) | (b) | (c) | |||||||
| Equity compensation plans approved by security holders |
442,636 | (1) | $ | 10.07 | 1,421,070 | (2) | |||
| Equity compensation plans not approved by security holders |
0 | N/A | (3) | ||||||
| (1) | Includes 430,836 performance share awards, an award initially denominated in shares, but no shares are actually issued until performance targets are met. The weighted-average exercise price of outstanding options, warrants and rights, column (b), does not take these awards into account. |
| (2) | Includes 1,334,296 common shares remaining available under the ICE Plan, which authorizes the Compensation Committee to make awards of option rights, restricted shares, deferred shares, performance shares and performance units (including up to 324,662 restricted shares and deferred shares); and 86,774 common shares remaining available under the Directors’ Plan, which authorizes the award of restricted shares, which we refer to as the annual equity grant, to Directors upon their election or re-election to the Board at the annual meeting and provides that the Directors are required to take $15,000 of the annual retainer in common shares unless they meet the Director share ownership guidelines, and may take up to 100 percent of their retainer and other fees in common shares. |
| (3) | The MPI Plan, the Mine Plan, and the VNQDC Plan provide for the issuance of common shares, but do not provide for a specific amount available under the plans. Descriptions of those plans are set forth below. |
MPI Plan
The MPI Plan provides an opportunity for elected officers and other management employees to earn annual cash bonuses. Bonuses may also be paid in common shares. Certain participants in the MPI Plan may elect to defer all or a portion of such bonus into the VNQDC Plan. Such participants in the MPI Plan may elect to have his or her deferred cash bonus credited to an account with deferred common shares, which we refer to as bonus exchange shares, by completing an election form prior to the date the bonus would otherwise be paid. These participants may also elect at this time to have dividends credited with respect to the bonus exchange shares, either credited in additional deferred common shares, deferred in cash or paid out in cash in an in-service compensation distribution. In order to encourage elections to be credited with deferred common shares, such participants in the MPI Plan, who elect to have their cash bonuses credited to an account with bonus exchange shares, will be credited with restricted deferred common shares in the amount of 25 percent of the bonus exchange shares, which we refer to as bonus match shares. These participants must comply with the employment and non-distribution requirements for the bonus exchange shares during a five-year period for the bonus match shares to become vested and nonforfeitable.
153
Mine Plan
The Mine Plan provides an opportunity for senior mine managers to earn cash bonuses. Bonuses earned under the Mine Plan are determined and paid quarterly to the participants. Certain participants may elect to defer all or part of their quarterly cash bonuses under the VNQDC Plan. These participants in the Mine Plan may further elect to have his or her deferred cash bonus credited to an account with deferred common shares. Each year these participants under the Mine Plan must make their bonus exchange shares election (for the four quarters of that year). Such elections must be made by December 31 of the year prior to the year in which the quarterly bonuses are earned. As with the participants electing bonus exchange shares under the MPI Plan, participants under the Mine Plan electing bonus exchange shares will receive or be credited with restricted bonus match shares in an amount of 25 percent of the bonus exchange shares with the same five-year vesting period.
VNQDC Plan
The VNQDC Plan was originally adopted by the Board of Directors to provide certain key management and highly compensated employees of ours or our selected affiliates with the opportunity to defer receipt of a portion of their regular compensation in order to defer taxation of these amounts. The VNQDC Plan also permits deferral of bonus awards under the MPI Plan, the Mine Plan, and Performance Share Plan (awarded under the ICE Plan). In addition, the VNQDC Plan contains the Management Share Acquisition Program, or MSAP, whose purpose is to provide designated management employees with the opportunity to acquire deferred interests in common shares through deferral of their bonuses. The VNQDC Plan also contains the Officer Share Acquisition Program, or OSAP, which permits elected officers to acquire deferred interests in common shares with compensation previously deferred in cash under the VNQDC Plan. When participants in the MPI Plan, the Mine Plan or the MSAP or OSAP elect to have accounts credited with deferred common shares under the VNQDC Plan, a match by us equal to 25 percent of the value of the deferred common shares will be credited by us to the accounts of participants.
154
SECURITIES OWNERSHIP OF MANAGEMENT AND CERTAIN OTHER PERSONS
The following table sets forth the amount and percent of common shares that, as of May 18, 2007 (except as otherwise indicated), are deemed under the rules of the SEC to be “beneficially owned” by each Director (excluding Messrs. Brinzo, Carrabba and Gunning), by each nominee for Director, by our Chief Executive Officer, Chief Financial Officer and the other three most highly compensated executive officers as named in the Summary Compensation Table above, by such persons and the other executive officers as a group, and by any person or “group” (as the term is used in the Securities Exchange Act of 1934) known to us as of that date to be a “beneficial owner” of more than five percent or more of the outstanding common shares. No Directors, executive officers, or officers hold any preferred shares or outstanding stock options as of May 18, 2007.
| Amount and Nature of “Beneficial Ownership”(1) | |||||||||||||||
| Directors and Nominees (excluding those who are also |
Investment Power | Voting Power | |||||||||||||
| Beneficial Ownership |
Sole | Shared | Sole | Shared | Percent of Class (2) |
||||||||||
| Ronald C. Cambre |
8,857 | 8,857 | -0- | 8,857 | -0- | — | |||||||||
| Susan M. Cunningham |
1,695 | 1,695 | -0- | 1,695 | -0- | — | |||||||||
| Barry J. Eldridge |
2,426 | 2,426 | -0- | 2,426 | -0- | — | |||||||||
| Susan M. Green |
-0- | -0- | -0- | -0- | -0- | — | |||||||||
| James D. Ireland III |
571,270 | 22,042 | 549,228 | (3) | 22,042 | 549,228 | (3) | 1.4 | % | ||||||
| Francis R. McAllister |
7,327 | 7,327 | -0- | 7,327 | -0- | — | |||||||||
| Roger Phillips |
16,538 | 16,538 | -0- | 16,538 | -0- | — | |||||||||
| Richard K. Riederer |
14,446 | 14,446 | -0- | 14,446 | -0- | — | |||||||||
| Alan Schwartz |
8,739 | 8,739 | -0- | 8,739 | -0- | — | |||||||||
| Named Executive Officers |
|||||||||||||||
| Joseph A. Carrabba |
34,698 | 34,698 | -0- | 34,698 | -0- | — | |||||||||
| Laurie Brlas |
-0- | -0- | -0- | -0- | -0- | — | |||||||||
| David H. Gunning |
53,482 | 53,482 | -0- | 53,482 | -0- | — | |||||||||
| William R. Calfee |
76,958 | 76,958 | -0- | 76,958 | -0- | — | |||||||||
| Donald J. Gallagher |
82,331 | 82,331 | -0- | 82,331 | -0- | — | |||||||||
| John S. Brinzo |
101,867 | 101,867 | -0- | 101,867 | -0- | — | |||||||||
| All Directors, Nominees, and Executive Officers as a group, including the named executive officers |
1,102,897 | 553,669 | 549,228 | 553,669 | 549,228 | 1.54 | % | ||||||||
| Other Persons |
|||||||||||||||
| LMM LLC (4) 100 Light Street Baltimore, MD 21202 |
4,300,000 | -0- | 4,300,000 | -0- | 4,300,000 | 10.44 | % | ||||||||
| Jeffrey L. Gendell (5) 55 Railroad Avenue, 3rd Floor Greenwich, CT 06830 |
4,066,148 | -0- | 4,066,148 | -0- | 4,066,148 | 9.87 | % | ||||||||
| Wellington Management |
4,007,280 | -0- | 3,932,980 | -0- | 2,902,980 | 9.73 | % | ||||||||
| 75 State Street Boston, MA 02109 |
|||||||||||||||
| Barclays Global Investors, NA (7) Murray House 1 Royal Mint Court London, EC3N 4HH |
2,406,934 | 2,406,934 | -0- | 2,240,870 | -0- | 5.84 | % | ||||||||
155
| Amount and Nature of “Beneficial Ownership”(1) | |||||||||||||
| Directors and Nominees (excluding those who are also |
Investment Power | Voting Power | |||||||||||
| Beneficial Ownership |
Sole | Shared | Sole | Shared | Percent of Class (2) |
||||||||
| Capital Research and Management Company (8) |
2,250,000 | 2,250,000 | -0- | 2,250,000 | -0- | 5.5 | % | ||||||
| 333 South Hope Street Los Angeles, CA 90071 |
|||||||||||||
| Bank of America Corporation (9) 100 North Tryon Street Floor 25 Bank of America Corporate Center Charlotte, NC 28255 |
2,249,966 | -0- | 2,244,872 | -0- | 2,249,966 | 5.46 | % | ||||||
| (1) | Under the rules of the SEC, “beneficial ownership” includes having or sharing with others the power to vote or direct the investment of securities. Accordingly, a person having or sharing the power to vote or direct the investment of securities is deemed to “beneficially own” the securities even if he or she has no right to receive any part of the dividends on or the proceeds from the sale of the securities. Also, because “beneficial ownership” extends to persons, such as co-trustees under a trust, who share power to vote or control the disposition of the securities, the very same securities may be deemed “beneficially owned” by two or more persons shown in the table. Information with respect to “beneficial ownership” shown in the table above is based upon information supplied by our Directors, nominees and executive officers and filings made with the SEC or furnished to us by any shareholder. |
| (2) | Less than one percent, except as otherwise indicated. |
| (3) | Of the 571,270 shares deemed under the rules of the SEC to be beneficially owned by Mr. Ireland, he is a beneficial holder of 22,042 shares. The remaining 549,228 shares are held in trusts, substantially for the benefit of a charitable foundation, as to which Mr. Ireland is a co-trustee with shared voting and investment powers. Of such shares in trusts, Mr. Ireland has an interest in the income or corpus with respect to 46,849 shares. |
| (4) | The information shown above and in this footnote was taken from Amendment No. 2 to Schedule 13G, dated February 15, 2007, as filed with the SEC on February 15, 2007 jointly by Legg Mason Opportunity Trust and LMM LLC. The 4,300,000 shares are held for the account of Legg Mason Opportunity Trust, which is a portfolio of Legg Mason Investment Trust, Inc. (an investment company registered under the Investment Company Act of 1940). LMM LLC manages Legg Mason Opportunity Trust. |
| (5) | The information shown above and in this footnote was taken from the Schedule 13G/A Amendment No. 4, dated January 29, 2007, and filed with the SEC on January 29, 2007, as a group, by Tontine Partners, L.P., Tontine Management, L.L.C. (which is the general partner of Tontine Partners, L.P.), Tontine Capital Partners, L.P., Tontine Capital Management, L.L.C. (which is the general partner of Tontine Capital Partners, L.P.), Tontine Overseas Associates, L.L.C. (which serves as the investment manager to Tontine Capital Overseas Master Fund, L.P. and Tontine Overseas Fund Ltd.), and Jeffrey L. Gendell. Mr. Gendell is the managing member of Tontine Management, L.L.C., Tontine Capital Management, L.L.C. and Tontine Overseas Associates, L.L.C., and in that capacity directs their operations. |
| (6) | The information shown above and in this footnote was taken from the Schedule 13G, dated February 14, 2007 and filed with the SEC on February 14, 2007, by Wellington Management Company, LLP, and investment adviser. |
| (7) | The information shown above and in this footnote was taken from the Schedule 13G, dated January 9, 2007 and filed with the SEC on January 23, 2007, by Barclays Global Investors, NA, Barclays Global Fund Advisors, Barclays Global Investors, Ltd, Barclays Global Investors Japan Trust and Banking Company Limited and Barclays Global Investors Japan Limited. |
156
| (8) | The information shown above and in this footnote was taken from the Schedule 13G, dated February 6, 2007 and filed with the SEC on February 12, 2007, by Capital Research and Management Company, an investment adviser registered under Section 203 of the Investment Advisers Act of 1940. |
| (9) | The information shown above and in this footnote was taken from the Schedule 13G, dated February 7, 2007 and filed jointly with the SEC on February 7, 2007, by Bank of America Corporation, NB Holdings Corporation, Bank of America NA, Columbia Management Group, LLC, Columbia Management Advisors LLC, Banc of America Securities Holdings Corporation, Banc of America Securities LLC, and Banc of America Investment Advisors, Inc. |
Item 13. Certain Relationships and Related Transactions, and Director Independence.
AGREEMENTS AND TRANSACTIONS
We have entered into indemnification agreements with each current member of the Board of Directors. The form and execution of the indemnification agreements were approved by our shareholders at the annual meeting convened on April 29, 1987. The indemnification agreements essentially provide that, to the extent permitted by Ohio law, we will indemnify the indemnitee against all expenses, costs, liabilities and losses (including attorneys’ fees, judgments, fines or settlements) incurred or suffered by the indemnitee in connection with any suit in which the indemnitee is a party or otherwise involved as a result of his or her service as a member of the Board. In connection with the indemnification agreements, we have a trust agreement with KeyBank National Association pursuant to which the parties to the indemnification agreements may be reimbursed with respect to enforcing their respective rights under the indemnification agreements.
In order to promote mutual appreciation of management and union interests, we and the USW reached a new agreement in 2004 on a process under which the USW may designate a member of the Board of Directors, provided that individual is acceptable to the Chairman, is recommended by the Board Affairs Committee of the Board of Directors, and is elected by the full Board. This agreement superseded a general understanding between the USW and certain of our subsidiaries reached in 1993. Such designee would be subject to annual nomination by us, election by vote of the shareholders, and all laws and our policies applicable to the Board of Directors. Susan M. Green has been proposed by the USW and has been recommended to the full Board of Directors by the Board Affairs Committee as a nominee for election at the annual meeting. This arrangement is concurrent with our U.S. labor agreements that may be terminated by either party on September 1, 2008. The Board of Directors has approved the nomination of Ms. Green for election as Director.
Jones Day is a law firm that we have retained for specific legal services, on a case-by-case basis, for over thirty years. The fees paid by us to Jones Day during 2006 were approximately $1.4 million, which amount is substantially less than .1 percent of Jones Day’s gross revenues for 2006. Mr. Gunning is the father-in-law of Gina K. Gunning, a partner of Jones Day. During 2006, Ms. Gunning did not personally render legal services to us or supervise any attorney in the rendering of legal services to us, and Ms. Gunning did not receive any direct compensation from fees paid by us to Jones Day.
We recognize that transactions between us and any of our directors or executive officers can present potential or actual conflicts of interest and create the appearance that our decisions are based on considerations other than the best interests of our shareholders. Pursuant to its charter, the Audit Committee reviews and approves all related-party transactions, defined as those transactions required to be disclosed under Item 404 of Regulation S-K.
DIRECTOR INDEPENDENCE
The Board of Directors has determined that each of the current non-management Directors standing for reelection, including each of the current members of the Audit Committee, the Board Affairs Committee and the Compensation and Organization Committee, has no material relationship with Cleveland-Cliffs (either directly or as a partner, shareholder or officer of an organization that has a relationship with Cleveland-Cliffs) and is independent within our director independence standards, which reflect exactly the New York Stock Exchange, director independence standards as currently in effect and as they may be changed from time to time. John S. Brinzo, Joseph A. Carrabba, and David H. Gunning do not meet the aforementioned independence standards
157
because they are Former Chairman, President and Chief Executive Officer, and Vice Chairman, respectively. Mr. Brinzo retired on September 1, 2006. Mr. Gunning resigned as Director on May 8, 2007. Messrs. Carrabba and Gunning are current employees.
Susan M. Green, has been nominated by the Board of Directors to serve as a Director, and if elected to the Board of Directors, will also be an independent Director pursuant to the New York Stock Exchange director independence standards. Ms. Green was proposed as a nominee for the Board of Directors by the USW pursuant to the terms of our 2004 labor agreement. Although Ms. Green was proposed by the USW, the Board of Directors has determined that she does not have any material relationships with the USW and will be, if elected, an independent director.
Since January 1, 2006, there have been no transactions between Cleveland-Cliffs and any of our independent Directors or Ms. Green, other than compensation for service as a director as disclosed below.
Item 14. Principal Accountant Fees and Services.
Fees for professional services provided by our independent auditors in each of the last two fiscal years, in each of the following categories (in thousands) are as follows:
| 2006 | 2005 | |||||
| Audit Fees (1) |
$ | 2,694 | $ | 1,931 | ||
| Audit-Related Fees (2) |
140 | 230 | ||||
| Tax Fees |
88 | 5 | ||||
| Total |
$ | 2,922 | $ | 2,166 | ||
| (1) | Audit Fees consist of fees billed, or to be billed for professional services rendered for the audit of our annual consolidated financial statements and audit of internal controls over financial reporting for the years ended December 31, 2006 and 2005, and reviews of the interim financial statements included in quarterly reports and services that are normally provided by our independent auditors in connection with regulatory filings. |
| (2) | Audit-Related Fees consist of fees billed primarily related to agreed-upon procedures. Audit-Related Fees for 2005 also include the Portman acquisition. |
The Audit Committee’s policy is to pre-approve all audit and non-audit services provided by our independent auditors. These services may include audit services, audit-related services, tax services and other services. Pre-approval is generally provided for up to one year and any pre-approval is detailed as to the particular service or category of services and is generally subject to a specific budget. The Audit Committee has delegated pre-approval authority to the Audit Committee Chairman, or any Audit Committee Member in his absence, when services are required on an expedited basis, with such pre-approval disclosed to the full Audit Committee at its next scheduled meeting. None of the fees paid to the independent auditors under the categories “Audit-Related,” and “Tax Fees” described above were approved by the Audit Committee after services were rendered pursuant to the de minimis exception established by the SEC.
158
Item 15. Exhibits and Financial Statement Schedules.
(a)(1) and (2) — List of Financial Statements and Financial Statement Schedules.
The following consolidated financial statements of Cleveland-Cliffs Inc are included at Item 8 above:
Statements of Consolidated Financial Position — December 31, 2006 and 2005
Statements of Consolidated Operations — Years ended December 31, 2006, 2005 and 2004
Statements of Consolidated Cash Flows — Years ended December 31, 2006, 2005 and 2004
Statements of Consolidated Shareholders’ Equity — Years ended December 31, 2006, 2005 and 2004
Notes to Consolidated Financial Statements
The following consolidated financial statement schedule of Cleveland-Cliffs Inc is included herein in Item 15(d) and attached as Exhibit 99(a).
Schedule II — Valuation and Qualifying Accounts
All other schedules for which provision is made in the applicable accounting regulation of the Securities and Exchange Commission are not required under the related instructions or are inapplicable, and therefore have been omitted.
(3) List of Exhibits — Refer to Exhibit Index on pages 161-169 which is incorporated herein by reference.
(c) Exhibits listed in Item 15(a)(3) above are incorporated herein by reference.
(d) The schedule listed above in Item 15(a)(1) and (2) is attached as Exhibit 99(a) and incorporated herein by reference.
159
Pursuant to the requirements of Section 13 of the Securities Exchange Act of 1934, the Registrant has duly caused this report to be signed on its behalf by the undersigned, thereunto duly authorized.
| CLEVELAND-CLIFFS INC | ||||
| By: | /s/ LAURIE BRLAS | |||
| Name: | Laurie Brlas | |||
| Title: | Senior Vice President, Chief Financial Officer and Treasurer | |||
Date: May 25, 2007
Pursuant to the requirements of the Securities Exchange Act of 1934, this report has been signed below by the following persons on behalf of the Registrant and in the capacities and on the dates indicated.
| Signatures |
Title |
Date | ||
| /s/ J. A. CARRABBA J. A. Carrabba |
Chairman, President and Chief Executive Officer and Director (Principal Executive Officer) | May 25, 2007 | ||
| /s/ L. BRLAS L. Brlas |
Senior Vice President, Chief Financial Officer and Treasurer (Principal Financial Officer) | May 25, 2007 | ||
| /s/ R. J. LEROUX R. J. Leroux |
Vice President and Controller (Principal Accounting Officer) | May 25, 2007 | ||
| * R.C. Cambre |
Director | May 25, 2007 | ||
| * S. M. Cunningham |
Director | May 25, 2007 | ||
| B. J. Eldridge |
Director | May 25, 2007 | ||
| * J. D. Ireland, III |
Director | May 25, 2007 | ||
| * F. R. McAllister |
Director | May 25, 2007 | ||
| * R. Phillips |
Director | May 25, 2007 | ||
| * R. K. Riederer |
Director | May 25, 2007 | ||
| * A. Schwartz |
Director | May 25, 2007 | ||
| * | The undersigned, by signing her name hereto, does sign and execute this Annual Report on Form 10-K pursuant to a Power of Attorney executed on behalf of the above-indicated officers and directors of the registrant and filed herewith as Exhibit 24 on behalf of the registrant. |
| By: | /s/ Laurie Brlas | |
| (Laurie Brlas, as Attorney-in-Fact) | ||
160
EXHIBIT INDEX
All documents referenced below were filed pursuant to the Securities Exchange Act of 1934 by Cleveland-Cliffs Inc, file number 1-09844, unless otherwise indicated.
| Exhibit |
Pagination by | |||
| Plan of acquisition, reorganization, arrangement, liquidation or succession | ||||
| 2(a) |
# Share Purchase Agreement by and among Cliffs International Lux IV Sarl, Centennial Asset Mining Fund LLC, Eike Fuhrken Batista, and, for limited purposes, MMX Mineração e Metálicos S.A. dated December 12, 2006 | Filed Herewith | ||
| Articles of Incorporation and By-Laws of Cleveland-Cliffs Inc | ||||
| 3(a) |
Amended Articles of Incorporation of Cleveland-Cliffs Inc as filed with the Secretary of State of the State of Ohio on January 20, 2004 (filed as Exhibit 3(a) to Form 10-K of Cleveland-Cliffs Inc on February 13, 2004 and incorporated by reference) | Not Applicable | ||
| 3(b) |
Amendment to Amended Articles of Incorporation as filed with the Secretary of State of the State of Ohio on November 30, 2004 (filed as Exhibit 3(a) to Form 8-K on November 30, 2004 and incorporated by reference) | Not Applicable | ||
| 3(c) |
Amendment No. 2 to Amended Articles of Incorporation as filed with the Secretary of State of the State of Ohio (filed as Exhibit 3(a) to Form 8-K of Cleveland-Cliffs Inc on June 9, 2006 and incorporated by reference) | Not Applicable | ||
| 3(d) |
Regulations of Cleveland-Cliffs Inc (filed as Exhibit 3(b) to Form 10-K of Cleveland-Cliffs Inc filed on February 2, 2001 and incorporated by reference) | Not Applicable | ||
| Instruments defining rights of security holders, including indentures | ||||
| 4(a) |
Form of Common Share | Filed Herewith | ||
| 4(b) |
Form of Series A-2 Preferred Stock Certificate (filed as Exhibit 4(b) to Form 10-K of Cleveland-Cliffs Inc on February 13, 2004 and incorporated by reference) | Not Applicable | ||
| 4(c) |
Rights Agreement, dated September 19, 1997, by and between Cleveland-Cliffs Inc and Computershare Trust Company, N.A. (successor-in-interest to First Chicago Trust Company of New York), as Rights Agent (filed as Exhibit 4(b) to Form 10-K of Cleveland-Cliffs Inc filed on February 5, 2002 and incorporated by reference) | Not Applicable | ||
| 4(d) |
Amendment No. 1, effective as of November 15, 2001, to the Rights Agreement by and between Cleveland-Cliffs Inc and Computershare Trust Company, N.A. (successor-in-interest to First Chicago Trust Company of New York), as Rights Agent (filed as Exhibit 4.1 to Amendment No. 1 to Form 8-A of Cleveland-Cliffs Inc filed on December 14, 2001 and incorporated by reference) | Not Applicable | ||
| 4(e) |
Registration Rights Agreement, dated as of January 21, 2004, by and between Cleveland-Cliffs Inc and Morgan Stanley & Co. Incorporated (filed as Exhibit 4(e) to Form 10-K of Cleveland-Cliffs Inc on February 13, 2004 and incorporated by reference) | Not Applicable | ||
| 4(f) |
Multicurrency Credit Agreement, entered into as of June 23, 2006, among Cleveland-Cliffs Inc, 16 various institutions, and Fifth Third Bank as Administrative Agent and L/C Issuer, and Bank of America N.A. as Syndication Agent (filed as Exhibit 4(a) to Form 8-K of Cleveland-Cliffs Inc on June 27, 2006 and incorporated by reference) | Not Applicable | ||
| # | The Company agrees to furnish supplementally a copy of any omitted exhibits or schedules to the Securities and Exchange Commission upon request. |
161
| Exhibit |
Pagination by | |||
| 4(g) |
First Amendment to Multicurrency Credit Agreement effective January 31, 2007 by and among Cleveland-Cliffs Inc, and the Required Lenders, and Fifth Third Bank, as Administrative Agent and L/C Issuer | Filed Herewith | ||
| 4(h) |
Second Amendment to Multicurrency Credit Agreement effective February 16, 2007 by and among Cleveland-Cliffs Inc, and the Required Lenders, and Fifth Third Bank, as Administrative Agent and L/C Issuer | Filed Herewith | ||
| 4(i) |
Third Amendment and Waiver to Multicurrency Credit Agreement entered into as of March 30, 2007 by Cleveland-Cliffs Inc, and the Required Lenders, and Fifth Third Bank as Administrative Agent and L/C Issuer | Filed Herewith | ||
| 4(j) |
Fourth Amendment and Waiver to Multicurrency Credit Agreement entered into as of May 23, 2007 by Cleveland-Cliffs Inc, the Required Lenders and Fifth Third Bank as Administrative Agent and L/C Issuer | Filed Herewith | ||
| Material Contracts | ||||
| 10(a) |
* Cleveland-Cliffs Inc Supplemental Retirement Benefit Plan (as Amended and Restated, effective January 1, 2001) (filed as Exhibit 10(c) to Form 10-Q of Cleveland-Cliffs Inc on July 27, 2001 and incorporated by reference) | Not Applicable | ||
| 10(b) |
* Amendment No. 1 to the Cleveland-Cliffs Inc Supplemental Retirement Benefit Plan (as Amended and Restated effective January 1, 2001), dated as of November 13, 2001 (filed as Exhibit 10(b) to Form 10-K of Cleveland-Cliffs Inc on February 5, 2002 and incorporated by reference) | Not Applicable | ||
| 10(c) |
* Amendment No. 2 to the Cleveland-Cliffs Inc Supplemental Retirement Benefit Plan (as Amended and Restated effective January 1, 2001) dated September 11, 2006 | Filed Herewith | ||
| 10(d) |
* Amendment No. 3 to the Cleveland-Cliffs Inc Supplemental Retirement Benefit Plan (as Amended and Restated effective January 1, 2001) dated December 29, 2006 and effective December 1, 2006 | Filed Herewith | ||
| 10(e) |
* Severance Agreements dated as of January 1, 2000, by and between Cleveland-Cliffs Inc and certain executive officers (filed as Exhibit 10(b) to Form 10-K of Cleveland-Cliffs Inc on March 16, 2000 and incorporated by reference) | Not Applicable | ||
| 10(f) |
* Form of Severance Agreement by and between Cleveland-Cliffs Inc and certain elected officers of the Company dated as of May 19, 2006 and effective as of May 8, 2006 (filed as Exhibit 10(a) to Form 8-K of Cleveland-Cliffs Inc on May 25, 2006 and incorporated by reference) | Not Applicable | ||
| 10(g) |
* Severance Agreement dated as of April 16, 2001 by and between Cleveland-Cliffs Inc and David H. Gunning (filed as Exhibit 10(b) to Form 10-Q of Cleveland-Cliffs Inc filed on July 27, 2001, and incorporated by reference) | Not Applicable | ||
| 10(h) |
* Severance Agreement by and between Cleveland-Cliffs and Donald J. Gallagher, dated as of March 9, 2004 (filed as Exhibit 10(b) to Form 10-Q of Cleveland-Cliffs Inc on July 29, 2004 and incorporated by reference) | Not Applicable | ||
| 10(i) |
* Severance Agreement by and between Cleveland-Cliffs Inc and Joseph A. Carrabba, dated as of May 23, 2005 (filed as Exhibit 10(a) to Form 10-Q of Cleveland-Cliffs Inc on July 28, 2005 and incorporated by reference) | Not Applicable | ||
| 10(j) |
* Amendment No. 1 to Annex A to the Severance Agreement between Cleveland-Cliffs Inc and Joseph A. Carrabba effective May 9, 2006 (filed as Exhibit 10(a) to Form 8-K of Cleveland-Cliffs Inc on May 10, 2006 and incorporated by reference) | Not Applicable | ||
| * | Reflects management contract or other compensatory arrangement required to be filed as an Exhibit pursuant to Item 15(c) of this Report. |
162
| Exhibit |
Pagination by | |||
| 10(k) |
* Severance Agreement by and between Cleveland-Cliffs Inc and Laurie Brlas dated February 20, 2007 and effective as of January 8, 2007 (filed as Exhibit 10(a) to Form 8-K of Cleveland-Cliffs Inc on February 21, 2007 and incorporated by reference) | Not Applicable | ||
| 10(l) |
* Letter Agreement of Employment by and between Cleveland-Cliffs Inc and Joseph A. Carrabba dated April 29, 2005 (filed as Exhibit 10(b) to Form 10-Q of Cleveland-Cliffs Inc on July 28, 2005 and incorporated by reference) | Not Applicable | ||
| 10(m) |
* Letter Agreement of Employment by and between Cleveland-Cliffs Inc and Laurie Brlas dated November 22, 2006 (filed as Exhibit 10(a) to Form 8-K of Cleveland-Cliffs Inc on November 28, 2006 and incorporated by reference) | Not Applicable | ||
| 10(n) |
* Letter Agreement of Employment by and between Cleveland-Cliffs Inc and William Brake dated April 4, 2007 (filed as Exhibit 10(a) to Form 8-K of Cleveland-Cliffs Inc on April 10, 2007 and incorporated by reference) | Not Applicable | ||
| 10(o) |
* Cleveland-Cliffs Inc and Subsidiaries Management Performance Incentive Plan, effective as of January 1, 2004 (Summary Description) (filed as Exhibit 10(c) to Form 10-Q of Cleveland-Cliffs Inc on July 29, 2004 and incorporated by reference) | Not Applicable | ||
| 10(p) |
* Form of Indemnification Agreement with Directors (filed as Exhibit 10(f) to Form 10-K of Cleveland-Cliffs Inc on February 2, 2001 and incorporated by reference) | Not Applicable | ||
| 10(q) |
* Director and Officer Indemnification Agreement, dated as of July 10, 2001 by and between Cleveland-Cliffs Inc and David H. Gunning (filed as Exhibit 10(a) to Form 10-Q on October 25, 2001 and incorporated by reference) | Not Applicable | ||
| 10(r) |
* Cleveland-Cliffs Inc 1992 Incentive Equity Plan (as Amended and Restated as of May 13, 1997), effective as of May 13, 1997 (filed as Exhibit 10(i) to Form 10-K of Cleveland-Cliffs Inc on February 5, 2002 and incorporated by reference) | Not Applicable | ||
| 10(s) |
* Amendment to the Cleveland-Cliffs Inc 1992 Incentive Equity Plan (as Amended and Restated as of May 13, 1997), effective May 11, 1999 (filed as Appendix A to Proxy Statement of Cleveland-Cliffs Inc on March 22, 1999 and incorporated by reference) | Not Applicable | ||
| 10(t) |
* Form of Restricted Shares Agreement under the 1992 Incentive Equity Plan (as Amended and Restated as of May 13, 1997) as amended, authorized by the Compensation & Organization Committee of the Company and effective as of March 8, 2005 (filed as Exhibit 10(a) to Form 8-K of Cleveland-Cliffs Inc on March 14, 2005 and incorporated by reference) | Not Applicable | ||
| 10(u) |
* Form of Amendment No. 1 to the Cleveland-Cliffs Inc Restricted Shares Agreement dated March 8, 2005 (filed as Exhibit 10(b) to Form 8-K of Cleveland-Cliffs Inc on December 1, 2005 and incorporated by reference) | Not Applicable | ||
| 10(v) |
* Form of the Restricted Shares Agreement under the 1992 Incentive Equity Plan (as Amended and Restated as of May 13, 1997) as amended, between Cleveland-Cliffs Inc and Joseph A. Carrabba effective May 23, 2005 (filed as Exhibit 10(c) to Form 10-Q of Cleveland-Cliffs Inc on July 28, 2005 and incorporated by reference) | Not Applicable | ||
| 10(w) |
* Form of the 2006 Restricted Shares Agreement for the Retirement Eligible Employee (filed as Exhibit 99(a) to Form 8-K of Cleveland-Cliffs Inc on March 17, 2006 and incorporated by reference) | Not Applicable | ||
| 10(x) |
* Form of the 2006 Restricted Shares Agreement for the Non-Retirement Eligible Employee (filed as Exhibit 99(b) to Form 8-K of Cleveland-Cliffs Inc on March 17, 2006 and incorporated by reference) | Not Applicable | ||
| * | Reflects management contract or other compensatory arrangement required to be filed as an Exhibit pursuant to Item 15(c) of this Report. |
163
| Exhibit |
Pagination by | |||
| 10(y) |
* Form of the 2006 Restricted Shares Agreement for David H. Gunning (filed as Exhibit 99(c) to Form 8-K of Cleveland-Cliffs Inc on March 17, 2006 and incorporated by reference) | Not Applicable | ||
| 10(z) |
* Amendment to Restricted Shares Agreements for John S. Brinzo as set forth by Cleveland-Cliffs Inc dated September 18, 2006 and effective as of September 1, 2006 | Filed Herewith | ||
| 10(aa) |
* Amendment to Restricted Shares Agreements for John S. Brinzo by Cleveland-Cliffs Inc dated May 17, 2007 and effective as of May 9, 2007 | Filed Herewith | ||
| 10(bb) |
* Amended and Restated Cleveland-Cliffs Inc Retirement Plan for Non-Employee Directors dated as of July 1, 1995 (filed as Exhibit 10(l) to Form 10-K of Cleveland-Cliffs Inc on February 2, 2001 and incorporated by reference) | Not Applicable | ||
| 10(cc) |
* Amendment to Amended and Restated Cleveland-Cliffs Inc Retirement Plan for Non-Employee Directors dated as of January 1, 2001 (filed as Exhibit 10(d) to Form 10-Q of Cleveland-Cliffs Inc on July 27, 2001 and incorporated by reference) | |||
| 10(dd) |
* Second Amendment to the Amended and Restated Cleveland-Cliffs Inc Retirement Plan for Non-Employee Directors effective as of January 14, 2003 (filed as Exhibit 10(a) to Form 10-Q of Cleveland-Cliffs Inc on April 24, 2003 and incorporated by reference) | Not Applicable | ||
| 10(ee) |
* Trust Agreement No. 1 (Amended and Restated effective June 1, 1997), dated June 12, 1997, by and between Cleveland-Cliffs Inc and KeyBank National Association, Trustee, with respect to the Cleveland-Cliffs Inc Supplemental Retirement Benefit Plan, Severance Pay Plan for Key Employees and certain executive agreements (filed as Exhibit 10(o) to Form 10-K of Cleveland-Cliffs Inc on February 5, 2002 and incorporated by reference) | Not Applicable | ||
| 10(ff) |
* Trust Agreement No. 1 Amendments to Exhibits, effective as of January 1, 2000, by and between Cleveland-Cliffs Inc and KeyBank National Association, as Trustee (filed as Exhibit 10(n) to Form 10-K of Cleveland-Cliffs Inc on March 16, 2000 and incorporated by reference) | Not Applicable | ||
| 10(gg) |
* First Amendment to Trust Agreement No. 1, effective September 10, 2002, by and between Cleveland-Cliffs Inc and KeyBank National Association, as Trustee (filed as Exhibit 10(p) to Form 10-K of Cleveland-Cliffs Inc on February 5, 2003 and incorporated by reference) | Not Applicable | ||
| 10(hh) |
* Amended and Restated Trust Agreement No. 2, effective as of October 15, 2002, by and between Cleveland-Cliffs Inc and KeyBank National Association, Trustee, with respect to Executive Agreements and Indemnification Agreements with the Company’s Directors and certain Officers, the Company’s Severance Pay Plan for Key Employees, and the Retention Plan for Salaried Employees (filed as Exhibit 10(q) to Form 10-K of Cleveland-Cliffs Inc on February 5, 2003 and incorporated by reference) | Not Applicable | ||
| 10(ii) |
* Trust Agreement No. 5, dated as of October 28, 1987, by and between Cleveland-Cliffs Inc and KeyBank National Association, Trustee, with respect to the Cleveland-Cliffs Inc Voluntary Non-Qualified Deferred Compensation Plan (filed as Exhibit 10(v) to Form 10-K of Cleveland-Cliffs Inc on February 2, 2001 and incorporated by reference) | Not Applicable | ||
| * | Reflects management contract or other compensatory arrangement required to be filed as an Exhibit pursuant to Item 15(c) of this Report. |
164
| Exhibit |
Pagination by | |||
| 10(jj) |
* First Amendment to Trust Agreement No. 5, dated as of May 12, 1989, by and between Cleveland-Cliffs Inc and KeyBank National Association, Trustee (filed as Exhibit 10(x) to Form 10-K of Cleveland-Cliffs Inc on February 2, 2001 and incorporated by reference) | Not Applicable | ||
| 10(kk) |
* Second Amendment to Trust Agreement No. 5, dated as of April 9, 1991, by and between Cleveland-Cliffs Inc and KeyBank National Association, Trustee (filed as Exhibit 10(y) to Form 10-K of Cleveland-Cliffs Inc on February 2, 2001 and incorporated by reference) | Not Applicable | ||
| 10(ll) |
* Third Amendment to Trust Agreement No. 5, dated as of March 9, 1992, by and between Cleveland-Cliffs Inc and KeyBank National Association, Trustee (filed as Exhibit 10(z) to Form 10-K of Cleveland-Cliffs Inc on February 2, 2001 and incorporated by reference) | Not Applicable | ||
| 10(mm) |
* Fourth Amendment to Trust Agreement No. 5, dated November 18, 1994, by and between Cleveland-Cliffs Inc and KeyBank National Association, Trustee (filed as Exhibit 10(w) to Form 10-K of Cleveland-Cliffs Inc on March 16, 2000 and incorporated by reference) | Not Applicable | ||
| 10(nn) |
* Fifth Amendment to Trust Agreement No. 5, dated May 23, 1997, by and between Cleveland-Cliffs Inc and KeyBank National Association, Trustee (filed as Exhibit 10(cc) to Form 10-K of Cleveland-Cliffs Inc on February 5, 2002 and incorporated by reference) | Not Applicable | ||
| 10(oo) |
* Trust Agreement No. 7, dated as of April 9, 1991, by and between Cleveland-Cliffs Inc and KeyBank National Association, Trustee, with respect to the Cleveland-Cliffs Inc Supplemental Retirement Benefit Plan (filed as Exhibit 10(ee) to Form 10-K of Cleveland-Cliffs Inc on February 2, 2001 and incorporated by reference) | Not Applicable | ||
| 10(pp) |
* First Amendment to Trust Agreement No. 7, by and between Cleveland-Cliffs Inc and KeyBank National Association, Trustee, dated as of March 9, 1992 (filed as Exhibit 10(ff) to Form 10-K of Cleveland-Cliffs Inc on February 2, 2001 and incorporated by reference) | Not Applicable | ||
| 10(qq) |
* Second Amendment to Trust Agreement No. 7, dated November 18, 1994, by and between Cleveland-Cliffs Inc and KeyBank National Association, Trustee (filed as Exhibit 10(bb) to Form 10-K of Cleveland-Cliffs Inc on March 16, 2000 and incorporated by reference) | Not Applicable | ||
| 10(rr) |
* Third Amendment to Trust Agreement No. 7, dated May 23, 1997, by and between Cleveland-Cliffs Inc and KeyBank National Association, Trustee (filed as Exhibit 10(ii) to Form 10-K of Cleveland-Cliffs Inc on February 5, 2002 and incorporated by reference) | Not Applicable | ||
| 10(ss) |
* Fourth Amendment to Trust Agreement No. 7, dated July 15, 1997, by and between Cleveland-Cliffs Inc and KeyBank National Association, Trustee (filed as Exhibit 10(jj) to Form 10-K of Cleveland-Cliffs Inc on February 5, 2002 and incorporated by reference) | Not Applicable | ||
| 10(tt) |
* Amendment to Exhibits to Trust Agreement No. 7, effective as of January 1, 2000, by and between Cleveland-Cliffs Inc and KeyBank National Association, Trustee (filed as Exhibit 10(ee) to Form 10-K of Cleveland-Cliffs Inc on March 16, 2000 and incorporated by reference) | Not Applicable | ||
| * | Reflects management contract or other compensatory arrangement required to be filed as an Exhibit pursuant to Item 15(c) of this Report. |
165
| Exhibit |
Pagination by | |||
| 10(uu) |
* Trust Agreement No. 8, dated as of April 9, 1991, by and between Cleveland-Cliffs Inc and KeyBank National Association, Trustee, with respect to the Cleveland-Cliffs Inc Retirement Plan for Non-Employee Directors (filed as Exhibit 10(kk) to Form 10-K of Cleveland-Cliffs Inc on February 2, 2001 and incorporated by reference) | Not Applicable | ||
| 10(vv) |
* First Amendment to Trust Agreement No. 8, dated as of March 9, 1992, by and between Cleveland-Cliffs Inc and KeyBank National Association, Trustee (filed as Exhibit 10(ll) to Form 10-K of Cleveland-Cliffs Inc on February 2, 2001 and incorporated by reference) | Not Applicable | ||
| 10(ww) |
* Second Amendment to Trust Agreement No. 8, dated June 12, 1997, by and between Cleveland-Cliffs Inc and KeyBank National Association, Trustee (filed as Exhibit 10(nn) to Form 10-K of Cleveland-Cliffs Inc on February 5, 2002 and incorporated by reference) | Not Applicable | ||
| 10(xx) |
* Trust Agreement No. 9, dated as of November 20, 1996, by and between Cleveland-Cliffs Inc and KeyBank National Association, Trustee, with respect to the Cleveland-Cliffs Inc Nonemployee Directors’ Supplemental Compensation Plan (filed as Exhibit 10(oo) to Form 10-K of Cleveland-Cliffs Inc on February 5, 2002 and incorporated by reference) | Not Applicable | ||
| 10(yy) |
* Trust Agreement No. 10, dated as of November 20, 1996, by and between Cleveland-Cliffs Inc KeyBank National Association, Trustee, with respect to the Cleveland-Cliffs Inc Nonemployee Directors’ Compensation Plan (filed as Exhibit 10(pp) to Form 10-K of Cleveland-Cliffs Inc on February 5, 2002 and incorporated by reference) | Not Applicable | ||
| 10(zz) |
* Cleveland-Cliffs Inc Change in Control Severance Pay Plan, effective as of January 1, 2000 (filed as Exhibit 10(jj) to Form 10-K of Cleveland-Cliffs Inc on March 16, 2000 and incorporated by reference) | Not Applicable | ||
| 10(aaa) |
* Cleveland-Cliffs Inc Voluntary Non-Qualified Deferred Compensation Plan (Amended and Restated as of January 1, 2000) (filed as Exhibit 10(a) to Form 10-Q of Cleveland-Cliffs Inc on July 27, 2000 and incorporated by reference) | Not Applicable | ||
| 10(bbb) |
* Cleveland-Cliffs Inc Long-Term Incentive Program, effective as of May 8, 2000 (filed as Exhibit 10(rr) to Form 10-K of Cleveland-Cliffs Inc on February 2, 2001 and incorporated by reference) | Not Applicable | ||
| 10(ccc) |
* Amendment No. 1 to the Long-Term Incentive Program dated May 8, 2006 and effective as of January 1, 2006 (filed as Exhibit 10(b) to Form 8-K of Cleveland-Cliffs Inc on May 12, 2006 and incorporated by reference) | Not Applicable | ||
| 10(ddd) |
* Cleveland-Cliffs Inc 2000 Retention Unit Plan, effective as of May 8, 2000 (filed as Exhibit 10(ss) to Form 10-K of Cleveland-Cliffs Inc on February 2, 2001 and incorporated by reference) | Not Applicable | ||
| 10(eee) |
* Form of Long-Term Incentive Program Participant Grant and Agreement for Performance Period 2003-2005 (filed as Exhibit 10(pp) to Form 10-K of Cleveland-Cliffs Inc on March 1, 2005 and incorporated by reference) | Not Applicable | ||
| 10(fff) |
* Form of Long-Term Incentive Program Participant Grant and Agreement for Performance Period 2004-2006, as corrected by the Performance Shares and Retention Units Award 2004-2006 Performance Period Tax Election Form containing the Notice of change effective February 1, 2007 | Filed Herewith | ||
| * | Reflects management contract or other compensatory arrangement required to be filed as an Exhibit pursuant to Item 15(c) of this Report. |
166
| Exhibit |
Pagination by | |||
| 10(ggg) |
* Form of Long-Term Incentive Program Participant Grant and Agreement for Performance Period 2005-2007 (filed as Exhibit 10(a) to Form 8-K of Cleveland-Cliffs Inc on March 15, 2005 and incorporated by reference) | Not Applicable | ||
| 10(hhh) |
* Amendment No. 1 to the Long-Term Incentive Program Participant Grant and Agreement for Performance Period 2005-2007 (filed as Exhibit 99(a) to Form 8-K of Cleveland-Cliffs Inc on February 21, 2006 and incorporated by reference) | Not Applicable | ||
| 10(iii) |
* Form of Long-Term Incentive Program Participant Grant and Agreement Year 2006 for Performance Period 2006-2008 (filed as Exhibit 10(a) to Form 8-K of Cleveland-Cliffs Inc on May 12, 2006 and incorporated by reference) | Not Applicable | ||
| 10(jjj) |
* Amendment No. 1 to Long-Term Incentive Program Participant Grant and Agreement for Joseph A. Carrabba as set forth by Cleveland-Cliffs Inc dated September 15, 2006 and effective as of September 1, 2006 | Filed Herewith | ||
| 10(kkk) |
* Amendment No. 1 to Long-Term Incentive Program Participant Grant and Agreements for John S. Brinzo as set forth by Cleveland-Cliffs Inc dated September 18, 2006 and effective as of September 1, 2006 | Filed Herewith | ||
| 10(lll) |
* Amendment No. 2 to Long-Term Incentive Program Participant Grant and Agreements for John S. Brinzo as set forth by Cleveland-Cliffs Inc dated March 23, 2007 and effective as of September 1, 2006 | Filed Herewith | ||
| 10(mmm) |
* Form of Long-Term Incentive Program Method of Calculation of Payout of Performance Shares Election Form for the Long-Term Incentive Program Grants and Agreements Years 2005 and 2006 | Filed Herewith | ||
| 10(nnn) |
* Cleveland-Cliffs Inc Nonemployee Directors’ Supplemental Compensation Plan, effective as of July 1, 1995 (filed as Exhibit 10(tt) to Form 10-K of Cleveland-Cliffs Inc on February 2, 2001 and incorporated by reference) | Not Applicable | ||
| 10(ooo) |
* First Amendment to Cleveland-Cliffs Inc Nonemployee Directors’ Supplemental Compensation Plan, effective as of January 1, 1999 (filed as Exhibit 10(mm) to Form 10-K of Cleveland-Cliffs Inc on March 25, 1999 and incorporated by reference) | Not Applicable | ||
| 10(ppp) |
* Second Amendment to Cleveland-Cliffs Inc Nonemployee Directors’ Supplemental Compensation Plan, effective as of January 14, 2003 (filed as Exhibit 10(b) to Form 10-Q of Cleveland-Cliffs Inc on April 24, 2003 and incorporated by reference) | Not Applicable | ||
| 10(qqq) |
* Cleveland-Cliffs Inc Nonemployee Directors’ Compensation Plan (Amended and Restated as of January 1, 2005) (filed as Exhibit 10(d) to Form 10-K of Cleveland-Cliffs Inc on February 21, 2006 and incorporated by reference) | Not Applicable | ||
| 10(rrr) |
** Pellet Sale and Purchase Agreement, dated and effective as of January 31, 2002, by and among The Cleveland-Cliffs Iron Company, Cliffs Mining Company, Northshore Mining Company and Algoma Steel Inc. (filed as Exhibit 10(a) to Form 10-Q of Cleveland-Cliffs Inc on April 25, 2002 and incorporated by reference) | Not Applicable | ||
| 10(sss) |
** Pellet Sale and Purchase Agreement, dated and effective as of April 10, 2002, by and among The Cleveland-Cliffs Iron Company, Cliffs Mining Company, Northshore Mining Company, Northshore Sales Company, International Steel Group Inc., ISG Cleveland Inc., and ISG Indiana Harbor Inc. (filed as Exhibit 10(a) to Form 10-Q of Cleveland-Cliffs Inc on July 25, 2002 and incorporated by reference) | Not Applicable | ||
| * | Reflects management contract or other compensatory arrangement required to be filed as an Exhibit pursuant to Item 15(c) of this Report. |
| ** | Confidential treatment requested and/or approved as to certain portions, which portions have been omitted and filed separately with the Securities and Exchange Commission. |
167
| Exhibit |
Pagination by | |||
| 10(ttt) |
** First Amendment to Pellet/Sale and Purchase Agreement, dated and effective December 16, 2004, by and among The Cleveland-Cliffs Iron Company, Cliffs Mining Company, Northshore Mining Company, Cliffs Sales Company (formerly known as Northshore Sales Company), International Steel Group Inc., ISG Cleveland Inc., and ISG Indiana Harbor (filed as Exhibit 10(a) to Form 8-K of Cleveland-Cliffs Inc on December 29, 2004, and incorporated by reference) | Not Applicable | ||
| 10(uuu) |
** Pellet Sale and Purchase Agreement, dated and effective as of December 31, 2002, by and among The Cleveland-Cliffs Iron Company, Cliffs Mining Company, and Ispat Inland Inc. (filed as Exhibit 10(vv) to Form 10-K of Cleveland-Cliffs Inc filed on February 5, 2003, and incorporated by reference) | Not Applicable | ||
| 10(vvv) |
** Amended and Restated Pellet Sale and Purchase Agreement, dated and effective as of May 17, 2004, by and among Cleveland-Cliffs Iron Company, Cliffs Mining Company, Northshore Mining Company, Cliffs Sales Company, International Steel Group Inc., and ISG Weirton Inc. (filed as Exhibit 10(a) of Form 8-K of Cleveland-Cliffs Inc on September 21, 2004, and incorporated by reference) | Not Applicable | ||
| 10(www) |
** Umbrella Agreement between Mittal Steel USA and Cleveland-Cliffs Inc, Cleveland-Cliffs Iron Company, Cliffs Mining Company, Northshore Mining Company, and Cliffs Sales Company amending three existing pellet sales contracts for Mittal Steel USA-Indiana Harbor West (Exhibit 10(sss) and 10(ttt) above in this index), Mittal Steel USA-Indiana Harbor East (Exhibit 10(uuu) above in this index), and Mittal Steel USA-Weirton (Exhibit 10(vvv) above in this index) dated as of March 1, 2007 and effective as of April 12, 2006 | Filed Herewith | ||
| 10(xxx) |
** Amended and Restated Pellet Sale and Purchase Agreement, dated and effective January 1, 2006 by and among Cliffs Sales Company, Cleveland-Cliffs Iron Company, Cliffs Mining Company, and Severstal North America, Inc. (filed as Exhibit 10(fff) of Form 10-K of Cleveland-Cliffs Inc on February 21, 2006 and incorporated by reference) | Not Applicable | ||
| 10(yyy) |
Interim Agreement between Wisconsin Electric Power Company and Tilden Mining Company L.C., and Empire Iron Mining Partnership dated and effective May 5, 2006 (filed as Exhibit 10(f) to Form 10-Q of Cleveland-Cliffs Inc on July 27, 2006 and incorporated by reference) | Not Applicable | ||
| 10(zzz) |
** Pellet Sale and Purchase Agreement by and among the Cleveland-Cliffs Iron Company, Cliffs Sales Company, and AK Steel Corporation dated November 10, 2006 and effective January 1, 2007 through December 31, 2013 (filed as Exhibit 10(a) to Form 8-K of Cleveland-Cliffs Inc on November 15, 2006 and incorporated by reference) | Not Applicable | ||
| 12 |
Ratio of Earnings To Combined Fixed Charges And Preferred Stock Dividend Requirements |
Filed Herewith | ||
| 21 |
Subsidiaries of the registrant | Filed Herewith | ||
| * | Reflects management contract or other compensatory arrangement required to be filed as an Exhibit pursuant to Item 15(c) of this Report. |
| ** | Confidential treatment requested and/or approved as to certain portions, which portions have been omitted and filed separately with the Securities and Exchange Commission. |
168
| Exhibit |
Pagination by | |||
| 23 |
Consent of independent auditors | Filed Herewith | ||
| 24 |
Power of Attorney | Filed Herewith | ||
| 31(a) |
Certification Pursuant to 15 U.S.C. Section 7241, as Adopted Pursuant to Section 302 of the Sarbanes-Oxley Act of 2002, signed and dated by Joseph A. Carrabba as of March 1, 2007 | Filed Herewith | ||
| 31(b) |
Certification Pursuant to 15 U.S.C. Section 7241, as Adopted Pursuant to Section 302 of the Sarbanes-Oxley Act of 2002, signed and dated by Laurie Brlas as of March 1, 2007 | Filed Herewith | ||
| 32(a) |
Certification Pursuant to 18 U.S.C. Section 1350, as Adopted Pursuant to Section 906 of the Sarbanes-Oxley Act of 2002, signed and dated by Joseph A. Carrabba, President and Chief Executive Officer of Cleveland-Cliffs Inc, as of March 1, 2007 | Filed Herewith | ||
| 32(b) |
Certification Pursuant to 18 U.S.C. Section 1350, as Adopted Pursuant to Section 906 of the Sarbanes-Oxley Act of 2002, signed and dated by Laurie Brlas, Senior Vice President, Chief Financial Officer and Treasurer of Cleveland-Cliffs Inc, as of March 1, 2007 | Filed Herewith | ||
| 99(a) |
Schedule II — Valuation and Qualifying Account | Filed Herewith | ||
| * | Reflects management contract or other compensatory arrangement required to be filed as an Exhibit pursuant to Item 15(c) of this Report. |
| ** | Confidential treatment requested and/or approved as to certain portions, which portions have been omitted and filed separately with the Securities and Exchange Commission. |
169
