
UNITED STATES SECURITIES AND EXCHANGE COMMISSION
Washington, D.C. 20549
FORM 10-K
| x | ANNUAL REPORT PURSUANT TO SECTION 13 OR 15(d) OF THE SECURITIES EXCHANGE ACT OF 1934 |
For the fiscal year ended December 31, 2009
OR
| ¨ | TRANSITION REPORT PURSUANT TO SECTION 13 OR 15(d) OF THE SECURITIES EXCHANGE ACT OF 1934 |
For the transition period from to .
Commission File Number: 1-8944
CLIFFS NATURAL RESOURCES INC.
(Exact Name of Registrant as Specified in Its Charter)
| Ohio | 34-1464672 | |
| (State or Other Jurisdiction of Incorporation or Organization) |
(I.R.S. Employer Identification No.) | |
| 200 Public Square, Cleveland, Ohio | 44114-2315 | |
| (Address of Principal Executive Offices) | (Zip Code) | |
Registrant’s Telephone Number, Including Area Code: (216) 694-5700
Securities registered pursuant to Section 12(b) of the Act:
| Title of Each Class |
Name of Each Exchange on Which Registered | |
| Common Shares, par value $0.125 per share Common Share Purchase Rights |
New York Stock Exchange and Professional Segment of NYSE Euronext Paris | |
Securities registered pursuant to Section 12(g) of the Act:
NONE
Indicate by check mark if the registrant is a well-known seasoned issuer, as defined in Rule 405 of the Securities Act. YES x NO ¨
Indicate by check mark if the registrant is not required to file reports pursuant to Section 13 or Section 15(d) of the Act. YES ¨ NO x
Indicate by check mark whether the registrant (1) has filed all reports required to be filed by Section 13 or 15(d) of the Securities Exchange Act of 1934 during the preceding 12 months (or for such shorter period that the registrant was required to file such reports), and (2) has been subject to such filing requirements for the past 90 days. YES x NO ¨
Indicate by check mark whether the registrant has submitted electronically and posted on its corporate Web site, if any, every Interactive Data File required to be submitted and posted pursuant to Rule 405 of Regulation S-T (§232.405 of this chapter) during the preceding 12 months (or for such shorter period that the registrant was required to submit and post such files). YES x NO ¨
Indicate by check mark if disclosure of delinquent filers pursuant to Item 405 of Regulation S-K (§229.405 of this chapter) is not contained herein, and will not be contained, to the best of registrant’s knowledge, in definitive proxy or information statements incorporated by reference in Part III of this Form 10-K or any amendment to this Form 10-K. ¨
Indicate by check mark whether the registrant is a large accelerated filer, an accelerated filer, a non-accelerated filer, or a smaller reporting company. See definitions of “large accelerated filer,” “accelerated filer” and “smaller reporting company” in Rule 12b-2 of the Exchange Act.
Large accelerated filer x Accelerated filer ¨ Non-accelerated filer ¨ Smaller reporting company ¨
Indicate by check mark whether the registrant is a shell company (as defined in Rule 12b-2 of the Act). YES ¨ NO x
As of June 30, 2009, the aggregate market value of the voting and non-voting stock held by non-affiliates of the registrant, based on the closing price of $24.47 per share as reported on the New York Stock Exchange — Composite Index was $3,162,840,459 (excluded from this figure is the voting stock beneficially owned by the registrant’s officers and directors).
The number of shares outstanding of the registrant’s Common Shares, par value $0.125 per share, was 135,224,028 as of February 15, 2010.
DOCUMENTS INCORPORATED BY REFERENCE
Portions of the registrant’s proxy statement for its annual meeting of shareholders scheduled to be held on May 11, 2010 are incorporated by reference into Part III.
| Page No. | ||||
| 2 | ||||
| Item 1. |
4 | |||
| Item 1A. |
21 | |||
| Item 1B. |
29 | |||
| Item 2. |
29 | |||
| Item 3. |
38 | |||
| Item 4. |
41 | |||
| Item 5. |
42 | |||
| Item 6. |
44 | |||
| Item 7. |
Management’s Discussion and Analysis of Financial Condition and Results of Operations |
46 | ||
| Item 7A. |
79 | |||
| Item 8. |
80 | |||
| Item 9. |
Changes in and Disagreements With Accountants on Accounting and Financial Disclosure |
156 | ||
| Item 9A. |
156 | |||
| Item 9B. |
157 | |||
| Item 10. |
158 | |||
| Item 11. |
158 | |||
| Item 12. |
Security Ownership of Certain Beneficial Owners and Management and Related Stockholder Matters |
158 | ||
| Item 13. |
Certain Relationships and Related Transactions, and Director Independence |
159 | ||
| Item 14. |
159 | |||
| Item 15. |
160 | |||
| 161 | ||||
The following abbreviations or acronyms are used in the text. References in this report to the “Company,” “we,” “us,” “our” and “Cliffs” are to Cliffs Natural Resources Inc. and subsidiaries, collectively. References to “A$” or “AUD” refer to Australian currency, “C$” to Canadian currency and “$” to United States currency.
| Abbreviation or acronym |
Term | |
| AAA |
American Arbitration Association | |
| Algoma |
Essar Steel Algoma Inc. | |
| Amapá |
Anglo Ferrous Amapá Mineração Ltda. and Anglo Ferrous Logística Amapá Ltda. | |
| Anglo |
Anglo American plc | |
| APBO |
Accumulated Postretirement Benefit Obligation | |
| ArcelorMittal USA |
ArcelorMittal USA Inc. | |
| ASC |
Accounting Standards Codification | |
| ASU |
Accounting Standards Update | |
| AusQuest |
AusQuest Limited | |
| BART |
Best Available Retrofit Technology | |
| BHP |
BHP Billiton | |
| CAC |
Cliffs Australia Coal Pty Ltd. | |
| CAIR |
Clean Air Interstate Rule | |
| CAWO |
Cliffs Australian Washplant Operations Pty Ltd | |
| CERCLA |
Comprehensive Environmental Response, Compensation and Liability Act | |
| Clean Water Act |
Federal Water Pollution Control Act | |
| Cliffs Erie |
Cliffs Erie LLC | |
| Cockatoo Island |
Cockatoo Island Joint Venture | |
| DEP |
Department of Environment Protection | |
| Directors’ Plan |
Nonemployee Directors’ Compensation Plan, as amended and restated 12/31/2008 | |
| Dofasco |
ArcelorMittal Dofasco Inc. | |
| DSA |
Draft stipulation agreement | |
| EAW |
Environmental Assessment Worksheet | |
| EBIT |
Earnings before interest and taxes | |
| EBITDA |
Earnings before interest, taxes, depreciation and amortization | |
| Empire |
Empire Iron Mining Partnership | |
| EPA |
United States Environmental Protection Agency | |
| EPS |
Earnings per share | |
| Exchange Act |
Securities Exchange Act of 1934 | |
| FASB |
Financial Accounting Standards Board | |
| F.O.B. |
Free on board | |
| GAAP |
Accounting principles generally accepted in the United States | |
| GHG |
Greenhouse gas | |
| Golden West |
Golden West Resources Ltd. | |
| GRI |
Global Reporting Initiative | |
| Hibbing |
Hibbing Taconite Company | |
| ICE Plan |
Incentive Equity Plan | |
| IRS |
Internal Revenue Service | |
| Ispat |
Ispat Inland Steel Company | |
| JORC |
Joint Ore Reserves Code | |
| LIBOR |
London Interbank Offered Rate | |
| LIFO |
Last-in, first-out | |
| LTVSMC |
LTV Steel Mining Company | |
| MDEQ |
Michigan Department of Environmental Quality | |
| MMBtu |
Million British Thermal Units |
2
| Abbreviation or acronym |
Term | |
| MMX |
MMX Mineração e Metálicos S.A. | |
| MP |
Minnesota Power, Inc. | |
| MPCA |
Minnesota Pollution Control Agency | |
| MPSC |
Michigan Public Service Commission | |
| MSHA |
Mine Safety and Health Administration | |
| NBCWA |
National Bituminous Coal Wage Agreement | |
| NDEP |
Nevada Department of Environmental Protection | |
| Northshore |
Northshore Mining Company | |
| NPDES |
National Pollutant Discharge Elimination System | |
| NRD |
Natural Resource Damages | |
| NYSE |
New York Stock Exchange | |
| Oak Grove |
Oak Grove Resources, LLC | |
| OCI |
Other comprehensive income | |
| OPEB |
Other postretirement benefits | |
| PBO |
Projected benefit obligation | |
| Pinnacle |
Pinnacle Mining Company, LLC | |
| PinnOak |
PinnOak Resources, LLC | |
| PolyMet |
PolyMet Mining Inc. | |
| Portman |
Portman Limited (now known as Cliffs Asia Pacific Iron Ore Holdings Pty Ltd) | |
| PRP |
Potentially responsible party | |
| Qcoal |
Qcoal Pty Ltd | |
| renewaFUEL |
renewaFUEL, LLC | |
| RONA |
Return on net assets | |
| RTWG |
Rio Tinto Working Group | |
| SAR |
Stock Appreciation Rights | |
| SEC |
United States Securities and Exchange Commission | |
| Severstal |
Severstal North America, Inc. | |
| Severstal Warren |
Severstal Warren, Inc., formerly known as WCI Steel Inc. | |
| Silver Bay Power |
Silver Bay Power Company | |
| SMM |
Sonoma Mine Management | |
| Sonoma |
Sonoma Coal Project | |
| Sonoma Sales |
Sonoma Sales Pty Ltd | |
| Tilden |
Tilden Mining Company L.C. | |
| TMDL |
Total Maximum Daily Load | |
| Tonne |
Metric ton (equal to 1,000 kilograms or 2,205 pounds) | |
| TSR |
Total Shareholder Return | |
| UMWA |
United Mineworkers of America | |
| United Taconite |
United Taconite LLC | |
| U.S. |
United States of America | |
| U.S. Steel |
United States Steel Corporation | |
| USW |
United Steelworkers | |
| Vale |
Companhia Vale do Rio Doce | |
| VEBA |
Voluntary Employee Benefit Association trusts | |
| VIE |
Variable interest entity | |
| VNQDC Plan |
Voluntary Non-Qualified Deferred Compensation Plan | |
| Wabush |
Wabush Mines Joint Venture | |
| Weirton |
ArcelorMittal Weirton Inc. | |
| WEPCO |
Wisconsin Electric Power Company | |
| Wheeling |
Wheeling-Pittsburgh Steel Corporation |
3
Introduction
Cliffs Natural Resources Inc. traces its corporate history back to 1847. Today, we are an international mining and natural resources company. We are the largest producer of iron ore pellets in North America, a major supplier of direct-shipping lump and fines iron ore out of Australia, and a significant producer of metallurgical coal. With core values of environmental and capital stewardship, our colleagues across the globe endeavor to provide all stakeholders operating and financial transparency as embodied in the GRI framework. Our company’s operations are organized according to product category and geographic location: North American Iron Ore, North American Coal, Asia Pacific Iron Ore, Asia Pacific Coal and Latin American Iron Ore.
In North America, we operate six iron ore mines in Michigan, Minnesota and Eastern Canada, and two coking coal mining complexes located in West Virginia and Alabama. Our Asia Pacific operations are comprised of two iron ore mining complexes in Western Australia, serving the Asian iron ore markets with direct-shipping fines and lump ore, and a 45 percent economic interest in a coking and thermal coal mine located in Queensland, Australia. In Latin America, we have a 30 percent interest in a Brazilian iron ore project. In addition, we have recently established a global exploration group under which we have several projects and potential opportunities to diversify our products, expand our production volumes, extend our mine lives and develop large-scale ore bodies through early involvement in exploration and development activities globally.
Industry Overview
In 2009, global crude steel production, a significant driver of our business, was down approximately 8 percent from 2008 with even greater production declines in some areas, including North America. China produced approximately 567 million tonnes of crude steel in 2009, representing approximately 47 percent of global production. Steel production in China in 2009 has increased 13.5 percent and 16 percent from 2008 and 2007, respectively.
The rapid growth in steel production in China over recent years has only been partially met by a corresponding increase in domestic Chinese iron ore production. Chinese iron ore deposits, although substantial, are of a lower grade (less than half of the equivalent iron ore content) than the current iron ore supplied from Brazil and Australia.
The world price of iron ore is heavily influenced by international demand. With the 2008 global financial crisis and a corresponding weakening of steel demand early in 2009, seaborne contract prices for iron ore pellets, lump and fines decreased 48 percent, 44 percent and 33 percent, respectively. However, worldwide stimulus efforts improved demand during the year and rising spot market prices for iron ore have reflected this trend. The rapid growth in Chinese demand, particularly in more recent years, has created a market imbalance, which continues to indicate demand is outpacing supply. In Asia Pacific, the demand for steelmaking raw materials has remained strong throughout 2009, primarily led by demand from China.
The world market for metallurgical coal in 2009 was influenced less by international demand and more by the geographies where it is consumed. Throughout 2009, reported spot prices in Asia Pacific were strong, trading above an announced settlement price of $129 per metric ton. This strength was influenced by China becoming a net importer of metallurgical coal in 2009. Conversely, in the North American and European markets, demand in 2009 was virtually absent through most of the year as steelmakers inventoried large amounts of coke, the finished steelmaking raw material made from metallurgical coal, during the period of low capacity utilization following the financial crisis and economic downturn.
During the second half of 2009, capacity utilization among steelmaking facilities in North America demonstrated continued improvement, reaching approximately 64 percent at year-end from a low of approximately 35 percent in the beginning of 2009. The industry is showing signs of stabilization, reflecting increasing steel production and the restarting of blast furnaces in North America and Europe. As a result, we
4
have experienced marked improvements in customer demand and market expectations. We have begun to increase production at most of our facilities and have called employees back to work in order to ensure we are positioned to meet increases in demand, while continuing to monitor the markets closely.
Growth Strategy and Recent Developments
Over recent years, we have been executing a strategy designed to achieve scale in the mining industry and focused on serving the world’s largest and fastest growing steel markets. However, the current volatility and uncertainty in global markets, which persisted throughout 2009, coupled with the slowdown in the world’s major economies, has had a significant impact on commodity prices. Throughout 2009, we took proactive measures in response to the high degrees of uncertainty within our industry and the macroeconomic environment as well as to better position ourselves to take advantage of possible opportunities when the market improved. We also continued to focus on cash conservation and generation from our business operations as well as reduction of discretionary capital expenditures, in order to ensure we were positioned to face the challenges and uncertainties associated with the current environment. These actions have allowed us to weather the global financial crisis and continue to pursue our strategic plan.
While maintaining a disciplined approach to our operating activities given the current economic environment, we continue to identify opportunities to grow and at the same time position ourselves to address any uncertainties that lie ahead. We expect to continue increasing our operating scale and presence as an international mining and natural resources company by expanding both geographically and through the minerals we mine and market. Our growth in North America combined with our acquisitions and investments in Australia and Latin America, as well as acquisitions in minerals outside of iron ore, such as metallurgical coal and chromite, illustrates the execution of this strategy. We also expect to achieve growth through early involvement in exploration and development activities by partnering with junior mining companies, which provide us low-cost entry points for potentially significant reserve additions. In 2009, we established a global exploration group, led by professional geologists who have the knowledge and experience to identify new world-class projects for future development or projects that add significant value to existing operations.
Specifically, we continued our strategic growth as an international mining and natural resources company through the following transactions in 2009:
Freewest. On November 23, 2009, we entered into a definitive arrangement with Freewest Resources Canada Inc. (“Freewest”) to acquire Freewest, including its interests in the Ring of Fire properties, which comprise three premier chromite deposits in Ontario, Canada. The acquisition is consistent with our strategy to broaden our mineral diversification and will allow us to apply our expertise in open-pit mining and mineral processing to a chromite ore resource base which would form the foundation of North America’s only ferrochrome production operation. The planned mine is expected to produce 1 to 2 million tonnes of high-grade chromite ore annually, which will be further processed into 400 to 800 thousand tonnes of ferrochrome. The transaction closed on January 27, 2010.
Wabush. On October 12, 2009, we exercised our right of first refusal to acquire U.S. Steel Canada’s and ArcelorMittal Dofasco’s interests in Wabush, thereby increasing our ownership stake in Wabush to 100 percent. Ownership transfer to Cliffs was completed on February 1, 2010 for a purchase price of approximately $88 million, subject to certain working capital adjustments. With Wabush’s 5.5 million tons of rated capacity, acquisition of the remaining interest increased our North American Iron Ore rated equity production capacity by approximately 4.0 million tons.
In addition to completing the acquisition of 100 percent of Wabush, in February 2010, we entered into a new five-year labor agreement with the USW for our Wabush mine. The agreement provides for a 15 percent increase in labor costs over the five-year term of the agreement, inclusive of benefits.
RenewaFUEL. On September 15, 2009, we acquired an additional 20 percent interest in renewaFUEL for a purchase price of approximately $6 million. As a result of this transaction, we have approximately a 90 percent controlling interest in renewaFUEL. This is a strategic investment that provides an opportunity to utilize a “green” solution for further reduction of emissions consistent with our objective to contain costs and enhance efficiencies in a socially responsible manner.
5
Business Segments
Our company’s primary operations are organized and managed according to product category and geographic location: North American Iron Ore, North American Coal, Asia Pacific Iron Ore, Asia Pacific Coal and Latin American Iron Ore. The Asia Pacific Coal and Latin American Iron Ore businesses do not meet the criteria for reportable segments.
All North American business segments are headquartered in Cleveland, Ohio. Our Asia Pacific headquarters is located in Perth, Australia, and our Latin American headquarters is located in Rio de Janeiro, Brazil.
We evaluate segment performance based on sales margin, defined as revenues less cost of goods sold identifiable to each segment. This measure of operating performance is an effective measurement as we focus on reducing production costs throughout the Company. Financial information about our segments is included in Item 7 and NOTE 2 — SEGMENT REPORTING included in Item 8 of this Annual Report on Form 10-K.
North American Iron Ore
We are the largest producer of iron ore pellets in North America and primarily sell our production to integrated steel companies in the United States and Canada. We manage and operate six North American iron ore mines located in Michigan, Minnesota and Eastern Canada that currently have an annual rated capacity of 38.1 million tons of iron ore pellet production, representing 45.1 percent of total North American pellet production capacity.1 Based on our equity ownership in the North American mines we currently operate, our share of the annual rated pellet production capacity is currently 25.6 million tons, representing 30.3 percent of total North American annual pellet capacity.2
The following chart summarizes the estimated annual production capacity and percentage of total North American pellet production capacity for each of the North American iron ore pellet producers as of December 31, 2009:
North American Iron Ore Pellet
Annual Rated Capacity Tonnage
| Current Estimated Capacity (Gross Tons of Raw Ore in Millions) |
Percent of Total North American Capacity |
||||
| All Cliffs’ managed mines |
38.1 | 45.1 | % | ||
| Other U.S. mines |
|||||
| U.S. Steel’s Minnesota ore operations |
|||||
| Minnesota Taconite |
16.0 | 19.0 | |||
| Keewatin Taconite |
5.2 | 6.2 | |||
| Total U.S. Steel |
21.2 | 25.2 | |||
| ArcelorMittal USA Minorca mine |
2.8 | 3.3 | |||
| Total other U.S. mines |
24.0 | 28.5 | |||
| Other Canadian mines |
|||||
| Iron Ore Company of Canada |
13.0 | 15.4 | |||
| ArcelorMittal Mines Canada |
9.3 | 11.0 | |||
| Total other Canadian mines |
22.3 | 26.4 | |||
| Total North American mines |
84.4 | 100.0 | % | ||
| 1 | North American pellet capacity as reported here includes plants in the U.S. and Canada but excludes Mexico. |
| 2 | In October 2009, Cliffs exercised its rights to purchase the remaining equity shares in Wabush Mines that it did not already own from U.S. Steel Canada and ArcelorMittal Dofasco. The figure presented here includes Cliffs’ pre-exercise ownership share in Wabush Mines at 26.8 percent. Cliffs obtained full ownership of Wabush effective February 1, 2010. |
6
We sell our share of North American iron ore production to integrated steel producers, generally pursuant to term supply agreements with various price adjustment provisions.
For the year ended December 31, 2009, we produced a total of 19.6 million tons of iron ore pellets, including 17.1 million tons for our account and 2.5 million tons on behalf of steel company owners of the mines.
We produce 13 grades of iron ore pellets, including standard, fluxed and high manganese, for use in our customers’ blast furnaces as part of the steelmaking process. The variation in grades results from the specific chemical and metallurgical properties of the ores at each mine and whether or not fluxstone is added in the process. Although the grade or grades of pellets currently delivered to each customer are based on that customer’s preferences, which depend in part on the characteristics of the customer’s blast furnace operation, in many cases our iron ore pellets can be used interchangeably. Industry demand for the various grades of iron ore pellets depends on each customer’s preferences and changes from time to time. In the event that a given mine is operating at full capacity, the terms of most of our pellet supply agreements allow some flexibility to provide our customers iron ore pellets from different mines.
Standard pellets require less processing, are generally the least costly pellets to produce and are called “standard” because no ground fluxstone, such as limestone or dolomite, is added to the iron ore concentrate before turning the concentrates into pellets. In the case of fluxed pellets, fluxstone is added to the concentrate, which produces pellets that can perform at higher productivity levels in the customer’s specific blast furnace and will minimize the amount of fluxstone the customer may be required to add to the blast furnace. “High manganese” pellets are the pellets produced at our Canadian Wabush operation where there is more natural manganese in the crude ore than is found at our other operations. The manganese contained in the iron ore mined at Wabush cannot be entirely removed during the concentrating process. Wabush produces pellets with two levels of manganese, both in standard and fluxed grades.
It is not possible to produce pellets with identical physical and chemical properties from each of our mining and processing operations. The grade or grades of pellets purchased by and delivered to each customer are based on that customer’s preferences and availability.
Each of our North American Iron Ore mines is located near the Great Lakes or, in the case of Wabush, near the St. Lawrence Seaway, which is connected to the Great Lakes. The majority of our iron ore pellets are transported via railroads to loading ports for shipment via vessel to steelmakers in the U.S. or Canada.
Our North American Iron Ore sales are influenced by seasonal factors in the first quarter of the year as shipments and sales are restricted by weather conditions on the Great Lakes. During the first quarter, we continue to produce our products, but we cannot ship those products via lake freighter until the conditions on the Great Lakes are navigable, which causes our first quarter inventory levels to rise. Our limited practice of shipping product to ports on the lower Great Lakes or to customers’ facilities prior to the transfer of title has somewhat mitigated the seasonal effect on first quarter inventories and sales, as shipment from this point to the customers’ operations is not limited by weather-related shipping constraints. At December 31, 2009 and 2008, we had approximately 1.2 million and 0.4 million tons of pellets, respectively, in inventory at lower lakes or customers’ facilities.
North American Iron Ore Customers
Our North American Iron Ore revenues are primarily derived from sales of iron ore pellets to the North American integrated steel industry, consisting of seven major customers. Generally, we have multi-year supply agreements with our customers. Sales volume under these agreements is largely dependent on customer requirements, and in many cases, we are the sole supplier of iron ore pellets to the customer. Each agreement has a base price that is adjusted annually using one or more adjustment factors. Factors that could result in a price adjustment include international pellet prices, measures of general industrial inflation and steel prices. Additionally, certain of our supply agreements have a provision that limits the amount of price increase or decrease in any given year.
During 2009, 2008 and 2007, we sold 16.4 million, 22.7 million and 22.3 million tons of iron ore pellets, respectively, from our share of the production from our North American Iron Ore mines. The segment’s five
7
largest customers together accounted for a total of 86 percent, 84 percent and 83 percent of North American Iron Ore product revenues for the years 2009, 2008 and 2007, respectively. Refer to Concentration of Customers within Item 1— Business, for additional information regarding our major customers.
North American Coal
We own and operate two North American coking coal mining complexes located in West Virginia and Alabama that currently have a rated capacity of 5.5 million short tons of production annually. In 2009, we sold a total of 1.9 million tons, compared with 3.2 million tons in 2008 and 1.2 million tons for the five months ended December 31, 2007. Each of our North American coal mines are positioned near rail or barge lines providing access to international shipping ports, which allows for export of our coal production.
North American Coal Customers
North American Coal’s production is sold to global integrated steel and coke producers in Europe, Latin America and North America. Approximately 76 percent of our 2009 production and 84 percent of our 2008 production was committed under one-year contracts. This compares with approximately 90 percent of our expected 2010 production as of December 31, 2009, of which 40 percent has been committed under new one-year contracts and carryover tonnage. However, North American negotiations are still ongoing, and international negotiations have recently begun. The remaining tonnage is pending price negotiations primarily with our international customers, which is typically dependent on settlement of Australian benchmark pricing for metallurgical coal later in 2010. Customer contracts in North America typically are negotiated on a calendar year basis with international contracts negotiated as of March 31.
International and North American sales represented 65 percent and 35 percent, respectively, of our North American Coal sales in 2009. This compares with 56 percent and 44 percent, respectively, in 2008 and 66 percent and 34 percent, respectively, in 2007. The segment’s five largest customers together accounted for a total of 75 percent, 76 percent and 79 percent of North American Coal product revenues for the years 2009, 2008 and 2007, respectively. Refer to Concentration of Customers within Item 1— Business, for additional information regarding our major customers.
Asia Pacific Iron Ore
Our Asia Pacific Iron Ore operations are located in Western Australia and include our 100 percent owned Koolyanobbing complex and our 50 percent equity interest in Cockatoo Island. We serve the Asian iron ore markets with direct-shipping fines and lump ore. Production in 2009 was 8.3 million tonnes, compared with 7.7 million tonnes in 2008 and 8.4 million tonnes in 2007.
These two operations supply a total of four direct-shipping export products to Asia via the global seaborne trade market. Koolyanobbing produces a standard lump and fines product as well as a low grade fines product. The low grade products will no longer be available beginning in 2010. Cockatoo Island produces and exports a single premium fines product. The lump products are directly fed to the blast furnace, while the fines products are used as sinter feed. The variation in the four export product grades reflects the inherent chemical and physical characteristics of the ore bodies mined as well as the supply requirements of the customers.
Koolyanobbing is a collective term for the operating deposits at Koolyanobbing, Mount Jackson and Windarling. There are approximately 60 miles separating the three mining areas. Banded iron formations host the mineralization which is predominately hematite and goethite. Each deposit is characterized with different chemical and physical attributes, and in order to achieve customer product quality, ore in varying quantities from each deposit must be blended together.
Blending is undertaken at Koolyanobbing, where the crushing and screening plant is located. Standard and low grade products are produced in separate production runs. Once the blended ore has been crushed and screened into a direct shipping product, it is transported by rail approximately 400 miles south to the Port of Esperance for shipment to Asian customers.
8
Cockatoo Island is located off the Kimberley coast of Western Australia, approximately 1,200 miles north of Perth and is only accessible by sea and air. Cockatoo Island produces a single high iron product known as Cockatoo Island Premium Fines. The deposit is almost pure hematite and contains very few contaminants enabling the shipping grade to be above 68 percent iron. Ore is mined below the sea level on the southern edge of the island. This is facilitated by a sea wall which enables mining to a depth of 130 feet below sea level. Ore is crushed and screened to the final product sizing. Vessels berth at the island and the fines product is loaded directly to the ship. Cockatoo Island Premium Fines are highly sought in the global marketplace due to its extremely high iron grade and low valueless mineral content. Production at Cockatoo Island ended during 2008 due to construction on Phase 3 of the seawall, which is expected to extend production for approximately two additional years. In April 2009, an unanticipated subsidence of the seawall occurred. As a result, production from the mine has been delayed. Production is not expected to resume until the first half of 2011 once the seawall is completed.
Asia Pacific Iron Ore Customers
Asia Pacific Iron Ore’s production is under contract with steel companies in China and Japan through 2012. A limited spot market exists for seaborne iron ore as most production is sold under supply contracts with annual benchmark prices driven from negotiations between the major suppliers and Chinese, Japanese and other Asian steel mills.
Asia Pacific Iron Ore has five-year term supply agreements with steel producers in China and Japan that account for approximately 85 percent and 15 percent, respectively, of sales. The contracts were renegotiated for the period 2008 through 2012. Sales volume under the agreements is partially dependent on customer requirements. Each agreement is priced based on benchmark pricing established for Australian producers. In 2009, benchmark price negotiations in China did not result in a final settlement. As a result, we negotiated provisional pricing arrangements with certain customers in China consistent with agreed upon price declines reached between Asia Pacific steelmakers outside of China and producers in Australia.
During 2009, 2008 and 2007, we sold 8.5 million, 7.8 million and 8.1 million tonnes of iron ore, respectively, from our Western Australia mines. No customer comprised more than 10 percent of our consolidated sales in 2009, 2008 or 2007. Asia Pacific Iron Ore’s five largest customers accounted for approximately 39 percent of the segment’s sales in 2009, 44 percent in 2008 and 47 percent in 2007.
Investments
In addition to our reportable business segments, we are partner to a number of projects, including Amapá in Brazil and Sonoma in Australia, which comprise our Latin American Iron Ore and Asia Pacific Coal operating segments, respectively.
Amapá
We are a 30 percent minority interest owner in Amapá, which consists of an iron ore deposit, a 120-mile railway connecting the mine location to an existing port facility and 71 hectares of real estate on the banks of the Amazon River, reserved for a loading terminal. Amapá initiated production in late December 2007. The remaining 70 percent of Amapá is owned by Anglo.
The ramp-up of operations at the mine has been significantly slower than previously anticipated, with annual production totaling 2.7 million tonnes in 2009 compared with 1.2 million tonnes in 2008. As operator of the mine, Anglo has indicated that it expects Amapá will produce and sell 4.0 million tonnes of iron ore fines products in 2010 and 5.1 million tonnes annually once fully operational, which is expected to occur in 2012, based on current capital expenditure levels. The majority of Amapá’s production is committed under a long-term supply agreement with an operator of an iron oxide pelletizing plant in the Kingdom of Bahrain.
9
Sonoma
We own a 45 percent economic interest in Sonoma, located in Queensland, Australia. The project commenced operations in January 2008, with production and sales totaling approximately 2.8 million and 3.1 million tonnes, respectively, in 2009 compared with approximately 2.4 million and 2.1 million tonnes, respectively, in 2008. The project is expected to produce approximately 3.3 million tonnes in 2010 and between 2.5 to 3.2 million tonnes of coal annually in 2011 and beyond. Production will include an approximate 65/35 mix of thermal and metallurgical grade coal, which has been revised from a previously expected 50/50 mix. In 2009, Sonoma experienced intrusions in the coal seams which affected raw coal quality, recoverability in the washing process, and ultimately the quantity of metallurgical coal in the production mix. As a result, the geological model for Sonoma has been enhanced to reflect the presence of the intrusions and to refine the mining sequence in order to optimize the mix of metallurgical and thermal coal despite being lower than initially planned levels. Sonoma has economically recoverable reserves of 47 million tonnes. All 2009 production was committed under supply agreements with customers in Asia. Of the 3.3 million tonnes expected to be produced in 2010, approximately 3.0 million tonnes are committed under supply agreements as of December 31, 2009.
Research and Development
We have been a leader in iron ore mining technology for more than 160 years. We operated some of the first mines on Michigan’s Marquette Iron Range and pioneered early open-pit and underground mining methods. From the first application of electrical power in Michigan’s underground mines to the use of today’s sophisticated computers and global positioning satellite systems, we have been a leader in the application of new technology to the centuries-old business of mineral extraction. Today, our engineering and technical staffs are engaged in full-time technical support of our operations and improvement of existing products.
We are expanding our leadership position in the industry by focusing on high product quality, technical excellence, superior relationships with our customers and partners and improved operational efficiency through cost saving initiatives. We operate a fully-equipped research and development facility in Ishpeming, Michigan, which supports each of our global operations. Our research and development group is staffed with experienced engineers and scientists and is organized to support the geological interpretation, process mineralogy, mine engineering, mineral processing, pyrometallurgy, advanced process control and analytical service disciplines. Our research and development group is also utilized by iron ore pellet customers for laboratory testing and simulation of blast furnace conditions.
Exploration
Our exploration program is integral to our growth strategy. We have several projects and potential opportunities to diversify our products, expand our production volumes, extend our mine lives and develop large-scale ore bodies through early involvement in exploration and development activities. We achieve this by partnering with junior mining companies, which provide us low-cost entry points for potentially significant reserve additions. In 2009, we established a global exploration group, led by professional geologists who have the knowledge and experience to identify new world-class projects for future development or projects that add significant value to existing operations. We expect to spend between $25 million and $30 million on exploration and development activities in 2010, which will provide us with opportunities for significant future potential reserve additions globally.
Concentration of Customers
We have two customers which individually account for more than 10 percent of our consolidated product revenue in 2009. Total revenue from these customers represents approximately $0.8 billion, $1.6 billion, and $1.1 billion of our total consolidated product revenue in 2009, 2008 and 2007, respectively, and is attributable to our North American Iron Ore and North American Coal business segments. In 2008 and 2007, we had three and two customers, respectively, which individually accounted for more than 10 percent of our consolidated product revenue. The following represents sales revenue from each of these customers as a percentage of our total
10
consolidated product revenue as well as the portion of product sales for North American Iron Ore and North American Coal that is attributable to each of these customers in 2009, 2008 and 2007, respectively:
| Percentage of Total Product Revenue (1) |
Percentage of North American Iron Ore Product Revenue (1) |
Percentage of North American Coal Product Revenue (1) |
|||||||||||||||||||||||||
| Customer (2) |
2009 | 2008 | 2007 | 2009 | 2008 | 2007 | 2009 | 2008 | 2007 | ||||||||||||||||||
| ArcelorMittal |
28 | % | 27 | % | 34 | % | 42 | % | 39 | % | 44 | % | 28 | % | 23 | % | 37 | % | |||||||||
| Algoma |
10 | 11 | 12 | 17 | 17 | 16 | — | — | — | ||||||||||||||||||
| Severstal |
8 | 12 | 8 | 13 | 18 | 10 | 4 | 5 | — | ||||||||||||||||||
| Total |
46 | % | 50 | % | 54 | % | 72 | % | 74 | % | 70 | % | 32 | % | 28 | % | 37 | % | |||||||||
| (1) | Excluding freight and venture partners’ cost reimbursements. |
| (2) | Includes subsidiaries of each customer. |
ArcelorMittal USA
On March 19, 2007, we executed an umbrella agreement with ArcelorMittal USA, a subsidiary of ArcelorMittal, that covers significant price and volume matters under three separate pre-existing iron ore pellet supply agreements for ArcelorMittal USA’s Cleveland and Indiana Harbor West, Indiana Harbor East and Weirton facilities.
Under the umbrella agreement, ArcelorMittal USA is obligated to purchase specified minimum tonnages of iron ore pellets on an aggregate basis from 2006 through 2010. The umbrella agreement sets the minimum annual tonnage for ArcelorMittal USA through 2010, with pricing based on the facility to which the pellets are delivered. The terms of the umbrella agreement contain buy-down provisions, which permit ArcelorMittal USA to reduce its tonnage purchase obligation each year at a specified price per ton, as well as deferral provisions, which permit ArcelorMittal USA to defer a portion of its annual tonnage purchase obligation. In addition, ArcelorMittal is permitted to nominate tonnage for export out of the U.S. to any facility owned by ArcelorMittal. This ability to nominate tonnage for export will cease when the umbrella agreement expires at the end of 2010. For additional information regarding the pellet nominations, refer to Part 1 — Item 3, Legal Proceedings.
If at the end of the umbrella agreement term in 2010 a new agreement is not executed, our pellet supply agreements with ArcelorMittal USA that were in place prior to executing the umbrella agreement will again become the basis for supplying pellets to ArcelorMittal USA, which is based on customer requirements, except for the Indiana Harbor East facility.
| Facility |
Agreement Expiration | |
| Cleveland Works and Indiana Harbor West facilities |
2016 | |
| Indiana Harbor East facility |
2015 | |
| Weirton facility |
2018 |
ArcelorMittal USA is a 62.3 percent equity participant in Hibbing and a 21 percent equity partner in Empire with limited rights and obligations. ArcelorMittal USA was a 28.6 percent participant in Wabush Mines through its subsidiary ArcelorMittal Dofasco. As previously noted, on October 12, 2009, we exercised our right of first refusal to acquire the remaining interest in Wabush Mines, including ArcelorMittal Dofasco’s 28.6 percent interest. We subsequently completed the acquisition of Wabush on February 1, 2010.
In 2009, 2008 and 2007, our North American Iron Ore pellet sales to ArcelorMittal USA were 7.7 million, 9.9 million, and 10.3 million tons, respectively.
Our North American Coal supply agreements with ArcelorMittal are negotiated on an annual basis for the period April 1 through March 31 and are based on a tonnage commitment for the 12-month contract period. Contracts are priced on an annual basis, with pricing generally consistent with the Australian benchmark pricing for metallurgical coal. In 2009, 2008 and 2007, our North American Coal sales to ArcelorMittal were 0.6 million, 0.8 million and 0.5 million tons, respectively.
11
Algoma
Algoma is a Canadian steelmaker and a subsidiary of Essar Steel Holdings Limited. We have a 15-year term supply agreement under which we are Algoma’s sole supplier of iron ore pellets through 2016. Our annual obligation is limited to 4.0 million tons with our option to supply additional pellets. Pricing under the agreement with Algoma is based on a formula which includes international pellet prices. The agreement also provides that, in 2008, 2011 and 2014, either party may request a price re-opener if prices under the agreement with Algoma differ from a specified benchmark price. We sold 2.9 million, 4.1 million and 2.9 million tons to Algoma in 2009, 2008 and 2007, respectively.
Severstal
Under the agreement with Severstal, we must supply all of the customer’s blast furnace pellet requirements for its Dearborn, Michigan facility through 2022, subject to specified minimum and maximum requirements in certain years. The terms of the agreement also require supplemental payments to be paid by the customer during the period 2009 through 2013. Pursuant to an amended term sheet entered into on June 19, 2009, the customer exercised the option to defer a portion of the 2009 monthly supplemental payment up to $22.3 million in exchange for interest payments until the deferred amount is repaid in 2013.
On July 7, 2008, Severstal acquired WCI Steel Inc., located in Warren, Ohio, and as a result, assumed the supply agreement we had previously entered into with the former WCI to supply 100 percent of WCI’s annual requirements up to a maximum of 2.0 million tons of iron ore pellets through 2014.
On August 5, 2008, Severstal also acquired Esmark Incorporated (“Esmark”), and as a result, assumed the supply agreement we had previously entered into with Esmark’s subsidiary, Wheeling-Pittsburgh Steel Corporation. Under the terms of that agreement, we supply certain iron ore pellets through 2011, equal to 25 percent of Wheeling’s total annual iron ore pellet tonnage requirements for consumption in Wheeling’s iron and steel making facilities.
We sold 2.3 million, 4.6 million and 3.0 million tons to Severstal in 2009, 2008 and 2007, respectively.
Competition
Throughout the world, we compete with major and junior mining companies, as well as metals companies, both of which produce steelmaking raw materials, including iron ore and metallurgical coal.
North America
In our North American Iron Ore business segment, we sell our product primarily to steel producers with operations in North America. We compete directly with the Iron Ore Company of Canada as well as steel companies that own interests in iron ore mines, including ArcelorMittal Mines Canada and U.S. Steel.
In the coal industry, our North American Coal business segment competes with many metallurgical coal producers of various sizes, including Alpha Natural Resources, Inc., Patriot Coal Corporation, CONSOL Energy Inc., Arch Coal, Inc., Massey Energy Company, Jim Walter Resources, Inc., Peabody Energy Corp., United Coal Group Company and other producers located in North America and globally.
The North American coal industry remains highly fragmented and competitive, with CONSOL, Massey, Peabody, Alpha and Alliance Resource Partners representing the five largest producers. A number of factors beyond our control affect the markets in which we sell our coal. Continued demand for our coal and the prices obtained by us depend primarily on the coal consumption patterns of the steel industry in the United States and elsewhere around the world as well as the availability, location, cost of transportation and price of competing coal. Coal consumption patterns are affected primarily by demand, environmental and other governmental regulations, and technological developments. The most important factors on which we compete are delivered price, coal quality characteristics such as heat value, sulfur, ash and moisture content, and reliability of supply. Metallurgical coal, which is primarily used to make coke, a key component in the steelmaking process, generally sells at a premium over steam coal due to its higher quality and value in the steelmaking process.
12
Asia Pacific
In our Asia Pacific Iron Ore business segment we export iron ore products to China and Japan in the world seaborne trade. In the Asia Pacific marketplace, Cliffs competes with major iron ore exporters from Australia, Brazil and India. These include Anglo American, Vale, Rio Tinto, BHP Billiton and Fortescue Metals Group Ltd., among others.
The Sonoma Coal Project, in which Cliffs owns a 45 percent economic interest, competes with many other global metallurgical and thermal coal producers, including Anglo American, Rio Tinto, BHP Billiton, Macarthur Coal, Teck Cominco and Xstrata.
Competition in steelmaking raw materials is predicated upon the usual competitive factors of price, availability of supply, product performance, service and transportation cost to the consumer of the raw materials.
As the global steel industry continues to consolidate, a major focus of the consolidation is on the continued life of the integrated steel industry’s raw steelmaking operations, including blast furnaces and basic oxygen furnaces that produce raw steel. In addition, other competitive forces have become a large factor in the iron ore business. In particular, electric furnaces built by mini-mills, which are steel recyclers, generally produce steel by using scrap steel and reduced-iron products rather than iron ore pellets.
Environment
Our mining and exploration activities are subject to various laws and regulations governing the protection of the environment. We conduct our operations to protect the public health and environment and believe our operations are in compliance with applicable laws and regulations in all material respects.
Environmental issues and their management continued to be an important focus at each of our operations throughout 2009. In the construction of our facilities and in their operation, substantial costs have been incurred and will continue to be incurred to avoid undue effect on the environment. Our capital expenditures relating to environmental matters totaled $7.0 million, $7.3 million, and $8.8 million in 2009, 2008 and 2007, respectively. It is estimated that approximately $23 million will be spent in 2010 for capital environmental control facilities. Estimated expenditures in 2010 are primarily comprised of $8 million related to tailings basin improvements at Tilden, including replacement of a tailings line, $7 million related to various environmental projects at Wabush, including treatment of water effluents and installation of improved dust collector controls, and approximately $5 million for air emission improvements and tailings basin construction at United Taconite. There are no material environmental capital expenditures planned for 2010 related to North American Coal or our operations in Asia Pacific.
Regulatory Developments
Various governmental bodies are continually promulgating new laws and regulations affecting our company, our customers, and our suppliers in many areas, including waste discharge and disposal, hazardous classification of materials and products, air and water discharges, and many other environmental, health, and safety matters. Although we believe that our environmental policies and practices are sound and do not expect that the application of any current laws or regulations would reasonably be expected to result in a material adverse effect on our business or financial condition, we cannot predict the collective adverse impact of the expanding body of laws and regulations.
Specifically, there are several notable proposed or potential rulemakings or activities that could potentially have a material adverse impact on our facilities in the future depending on their ultimate outcome: Climate Change and Greenhouse Gas Regulation, the Clean Air Interstate Rule, Regional Haze, Increased Administrative and Legislative Initiatives related to Coal Mining Activities, Proposed Hardrock Mining Financial Assurance Rules, the Minnesota Mercury Total Maximum Daily Load Implementation and Selenium Discharge Regulation.
Climate Change and Greenhouse Gas Regulation. With the complexities and uncertainties associated with the U.S. and global navigation of the climate change issue as a whole, one of our significant risks for the future is forthcoming in the shape of mandatory carbon legislation. Policymakers are in the design process of carbon
13
regulation at the state, regional, national, and international levels. The current regulatory patchwork of carbon compliance schemes present a challenge for multi-facility entities to identify their near term risks. Amplifying the uncertainty, the dynamic forward outlook for carbon regulation presents a challenge to large industrial companies to assess the long-term net impacts of carbon compliance costs on their operations.
Internationally, mechanisms to reduce emissions are being implemented in various countries, with differing designs and stringency, according to resources, economic structure, and politics. We expect that momentum to extend carbon regulation following the expiration in 2012 of the first commitment period under the Kyoto Protocol will continue. Australia, Canada and Brazil are all signatories to the Kyoto Protocol. As such, our facilities in each of these countries will be impacted by the Kyoto Protocol, but in varying degrees according to the mechanisms each country establishes for compliance and each country’s commitment to reducing emissions. Australia and Canada are considered Annex 1 countries, meaning that they are obligated to reduce their emissions under the Protocol. In contrast, Brazil is not an Annex 1 country and is, therefore, not currently obligated to reduce its GHG emissions.
Australia has issued guidance outlining the components and rationale for its proposed carbon cap and trade pollution reduction scheme, as well as associated timing. However, our iron ore operations in Asia Pacific will not be required to purchase allowances due to the energy consumption levels being below the scheme threshold. The impact on our operations in Asia Pacific would only occur indirectly via costs that will be passed on by fuel suppliers; however, we do not anticipate such costs to have a material effect on our financial position or results of operations. In the fourth quarter of 2009, the Australian government introduced revised carbon pollution reduction scheme legislation to federal Parliament. However, the proposed legislation was defeated. It is currently unclear how the government will proceed on this issue.
Due to the current landscape of regulation in Australia, Canada and Brazil, and the relatively low emission levels in these countries, we face mild regulatory risk in the short term in Australia and Canada and a weak regulatory risk over the longer term in Brazil.
By contrast, in the U.S., federal carbon regulation potentially presents a significantly greater impact to our operations. To date, the U.S. has not implemented regulated carbon constraints. In the absence of comprehensive federal carbon regulation, numerous state and regional regulatory initiatives are under development or are becoming effective, thereby creating a disjointed approach to carbon control. These U.S. state level initiatives are indicative of the increasing support and need for U.S. federal carbon regulation. For us, the most significant regional initiative is the Midwest GHG Accord. We are well positioned to closely monitor the development of the Midwest GHG Accord through our seat on the Michigan Climate Task Committee.
While the exact form of the final U.S. federal regulatory scheme is uncertain, the House of Representatives passed carbon cap and trade legislation on June 26, 2009. In the Senate, the Environment and Public Works Committee approved a similar version of carbon legislation on November 5, 2009. Although this bill may receive further consideration, it remains in doubt whether the Senate will be able to pass a comprehensive climate bill in 2010. With the lack of a definitive outcome at the Copenhagen climate meetings, the future of U.S. climate change legislation is even more uncertain. Such legislation is still likely to incorporate compliance flexibility provisions, such as free allowances for energy intensive, trade sensitive industries, including iron ore, in an attempt to economically protect entities that are likely to be impacted with compliance costs, either directly or indirectly, as well as foster innovation and carbon-based energy project finance.
Furthermore, on September 22, 2009, the EPA issued a final rule requiring the mandatory reporting of GHG from a variety of covered emission sources in the U.S. Iron and coal mining facilities covered by the GHG reporting rule are required to report their annual GHG emissions. Sources covered by the rule are required to begin collecting emission data by no later than January 1, 2010, with the first annual emission report due to EPA on March 31, 2011.
As an energy-intensive business, our GHG emissions inventory captures a broad range of emissions sources, such as iron ore furnaces and kilns, coal thermal driers, diesel mining equipment and a wholly-owned power generation plant, among others. As such, our most significant regulatory risks are: (1) the costs associated with on-site emissions levels; and (2) the costs passed through to us from power generators and distillate fuel suppliers. In 2008, our overall emission source portfolio consisted of direct emissions of approximately
14
4.3 million tons of CO2e and indirect emissions of approximately 3.6 million tons of CO2e. This compares with direct emissions of approximately 3.4 million tons of CO2e and indirect emissions of approximately 3.5 million tons of CO2e in 2007. Our 2009 emissions have yet to be totaled. We believe our exposure can be substantially reduced by numerous factors including currently contemplated regulatory flexibility mechanisms, such as allowance allocations, fixed process emissions exemptions, offsets, and international provisions; emission reduction opportunities, including energy efficiency, biofuels, fuel flexibility, and methane reduction; and business opportunities associated with new products and technology, such as our investments in renewaFUEL.
We have proactively worked to develop a comprehensive, enterprise-wide GHG management strategy aimed at considering all significant aspects associated with GHG initiatives to effectively plan for and manage climate change issues, including the risks and opportunities as they relate to the environment, stakeholders, including shareholders and the public, legislative and regulatory developments, operations, products and markets. At this time, while we are unable to predict the potential impacts of any future mandatory governmental GHG legislative or regulatory requirements on our businesses, we have acted proactively in developing our comprehensive implementation plan that has best prepared us to mitigate the potential risks and take advantage of any potential opportunities.
Clean Air Interstate Rule. In 2005, the EPA issued CAIR to reduce or eliminate the impact of upwind sources on out-of-state downwind non-attainment of National Ambient Air Quality Standards (“NAAQS”) for fine particulate matter and for ozone. CAIR requires upwind states to revise their state implementation plans to include control measures to reduce emissions of nitrogen oxide and sulfur dioxide. As written, CAIR would apply to our Silver Bay Power plant, a cogeneration plant which produces both electricity and steam for internal Northshore ore processing operations and electricity for sale. However, in response to a D.C. Circuit Court of Appeals decision, the EPA must revise the written rule but has no definitive deadline for doing so. Despite redrafting of the rule, an additional final rule was promulgated and became effective December 3, 2009. This additional rule provides a temporary stay from the requirements of CAIR for facilities in the State of Minnesota, while the EPA assesses if Minnesota is one of the states to be covered in the revised rulemaking, including Silver Bay Power, pending further rulemaking in response to the U.S. Circuit Court of Appeals decision. It remains unknown whether Minnesota facilities will be subject to revised rulemaking, and whether the revised rulemaking requirements could have a material impact on Silver Bay Power. As such, at this time, we are unable to predict whether CAIR or its successor rulemaking will have a material adverse effect on Silver Bay Power.
Regional Haze. In June 2005, the EPA finalized amendments to its regional haze rules. The rules require states to establish goals and emission reduction strategies for improving visibility in all Class I national parks and wilderness areas. Among the states with Class I areas are Michigan, Minnesota, Alabama, and West Virginia where we currently own and manage mining operations. The first phase of the regional haze rule (2008-2018) requires analysis and installation of BART on eligible emission sources and incorporation of BART and associated emission limits into state implementation plans.
As of 2009, Regional Haze will likely have a significant impact only at our Silver Bay Power facility in Minnesota. The State of Michigan has deemed our Michigan operations exempt from BART. The Minnesota Pollution Control Board recently approved the MPCA’s BART state implementation plan. Specifically for us, this current plan is estimated to require between $8 million and $10 million in pollution control expenditure. The EPA must now review and formally approve the state implementation plan. If approved, these requirements will become effective five years after approval.
Increased Administrative and Legislative Initiatives Related to Coal Mining Activities. Although the focus of significantly increased government activity related to coal mining in the U.S. is generally targeted at eliminating or minimizing the adverse environmental impacts of mountaintop coal mining practices, these initiatives have the potential to impact all types of coal operations. Specifically, the coordinated efforts by various federal agencies to minimize adverse environmental consequences of mountaintop mining have effectively stopped issuance of new permits required by most mining projects in Appalachia. As our facilities do not employ any mountaintop coal mining removal practices, these initiatives have not caused any material impacts, delays or disruptions to our coal operations. However, due to the developing nature of these initiatives and their potential to disrupt even routine necessary mining and water permit practices in the coal industry, we are unable to predict whether these initiatives could have a material effect on our coal operations in the future.
15
CERCLA — Proposed Hardrock Mining Financial Assurance Rules. On July 13, 2009, the EPA provided notice that the hardrock mining industry will be its top priority for developing financial responsibility requirements for facilities that use hazardous substances. The purpose of these new requirements is to ensure that operators remain financially responsible for cleanup under CERCLA. The EPA expects to propose the new rules by the spring of 2011. The EPA’s July 13, 2009, announcement only provides notice to the hardrock mining industry that financial responsibility requirements are forthcoming; it does not give guidance on what those rules are expected to entail. We expect to comment extensively during the rule making process on the necessity and extent of these rules relative to iron ore operations. As such, we are unable to determine at this time whether these requirements will have a material impact on our operations.
Mercury TMDL and Minnesota Taconite Mercury Reduction Strategy. Mercury TMDL regulations are contained in the U.S. Federal Clean Water Act. As a part of Minnesota’s Mercury TMDL Implementation Plan, in cooperation with the MPCA, the taconite industry developed a Taconite Mercury Reduction Strategy and signed a voluntary agreement to effectuate its terms. The strategy includes a 75 percent reduction of mercury air emissions from pellet plants by 2025 as a target. It recognizes that mercury emission control technology currently does not exist and will be pursued through a research effort. Any developed technology must be economically feasible, must not impact pellet quality, and must not cause excessive corrosion in pellet furnaces, associated duct work and existing wet scrubbers on the furnaces.
According to the voluntary agreement, the mines must proceed with medium and long-term testing of possible technologies beginning in 2010. Initial testing will be completed on one straight-grate and one grate-kiln furnace among the mines. Developed mercury emission control technology must then be installed on all taconite furnaces by 2025. For us, the requirements in the voluntary agreement will apply to our United Taconite and Hibbing facilities. At this point in time, we are unable to predict the potential impacts of the Taconite Mercury Reduction Strategy, as it is just in its research phase with no proven technology yet identified.
Selenium Discharge Regulation. Pinnacle owns the closed West Virginia Maitland mine, which continues to discharge groundwater to Elkhorn Creek under terms of a NPDES permit issued by the West Virginia DEP. On April 30, 2008 the DEP renewed the permit and imposed more stringent effluent quality limitations for iron and aluminum. Current effluent iron concentrations sometimes exceed the new limitation. A permit appeal was filed with the West Virginia Environmental Quality Board regarding the reduced limitations and the absence of a compliance schedule in the permit. In 2009, the West Virginia DEP provided a compliance schedule for meeting the new limits. We believe Pinnacle will be able to achieve the new limits without any material costs or changes in operation.
In West Virginia, new selenium discharge limits will become effective April 6, 2010. Legislation has been passed in West Virginia that gives DEP the authority to extend the deadline for facilities to comply with new selenium discharge limits to July 1, 2012, based on application and approval of the extension. Pinnacle has applied for this extension and is awaiting a response from the DEP. While the impacts of this new limit are more associated with surface mining as opposed to Pinnacle’s underground facility, this requirement is likely to affect Pinnacle’s Smith Branch outfall, which has shown trace amounts of selenium in excess of the future limit. Pinnacle’s long term strategy is to eliminate the discharge and maintain a closed loop process that does not discharge. If the solution proves ineffective for reasons unknown at this time, Pinnacle may be required to implement alternative control measures.
Other Developments
For additional information on our environmental matters, refer to Item 3. Legal Proceedings and NOTE 11 — ENVIRONMENTAL AND MINE CLOSURE OBLIGATIONS in Item 8.
Energy
Electricity
WEPCO is the sole supplier of electric power to our Empire and Tilden mines. The current tariff rates applicable to Tilden and Empire became effective on January 1, 2009. On July 2, 2009, WEPCO filed a new rate case wherein WEPCO proposed an increase to these current tariff rates. On July 13, 2009, we filed a petition to intervene in the new rate case.
16
On September 30, 2009, WEPCO filed with the MPSC its power supply cost recovery (“PSCR”) plan case for calendar year 2010. As part of its application, WEPCO calculated its proposed 2010 PSCR costs and sought recovery of prior years’ power supply costs. On October 6, 2009, Tilden and Empire filed a petition to intervene in WEPCO’s 2010 PSCR plan case on the grounds that the rates, terms and conditions of service affected by the proceeding will directly and substantially impact them. We are currently reviewing the rate case and the PSCR and analyzing the potential impact on our Tilden and Empire mines. If WEPCO is successful in effectuating the 33 percent rate increase currently being proposed, our estimated energy costs at Tilden and Empire in 2010 may be unfavorably impacted by approximately $29 million.
Electric power for the Hibbing and United Taconite mines is supplied by MP. On September 16, 2008, the mines finalized seven-year agreements with a term from November 1, 2008 through December 31, 2015. The agreements were approved by the Minnesota Public Utilities Commission in 2009.
Silver Bay Power Company, a wholly-owned subsidiary of ours, with a 115 megawatt power plant, provides the majority of Northshore’s energy requirements. Silver Bay Power has an interconnection agreement with MP for backup power. Silver Bay Power entered into an agreement to sell 40 megawatts of excess power capacity to Xcel Energy under a contract that extends to 2011. In March 2008, Northshore reactivated one of its furnaces resulting in a shortage of electrical power of approximately 10 megawatts. As a result, supplemental electric power is purchased by Northshore from MP under an agreement that is renewable yearly with one-year termination notice required. The contract expires on June 30, 2011, which coincides with the expiration of Silver Bay Power’s 40 megawatt sales agreement with Xcel Energy.
Wabush has a 20-year agreement with Newfoundland Power, which continues until December 31, 2014. This agreement allows an interchange of water rights in return for the power needs for Wabush’s mining operations. The Wabush pelletizing operations in Quebec are served by Quebec Hydro on an annual contract.
The Oak Grove mine and Concord Preparation Plant are supplied electrical power by Alabama Power under a five-year contract which continues in effect until terminated by either party providing written notice to the other in accordance with applicable rules, regulations, and rate schedules. Rates of the contract are subject to change during the term of the contract as regulated by the Alabama Public Service Commission.
Electrical power to the Pinnacle, Green Ridge No. 1, Green Ridge No. 2 mines and the Pinnacle Preparation Plant are supplied by the Appalachian Power Company under two contracts. The Indian Creek contract was revised in 2008 to include service under Appalachian Power’s lower cost Large Capacity Power Primary Schedule and is renewable annually. The next renewal dates are July 24, 2010 for Indian Creek and July 4, 2010 for Pinnacle Creek. Both contracts specify the applicable rate schedule, minimum monthly charge and power capacity furnished. Rates, terms and conditions of the contracts are subject to the approval of the Public Service Commission of West Virginia. We are currently negotiating an amended agreement with Appalachian Power related to the Indian Creek contract that will result in Pinnacle taking increased amounts of power to accommodate expanding operations at the mine. This will also result in Pinnacle receiving significantly reduced tariff rates as a result of the increased amounts of power being utilized. The amendment is expected to be finalized during the first quarter of 2010. The Pinnacle Creek contract will not be affected.
Koolyanobbing and its associated satellite mines draw power from independent diesel fueled power stations and generators. Temporary diesel power generation capacity has been installed at the Koolyanobbing operations, allowing sufficient time for a detailed investigation into the viability of long-term options such as connecting into the Western Australian South West Interconnected System or provision of natural gas or dual fuel (natural gas and diesel) generating capacity. These options are not economic for the satellite mines, which will continue being powered by diesel generators.
Electrical supply on Cockatoo Island is diesel generated. The powerhouse adjacent to the processing plant powers the shiploader, fuel farm and the processing plant. The workshop and administration office is powered by a separate generator.
17
Process Fuel
We have contracts providing for the transport of natural gas for our North American iron ore and coal operations. At North American Iron Ore, the Empire and Tilden mines have the capability of burning natural gas, coal, or to a lesser extent, oil. The Hibbing and Northshore mines have the capability to burn natural gas and oil. The United Taconite mine has the ability to burn coal, natural gas and coke breeze. Although all of the U.S. iron ore mines have the capability of burning natural gas, the pelletizing operations for the U.S. iron ore mines utilize alternate fuels when practicable. Wabush has the capability to burn oil and coke breeze. Our North American Coal operations use natural gas and coal to fire thermal dryers at both the Pinnacle Complex and Oak Grove mine.
RenewaFUEL
We have an approximate 90 percent controlling interest in renewaFUEL. Founded in 2005, renewaFUEL produces high-quality, dense fuel cubes made from renewable and consistently available components such as corn stalks, switch grass, grains, soybean and oat hulls, wood, and wood byproducts. This is a strategic investment that provides an opportunity to utilize a “green” solution for further reduction of emissions consistent with our objective to contain costs and enhance efficiencies in a socially responsible manner. In addition to the potential use of renewaFUEL’s biofuel cubes in our production process, the cubes will be marketable to other organizations as a potential substitute for western coal and natural gas. In 2008, renewaFUEL announced it would build a next-generation biomass fuel production facility near Marquette, Michigan in addition to the current facility located in Battle Creek, Michigan. The Battle Creek facility has the capacity to produce approximately 60,000 tons of biofuel annually. The facility is currently operational, with production in 2009 of approximately 924 tons. In early 2009, renewaFUEL received a draft air permit from MDEQ for the Marquette plant, a significant milestone in the permitting process. Engineering and construction was initiated during 2009 with production projected to begin by the fourth quarter of 2010. The Marquette plant is expected to have the capacity to produce 150,000 tons of high-energy, low-emission biofuel annually.
Employees
As of December 31, 2009, we had a total of 5,404 employees.
| North American Iron Ore (1) |
North American Coal |
Asia Pacific Iron Ore |
Corporate & Support Services |
Total | ||||||
| Salaried |
774 | 198 | 151 | 300 | 1,423 | |||||
| Hourly |
3,181 | 799 | — | 1 | 3,981 | |||||
| Total |
3,955 | 997 | 151 | 301 | 5,404 | |||||
| (1) | Includes our employees and the employees of the North American joint ventures. |
As of December 31, 2009, 66 percent of our employees were covered by collective bargaining agreements.
Hourly employees at our Michigan and Minnesota iron ore mining operations, excluding Northshore, are represented by the USW. The four-year labor agreement, which was ratified by the USW on October 6, 2008, covers approximately 2,300 USW-represented workers at our Empire and Tilden mines in Michigan, and our United Taconite and Hibbing mines in Minnesota.
Hourly employees at Wabush are also represented by the USW. Wabush and the USW entered into a collective bargaining agreement in October 2004, which expired on March 1, 2009. On February 5, 2010, the USW ratified a new five-year labor agreement that provides for a 15 percent increase in labor costs over the term of the agreement, inclusive of benefits.
Hourly production and maintenance employees at our North American Coal mines are represented by the UMWA. We entered into collective bargaining agreements with the UMWA in March 2007 that expire on December 31, 2011. Those collective bargaining agreements are identical in all material respects to the NBCWA of 2007 between the UMWA and the Bituminous Coal Operators’ Association.
18
Employees at our Asia Pacific and Latin American operations are not represented under collective bargaining agreements.
Safety
Safety is one of our main priorities. Our North American Iron Ore segment had a total reportable incident rate, as defined by MSHA, of 2.53 in 2009, compared with the prior year result of 2.29. Although the total reportable injury trend was slightly unfavorable, other recognized safety measures showed marked improvements from 2008. Our North American Iron Ore segment finished the year with a 20 percent improvement in the all injury frequency rate from 2008. Our North American Coal operations had a total reportable incident rate of 5.25 compared with a rate of 8.76 in 2008 and recorded a 30 percent improvement in injury severity rates from the prior year. We have developed close collaboration between our North American segments to drive further improvements in our safety results.
At our Asia Pacific Iron Ore operations, Koolyanobbing’s total reportable incident rate for 2009 was 2.52, compared with the 2008 result of 2.57. Cockatoo Island reported a total reportable incident rate of 0.79 in 2009 compared with 5.94 in 2008. Asia Pacific Iron Ore safety statistics include employees and contractors.
Available Information
Our headquarters are located at 200 Public Square, Cleveland, Ohio 44114-2315, and our telephone number is (216) 694-5700. We are subject to the reporting requirements of the Exchange Act and its rules and regulations. The Exchange Act requires us to file reports, proxy statements and other information with the SEC. Copies of these reports and other information can be read and copied at:
SEC Public Reference Room
100 F Street N.E.
Washington, D.C. 20549
Information on the operation of the Public Reference Room may be obtained by calling the SEC at 1-800-SEC-0330.
The SEC maintains a website that contains reports, proxy statements and other information regarding issuers that file electronically with the SEC. These materials may be obtained electronically by accessing the SEC’s home page at www.sec.gov.
We make available, free of charge on our website, our Annual Report on Form 10-K, Quarterly Reports on Form 10-Q, Current Reports on Form 8-K and amendments to these reports filed or furnished pursuant to Section 13(a) or 15(d) of the Exchange Act, as soon as reasonably practicable after we electronically file these documents with, or furnish them to, the SEC. These documents are posted on our website at www.cliffsnaturalresources.com — under “Investors”.
We also make available, free of charge on our website, the charters of the Audit Committee, Board Affairs Committee, Compensation and Organization Committee and Strategy Committee as well as the Corporate Governance Guidelines and the Code of Business Conduct & Ethics adopted by our Board of Directors. These documents are posted on our website at www.cliffsnaturalresources.com — under “Investors”, select the “Corporate Governance” link.
References to our website do not constitute incorporation by reference of the information contained on our website, and such information is not part of this Form 10-K.
Copies of the above referenced information will also be made available, free of charge, by calling (216) 694-5700 or upon written request to:
Cliffs Natural Resources Inc.
Investor Relations
200 Public Square
Cleveland, OH 44114-2315
19
EXECUTIVE OFFICERS OF THE REGISTRANT
Set forth below are: (1) the names and ages of all executive and certain other officers of the Company at February 18, 2010, (2) all positions with the Company presently held by each such person and (3) the positions held by, and principal areas of responsibility of, each such person during the last five years.
| Name |
Position(s) Held |
Age | ||
| Joseph A. Carrabba |
Chairman, President and Chief Executive Officer | 57 | ||
| Laurie Brlas |
Executive Vice President — Chief Financial Officer | 52 | ||
| Donald J. Gallagher |
President, North American Business Unit | 57 | ||
| William A. Brake, Jr. |
Executive Vice President — Human and Technical Resources | 49 | ||
| William R. Calfee |
Executive Vice President — Commercial, North American Iron Ore | 63 | ||
| William C. Boor |
Senior Vice President — Business Development | 43 | ||
| Richard R. Mehan |
Senior Vice President, President and Chief Executive Officer — Cliffs Asia Pacific | 56 | ||
| Duncan Price |
Senior Vice President — Managing Director of Asia Pacific Iron Ore | 54 | ||
| Duke D. Vetor |
Senior Vice President — North American Coal | 51 | ||
| George W. Hawk, Jr. |
General Counsel and Secretary | 53 | ||
| Terrance M. Paradie |
Vice President — Corporate Controller and Chief Accounting Officer | 41 |
There is no family relationship between any of our executive officers, or between any of our executive officers and any of our directors. Officers are elected to serve until successors have been elected. All of the above named officers were elected effective on the dates listed below for each such officer.
Joseph A. Carrabba has been Chairman, President and Chief Executive Officer of Cliffs since May 8, 2007. Mr. Carrabba served as Cliffs’ President and Chief Executive Officer from September 2006 through May 8, 2007 and as Cliffs’ President and Chief Operating Officer from May 2005 to September 2006. Mr. Carrabba previously served as President and Chief Operating Officer of Diavik Diamond Mines, Inc. from April 2003 to May 2005, a subsidiary of Rio Tinto plc., an international mining group. Mr. Carrabba is a Director of KeyCorp and Newmont Mining Corporation.
Laurie Brlas has served as Executive Vice President — Chief Financial Officer of Cliffs since March 2008. Ms. Brlas served as Cliffs’ Senior Vice President — Chief Financial Officer from October 2007 through March 2008. From December 2006 to October 2007, Ms. Brlas served as Senior Vice President — Chief Financial Officer and Treasurer of Cliffs. From April 2000 to December 2006, Ms. Brlas was Senior Vice President — Chief Financial Officer of STERIS Corporation. In addition, Ms. Brlas is a Director of Perrigo Company.
Donald J. Gallagher has served as President, North American Business Unit of Cliffs since November 2007. From December 2006 to November 2007, Mr. Gallagher served as President, North American Iron Ore. From July 2006 to December 2006, Mr. Gallagher served as President, North American Iron Ore, and Acting Chief Financial Officer and Treasurer of Cliffs. From May 2005 to July 2006, Mr. Gallagher was Executive Vice President, Chief Financial Officer and Treasurer of Cliffs. From July 2003 to May 2005, Mr. Gallagher served as Senior Vice President, Chief Financial Officer and Treasurer of Cliffs.
William A. Brake, Jr. has served as Executive Vice President, Human and Technical Resources of Cliffs since November 2008, when Mr. Brake assumed responsibility for human resources and labor relations in addition to his previous responsibilities. From April 2007 until November 2008, Mr. Brake served as Executive Vice President, Cliffs Metallics and Chief Technical Officer. From January 2006 to August 2006, Mr. Brake was Executive Vice President — Operations of Mittal Steel USA and from March 2005 to January 2006, he served as Executive Vice President — Operations East at Mittal Steel USA. From March 2003 to March 2005, Mr. Brake was Vice President and General Manager of International Steel Group.
William R. Calfee has served as Executive Vice President — Commercial, North American Iron Ore of Cliffs since July 2006. From 1996 to July 2006, Mr. Calfee served as Executive Vice President — Commercial of Cliffs.
20
William C. Boor has served as Senior Vice President, Business Development of Cliffs since May 2007. Mr. Boor served as Executive Vice President — Strategy and Development at American Gypsum Co. (a subsidiary of Eagle Materials Inc.) from February 2005 to April 2007 and Senior Vice President — Corporate Development and Investor Relations at Eagle Materials Inc. from May 2002 to February 2005. Mr. Boor is a Director of Cavco Industries, Inc. and has served as Chairman of its Audit Committee since 2009.
Richard R. Mehan has served as Senior Vice President, President and Chief Executive Officer — Cliffs Asia Pacific since January 2007 in addition to serving as Managing Director of Cliffs Asia Pacific Iron Ore Holdings Pty Ltd (formerly known as Portman Limited), which Mr. Mehan has served since 2005. Prior to that, between 1998 and 2005, Mr. Mehan held the roles of General Manager — Iron Ore, General Manager — Marketing and Chief Operating Officer.
Duncan Price has served as Senior Vice President — Managing Director of Asia Pacific Iron Ore since March 2009. Mr. Price served as Chief Executive Officer, Portman Limited from 2007 to 2009. Prior to joining Cliffs, Mr. Price served as Project Director at Sinosteel/Midwest Joint Venture from 2006 to 2007 and Managing Director at Rio Tinto Group from 1996 to 2006.
Duke D. Vetor has served as Senior Vice President, North American Coal of Cliffs since November 2007. From July 2006 to November 2007, Mr. Vetor served as Vice President — Operations — North American Iron Ore of Cliffs. Mr. Vetor was General Manager of Safety and Operations Improvement of Cliffs from December 2005 to July 2006. From 2003 to November 2005, Mr. Vetor served as Vice President — Operations of Diavik Diamond Mines.
George W. Hawk, Jr. has served as General Counsel and Secretary of Cliffs since January 2005. Prior to that, Mr. Hawk served as Assistant General Counsel and Secretary of Cliffs from August 2003 to December 2004.
Terrance M. Paradie has served as Vice President — Corporate Controller and Chief Accounting Officer of Cliffs since July 2009 when Mr. Paradie was appointed to the additional position of Chief Accounting Officer in addition to his previous responsibilities. Mr. Paradie served as Cliffs’ Vice President — Corporate Controller from October 2007 through July 2009. Prior to joining Cliffs, Mr. Paradie served international accounting and consulting firm KPMG LLP since 1992 in a variety of roles, most recently as an audit partner.
The global economic crisis created uncertainty and could continue to adversely affect our business.
The global economic crisis adversely affected our business and impacted our financial results. All of our customers announced curtailments of production, which adversely affected the demand for our iron ore and coal products in 2009. A continuation or worsening of current economic conditions, a prolonged global, national or regional economic recession or other events that could produce major changes in demand patterns, could have a material adverse effect on our sales, margins and profitability. We are not able to predict whether the global economic crisis will continue or worsen and the impact it may have on our operations and the industry in general going forward.
The global economic crisis resulted in downward pressure on prices for iron ore and metallurgical coal.
The global economic crisis resulted in a great deal of pressure from customers, particularly in China, for a roll back of the 2008 price increases for seaborne iron ore and metallurgical coal in 2009. The 2008 record price increase was driven by high demand for iron ore and coking coal, historically high levels of global steel production, and tight supply conditions for iron ore and coking coal due to production and logistics constraints. None of these conditions existed in early 2009 during the global economic crisis, and the market was characterized by a collapse in steel demand and limited global demand for iron ore and coking coal. Reduced demand for iron ore and coking coal resulted in decreased demand for our products and decreasing prices, resulting in lower revenue levels in 2009, and decreasing margins as a result of decreased production, and adversely affecting our results of operations, financial condition and liquidity. Although the global economic outlook has improved in 2010, with the demand for steel and steel-making products improving, another economic
21
downturn is a possibility, and if such a downturn were to occur during 2010, we would likely see decreased demand for our products and decreasing prices, resulting in lower revenue levels and decreasing margins in 2010.
Negative economic conditions may adversely impact the ability of our customers to meet their obligations to us on a timely basis or at all.
Although we have contractual commitments for sales in our North American Iron Ore business for 2010 and beyond, the recent decline in the economy, as well as any further decline, may adversely impact the ability of our customers to meet their obligations to us on a timely basis or at all. In light of the current economic environment, we are in continual discussions with our customers regarding our supply agreements. These discussions may result in the modification of our supply agreements. Any modifications to our supply agreements could adversely impact our sales, margins, profitability and cash flows. These discussions or actions by our customers could also result in contractual disputes, which could ultimately require arbitration or litigation, either of which could be time consuming and costly. Any such disputes could adversely impact our sales, margins, profitability and cash flows.
Coal mining is complex due to geological characteristics of the region.
The geological characteristics of coal reserves, such as depth of overburden and coal seam thickness, make them complex and costly to mine. As mines become depleted, replacement reserves may not be available when required or, if available, may not be capable of being mined at costs comparable to those characteristic of the depleting mines, and in turn, decisions to defer mine development activities may adversely impact our ability to substantially increase future coal production. These factors could materially adversely affect our mining operations and cost structures, which could adversely affect our sales, profitability and cash flows.
Anti-takeover provisions could make it more difficult for a third party to acquire us.
Our rights plan may make it more difficult for a third party to acquire us in a transaction. Additionally, Ohio corporate law provides that certain notice and informational filings and special shareholder meeting and voting procedures must be followed prior to consummation of a proposed “control share acquisition” as defined in the Ohio Revised Code. Assuming compliance with the prescribed notice and information filings, a proposed control share acquisition may be made only if, at a special meeting of shareholders, the acquisition is approved by both a majority of our voting power represented at the meeting and a majority of the voting power remaining after excluding the combined voting of the “interested shares,” as defined in the Ohio Revised Code. Our rights plans and the application of these provisions of the Ohio Revised Code could have the effect of delaying or preventing a change of control.
Capacity expansions within the industry could lead to lower global iron ore and coal prices or impact our production.
The increased demand for iron ore and coal, particularly from China, has resulted in the major iron ore and metallurgical coal suppliers announcing plans to increase their capacity. In the current economic environment, any increase in our competitors’ capacity could result in excess supply of iron ore and coal, resulting in increased downward pressure on prices. A decrease in pricing would adversely impact our sales, margins and profitability.
If steelmakers use methods other than blast furnace production to produce steel, or if their blast furnaces shut down or otherwise reduce production, the demand for our iron ore and coal products may decrease.
Demand for our iron ore and coal products is determined by the operating rates for the blast furnaces of steel companies. However, not all finished steel is produced by blast furnaces; finished steel also may be produced by other methods that do not require iron ore products. For example, steel “mini-mills,” which are steel recyclers, generally produce steel primarily by using scrap steel and other iron products, not iron ore pellets, in their electric furnaces. Production of steel by steel mini-mills was approximately 60 percent of North American total finished steel production in 2009. North American steel producers also can produce steel using imported iron ore or semi- finished steel products, which eliminates the need for domestic iron ore. Environmental restrictions on the use of blast furnaces also may reduce our customers’ use of their blast furnaces. Maintenance of blast furnaces can require substantial capital expenditures. Our customers may choose not to maintain their blast furnaces, and some
22
of our customers may not have the resources necessary to adequately maintain their blast furnaces. If our customers use methods to produce steel that do not use iron ore and coal products, demand for our iron ore and coal products will decrease, which could adversely affect our sales, margins and profitability.
A substantial majority of our sales are made under term supply agreements to a limited number of customers, which are important to the stability and profitability of our operations.
In 2009, virtually all of our North American Iron Ore sales volume, the majority of our North American Coal sales, and virtually all of our Asia Pacific Iron Ore sales were sold under term supply agreements to a limited number of customers. Five customers together accounted for approximately 80 percent of our North American iron ore and coal sales revenues (representing more than 50 percent of our overall revenues). For North American Coal, these agreements typically cover a twelve-month period and are typically renewed each year. The Asia Pacific Iron Ore contracts expire in 2012. Our North American Iron Ore contracts have an average remaining duration of 5.5 years. We cannot be certain that we will be able to renew or replace existing term supply agreements at the same volume levels, prices or with similar profit margins when they expire. A loss of sales to our existing customers could have a substantial negative impact on our sales, margins and profitability.
Our North American Iron Ore term supply agreements contain a number of price adjustment provisions, or price escalators, including adjustments based on general industrial inflation rates, the price of steel and the international price of iron ore pellets, among other factors, that allow us to adjust the prices under those agreements generally on an annual basis. Our price adjustment provisions are weighted and some are subject to annual collars, which limit our ability to raise prices to match international levels and fully capitalize on strong demand for iron ore. Most of our North American Iron Ore term supply agreements do not otherwise allow us to increase our prices and to directly pass through higher production costs to our customers. An inability to increase prices or pass along increased costs could adversely affect our margins and profitability.
The availability of capital for exploration, acquisitions and mine development may be limited.
We expect to grow our business and presence as an international mining company by continuing to expand both geographically and through the minerals that we mine and market. To execute on this strategy we will need to have access to the capital markets to finance exploration, acquisitions and development of mining properties. During the global economic crisis access to capital to finance new projects and acquisitions is extremely limited. If we are unable to access the capital markets, our ability to execute on our growth strategy will be negatively impacted.
Our ability to collect payments from our customers depends on their creditworthiness.
Our ability to receive payment for products sold and delivered to our customers depends on the creditworthiness of our customers. With respect to our North American Coal and Asia Pacific Iron Ore business units, payment is typically received as the products are shipped. However, in our North American Iron Ore business unit, generally, we deliver iron ore products to our customers’ facilities in advance of payment for those products. Although title and risk of loss with respect to those products does not pass to the customer until payment for the pellets is received, there is typically a period of time in which pellets, for which we have reserved title, are within our customers’ control. Consolidations in some of the industries in which our customers operate have created larger customers, some of which are highly leveraged. These factors have caused some customers to be less profitable and increased our exposure to credit risk. Current credit markets are highly volatile, and some of our customers are highly leveraged. A significant adverse change in the financial and/or credit position of a customer could require us to assume greater credit risk relating to that customer and could limit our ability to collect receivables. Failure to receive payment from our customers for products that we have delivered could adversely affect our results of operations, financial condition and liquidity.
Mine closures entail substantial costs, and if we close one or more of our mines sooner than anticipated, our results of operations and financial condition may be significantly and adversely affected.
If we close any of our mines, our revenues would be reduced unless we were able to increase production at our other mines, which may not be possible. The closure of a mining operation involves significant fixed closure
23
costs, including accelerated employment legacy costs, severance-related obligations, reclamation and other environmental costs, and the costs of terminating long-term obligations, including energy contracts and equipment leases. We base our assumptions regarding the life of our mines on detailed studies we perform from time to time, but those studies and assumptions are subject to uncertainties and estimates that may not be accurate. We recognize the costs of reclaiming open pits and shafts, stockpiles, tailings ponds, roads and other mining support areas based on the estimated mining life of our property. If we were to significantly reduce the estimated life of any of our mines, the mine-closure costs would be applied to a shorter period of production, which would increase production costs per ton produced and could significantly and adversely affect our results of operations and financial condition.
A North American mine permanent closure could significantly increase and accelerate employment legacy costs, including our expense and funding costs for pension and other postretirement benefit obligations. A number of employees would be eligible for immediate retirement under special eligibility rules that apply upon a mine closure. All employees eligible for immediate retirement under the pension plans at the time of the permanent mine closure also would be eligible for postretirement health and life insurance benefits, thereby accelerating our obligation to provide these benefits. Certain mine closures would precipitate a pension closure liability significantly greater than an ongoing operation liability. Finally, a permanent mine closure could trigger severance-related obligations, which can equal up to eight weeks of pay per employee, depending on length of service. No employee entitled to an immediate pension upon closure of a mine is entitled to severance. As a result, the closure of one or more of our mines could adversely affect our financial condition and results of operations.
We rely on estimates of our recoverable reserves, which is complex due to geological characteristics of the properties and the number of assumptions made.
We regularly evaluate our North American iron ore and coal reserves based on revenues and costs and update them as required in accordance with SEC Industry Guide 7. Asia Pacific Iron Ore and Sonoma have published reserves which follow JORC in Australia, which is similar to United States requirements. Changes to the reserve value to make them comply with SEC requirements have been made. There are numerous uncertainties inherent in estimating quantities of reserves of our mines, including many factors beyond our control.
Estimates of reserves and future net cash flows necessarily depend upon a number of variable factors and assumptions, such as production capacity, effects of regulations by governmental agencies, future prices for iron ore and coal, future industry conditions and operating costs, severance and excise taxes, development costs and costs of extraction and reclamation, all of which may in fact vary considerably from actual results. For these reasons, estimates of the economically recoverable quantities of mineralized deposits attributable to any particular group of properties, classifications of such reserves based on risk of recovery and estimates of future net cash flows prepared by different engineers or by the same engineers at different times may vary substantially as the criteria change. Estimated ore and coal reserves could be affected by future industry conditions, geological conditions and ongoing mine planning. Actual production, revenues and expenditures with respect to our reserves will likely vary from estimates, and if such variances are material, our sales and profitability could be adversely affected.
We rely on our joint venture partners in our mines to meet their payment obligations and are subject to risks involving the acts or omissions of our joint venture partners when we are not the manager of the joint venture.
We co-own and manage three of our six North American iron ore mines with various joint venture partners that are integrated steel producers or their subsidiaries, including ArcelorMittal USA and U.S. Steel Canada Inc. We also own minority interests in mines located in Brazil and Australia that we do not manage. We rely on our joint venture partners to make their required capital contributions and to pay for their share of the iron ore pellets that each joint venture produces. Our North American venture partners are also our customers. If one or more of our venture partners fail to perform their obligations, the remaining venturers, including ourselves, may be required to assume additional material obligations, including significant pension and postretirement health and
24
life insurance benefit obligations. The premature closure of a mine due to the failure of a joint venture partner to perform its obligations could result in significant fixed mine-closure costs, including severance, employment legacy costs and other employment costs, reclamation and other environmental costs, and the costs of terminating long-term obligations, including energy contracts and equipment leases.
We cannot control the actions of our joint venture partners, especially when we have a minority interest in a joint venture and are not designated as the manager of the joint venture. Further, in spite of performing customary due diligence prior to entering into a joint venture, we cannot guarantee full disclosure of prior acts or omissions of the sellers or those with whom we enter into joint ventures. Such risks could have a material adverse effect on the business, results of operations or financial condition of our joint venture interests.
Our expenditures for postretirement benefit and pension obligations could be materially higher than we have predicted if our underlying assumptions prove to be incorrect, if there are mine closures or our joint venture partners fail to perform their obligations that relate to employee pension plans.
We provide defined benefit pension plans and OPEB to eligible union and non-union employees in North America, including our share of expense and funding obligations with respect to unconsolidated ventures. Our pension expense and our required contributions to our pension plans are directly affected by the value of plan assets, the projected and actual rate of return on plan assets and the actuarial assumptions we use to measure our defined benefit pension plan obligations, including the rate at which future obligations are discounted.
We cannot predict whether changing market or economic conditions such as the current economic crisis, regulatory changes or other factors will increase our pension expenses or our funding obligations, diverting funds we would otherwise apply to other uses.
We have calculated our unfunded pension and OPEB obligations based on a number of assumptions. If our assumptions do not materialize as expected, cash expenditures and costs that we incur could be materially higher. Moreover, we cannot be certain that regulatory changes will not increase our obligations to provide these or additional benefits. These obligations also may increase substantially in the event of adverse medical cost trends or unexpected rates of early retirement, particularly for bargaining unit retirees for whom there is currently no retiree healthcare cost cap. Early retirement rates likely would increase substantially in the event of a mine closure.
Our sales and competitive position depend on the ability to transport our products to our customers at competitive rates and in a timely manner.
In our North American operations, disruption of the lake freighter and rail transportation services because of weather-related problems, including ice and winter weather conditions on the Great Lakes, strikes, lock-outs or other events, could impair our ability to supply iron ore pellets to our customers at competitive rates or in a timely manner and, thus, could adversely affect our sales and profitability. Similarly, our North American coal operations depend on international freighter and rail transportation services, as well as the availability of dock capacity, and any disruptions to such could impair our ability to supply coal to our customers at competitive rates or in a timely manner and, thus, could adversely affect our sales and profitability. Further, reduced levels of government funding may result in a lesser level of dredging, particularly at Great Lakes ports. Less dredging results in lower water levels, which restricts the tonnage freighters can haul over the Great Lakes, resulting in higher freight rates.
Our Asia Pacific iron ore and coal operations are also dependent upon rail and port capacity. Disruptions in rail service or availability of dock capacity could similarly impair our ability to supply iron ore and coal to our customers, thereby adversely affecting our sales and profitability. In addition, our Asia Pacific iron ore operations are also in direct competition with the major world seaborne exporters of iron ore and our customers face higher transportation costs than most other Australian producers to ship our products to the Asian markets because of the location of our major shipping port on the south coast of Australia. Further, increases in transportation costs, decreased availability of ocean vessels or changes in such costs relative to transportation costs incurred by our competitors, could make our products less competitive, restrict our access to certain markets and have an adverse effect on our sales, margins and profitability.
25
Our operating expenses could increase significantly if the price of electrical power, fuel or other energy sources increases.
Operating expenses at all of our mining locations are sensitive to changes in electricity prices and fuel prices, including diesel fuel and natural gas prices. In our North American Iron Ore locations, for example, these items make up approximately 20 percent of our North American Iron Ore operating costs. Prices for electricity, natural gas and fuel oils can fluctuate widely with availability and demand levels from other users. During periods of peak usage, supplies of energy may be curtailed and we may not be able to purchase them at historical rates. While we have some long-term contracts with electrical suppliers, we are exposed to fluctuations in energy costs that can affect our production costs. As an example, WEPCO has filed a rate case with the Michigan Public Utilities Commission requesting a 33 percent increase in rates from its rate payers, including our Empire and Tilden mines. We enter into forward fixed-price supply contracts for natural gas and diesel fuel for use in our operations. Those contracts are of limited duration and do not cover all of our fuel needs, and price increases in fuel costs could cause our profitability to decrease significantly.
Natural disasters, weather conditions, disruption of energy, unanticipated geological conditions, equipment failures, and other unexpected events may lead our customers, our suppliers, or our facilities to curtail production or shut down their operations.
Operating levels within the industry are subject to unexpected conditions and events that are beyond the industry’s control. Those events could cause industry members or their suppliers to curtail production or shut down a portion or all of their operations, which could reduce the demand for our iron ore and coal products, and could adversely affect our sales, margins, and profitability.
Interruptions in production capabilities will inevitably increase our production costs and reduce our profitability. We do not have meaningful excess capacity for current production needs, and we are not able to quickly increase production at one mine to offset an interruption in production at another mine.
A portion of our production costs are fixed regardless of current operating levels. As noted, our operating levels are subject to conditions beyond our control that can delay deliveries or increase the cost of mining at particular mines for varying lengths of time. These conditions include weather conditions (for example, extreme winter weather, floods and availability of process water due to drought) and natural disasters, pit wall failures, unanticipated geological conditions, including variations in the amount of rock and soil overlying the deposits of iron ore and coal, variations in rock and other natural materials and variations in geologic conditions and ore processing changes.
The manufacturing processes that take place in our mining operations, as well as in our processing facilities, depend on critical pieces of equipment. This equipment may, on occasion, be out of service because of unanticipated failures. In addition, many of our mines and processing facilities have been in operation for several decades, and the equipment is aged. In the future, we may experience additional material plant shutdowns or periods of reduced production because of equipment failures. Further, remediation of any interruption in production capability may require us to make large capital expenditures that could have a negative effect on our profitability and cash flows. Our business interruption insurance would not cover all of the lost revenues associated with equipment failures. Longer-term business disruptions could result in a loss of customers, which could adversely affect our future sales levels, and therefore our profitability.
Regarding the impact of unexpected events happening to our suppliers, many of our mines are dependent on one source for electric power and for natural gas. A significant interruption in service from our energy suppliers due to terrorism, weather conditions, natural disasters, or any other cause can result in substantial losses that may not be fully recoverable, either from our business interruption insurance or responsible third parties.
We are subject to extensive governmental regulation, which imposes, and will continue to impose, significant costs and liabilities on us, and future regulation could increase those costs and liabilities or limit our ability to produce iron ore and coal products.
We are subject to various federal, provincial, state and local laws and regulations in each jurisdiction in which we have operations on matters such as employee health and safety, air quality, water pollution, plant and
26
wildlife protection, reclamation and restoration of mining properties, the discharge of materials into the environment, and the effects that mining has on groundwater quality and availability. Numerous governmental permits and approvals are required for our operations. We cannot be certain that we have been or will be at all times in complete compliance with such laws, regulations and permits. If we violate or fail to comply with these laws, regulations or permits, we could be fined or otherwise sanctioned by regulators.
Prior to commencement of mining, we must submit to and obtain approval from the appropriate regulatory authority of plans showing where and how mining and reclamation operations are to occur. These plans must include information such as the location of mining areas, stockpiles, surface waters, haul roads, tailings basins and drainage from mining operations. All requirements imposed by any such authority may be costly and time-consuming and may delay commencement or continuation of exploration or production operations. In addition, new legislation and regulations and orders, including proposals related to climate change and protection of the environment, to which we would be subject or that would further regulate and tax our customers, namely the North American integrated steel producer customers, may also require us or our customers to reduce or otherwise change operations significantly or incur additional costs. Such new legislation, regulations or orders, if enacted, could have a material adverse effect on our business, results of operations, financial condition or profitability.
Further, we are subject to a variety of potential liability exposures arising at certain sites where we do not currently conduct operations. These sites include sites where we formerly conducted iron ore mining or processing or other operations, inactive sites that we currently own, predecessor sites, acquired sites, leased land sites and third-party waste disposal sites. We may be named as a responsible party at other sites in the future and we cannot be certain that the costs associated with these additional sites will not be material.
We also could be held liable for any and all consequences arising out of human exposure to hazardous substances used, released or disposed of by us or other environmental damage, including damage to natural resources. In particular, we and certain of our subsidiaries are involved in various claims relating to the exposure of asbestos and silica to seamen who sailed on the Great Lakes vessels formerly owned and operated by certain of our subsidiaries. The full impact of these claims, as well as whether insurance coverage will be sufficient and whether other defendants named in these claims will be able to fund any costs arising out of these claims, continues to be unknown.
Our North American coal operations are subject to increasing levels of regulatory oversight, making it more difficult to obtain and maintain necessary operating permits.
The current political and regulatory environment in the U.S. is negatively disposed toward coal mining, with particular focus on certain categories of mining such as mountaintop removal techniques. Although we do not engage in mountaintop removal coal mining, our coal mining operations in North America are subject to increasing levels of scrutiny. Although the focus of significantly increased government activity related to coal mining in the U.S. is generally targeted at eliminating or minimizing the adverse environmental impacts of mountaintop coal mining practices, these initiatives have the potential to impact all types of coal operation since various regulatory agencies have effectively stopped the issuance of new permits required by most coal mining projects. These regulatory initiatives could cause material impacts, delays or disruptions to our coal operations due to our inability to obtain new permits or modifications or amendments to existing permits.
Underground mining is subject to increased safety regulation and may require us to incur additional cost.
Recent mine disasters have led to the enactment and consideration of significant new federal and state laws and regulations relating to safety in underground coal mines. These laws and regulations include requirements for constructing and maintaining caches for the storage of additional self-contained self rescuers throughout underground mines; installing rescue chambers in underground mines; constant tracking of and communication with personnel in the mines; installing cable lifelines from the mine portal to all sections of the mine to assist in emergency escape; submission and approval of emergency response plans; and new and additional safety training. Additionally, new requirements for the prompt reporting of accidents and increased fines and penalties for violations of these and existing regulations have been implemented. These new laws and regulations may cause us to incur substantial additional costs, which may adversely impact our operating performance.
27
Our profitability could be negatively affected if we fail to maintain satisfactory labor relations.
The USW represents all hourly employees at our North American Iron Ore locations except for Northshore. The UMWA represents hourly employees at our North American Coal locations. On October 6, 2008, we entered into a four-year labor agreement with the USW that covers approximately 2,300 USW-represented workers at our Empire and Tilden mines in Michigan, and our United Taconite and Hibbing mines in Minnesota. The five-year agreement covering our Canadian workforce expired on March 1, 2009. In February 2010, we entered into a new five-year labor agreement with the USW for our Wabush mine. The agreement provides for a 15 percent increase in labor costs over the term of the agreement, inclusive of benefits. The current UMWA agreement runs through 2011 at our coal locations. Hourly employees at the railroads we own that transport products among our facilities are represented by multiple unions with labor agreements that expire at various dates. If the collective bargaining agreements relating to the employees at our mines or railroads are not successfully renegotiated prior to their expiration, we could face work stoppages or labor strikes.
We may encounter labor shortages for critical operational positions, which could affect our ability to produce our products.
Prior to the global economic crisis, the global mining industry was facing a critical shortage of essential skilled employees. Competition for the available workers was limiting our ability to attract and retain employees prior to the global economic crisis.
Despite the current economic downturn, we are predicting a long term shortage of skilled workers for the mining industry. At our mining locations, many of our mining operational employees are approaching retirement age. As these experienced employees retire, we may have difficulty replacing them at competitive wages. As a result, wages are increasing to address the turnover. In addition, when the global economy recovers, we will again be under increasing pressure to retain our existing skilled workers, which could result in higher wages.
Our profitability could be affected by the failure of outside contractors to perform.
Asia Pacific Iron Ore and Sonoma use contractors to handle many of the operational phases of their mining and processing operations and therefore are subject to the performance of outside companies on key production areas.
We may be unable to successfully identify, acquire and integrate strategic acquisition candidates.
Our ability to grow successfully through acquisitions depends upon our ability to identify, negotiate, complete and integrate suitable acquisitions and to obtain necessary financing. It is possible that we will be unable to successfully complete potential acquisitions. In addition, the costs of acquiring other businesses could increase if competition for acquisition candidates increases. Additionally, the success of an acquisition is subject to other risks and uncertainties, including our ability to realize operating efficiencies expected from an acquisition, the size or quality of the resource, delays in realizing the benefits of an acquisition, difficulties in retaining key employees, customers or suppliers of the acquired businesses, difficulties in maintaining uniform controls, procedures, standards and policies throughout acquired companies, the risks associated with the assumption of contingent or undisclosed liabilities of acquisition targets, the impact of changes to our allocation of purchase price, and the ability to generate future cash flows or the availability of financing.
We must continually replace reserves depleted by production. Our exploration activities may not result in additional discoveries.
Our ability to replenish our ore reserves is important to our long-term viability. Depleted ore reserves must be replaced by further delineation of existing ore bodies or by locating new deposits in order to maintain production levels over the long term. Resource exploration and development are highly speculative in nature. Our exploration projects involve many risks, require substantial expenditures and may not result in the discovery of sufficient additional mineral deposits that can be mined profitably. Once a site with mineralization is discovered, it may take several years from the initial phases of drilling until production is possible, during which time the economic feasibility of production may change. Substantial expenditures are required to establish recoverable
28
proven and probable reserves and to construct mining and processing facilities. As a result, there is no assurance that current or future exploration programs will be successful. There is a risk that depletion of reserves will not be offset by discoveries or acquisitions.
We are subject to risks involving operations in multiple countries.
We have a strategy to broaden our scope as a supplier of iron ore and other raw materials to the global integrated steel industry. As we expand beyond our traditional North American base business, we will be subject to additional risks beyond those risks relating to our North American operations, such as currency fluctuations; legal and tax limitations on our ability to repatriate earnings in a tax-efficient manner; potential negative international impacts resulting from U.S. foreign and domestic policies, including government embargoes or foreign trade restrictions; the imposition of duties, tariffs, import and export controls and other trade barriers impacting the seaborne iron ore and coal markets; difficulties in staffing and managing multi-national operations; and uncertainties in the enforcement of legal rights and remedies in multiple jurisdictions. If we are unable to manage successfully the risks associated with expanding our global business, these risks could have a material adverse effect on our business, results of operations or financial condition.
We are subject to a variety of market risks.
Market risks include those caused by changes in the value of equity investments, changes in commodity prices, interest rates and foreign currency exchange rates. We have established policies and procedures to manage such risks, however certain risks are beyond our control.
Item 1B. Unresolved Staff Comments.
There are no comments that remain unresolved that we received more than 180 days before the end of our fiscal year to which this report relates. On September 29, 2009 and December 24, 2009, we received comments from the SEC on our Form 10-K for the fiscal year ended December 31, 2008 and our Form 10-Q for the fiscal quarters ended March 31, 2009, June 30, 2009, and September 30, 2009 which we responded to on October 16, 2009 and January 26, 2010, respectively. We have not received any further comments on our responses as of the date of this filing.
The following map shows the locations of our operations:
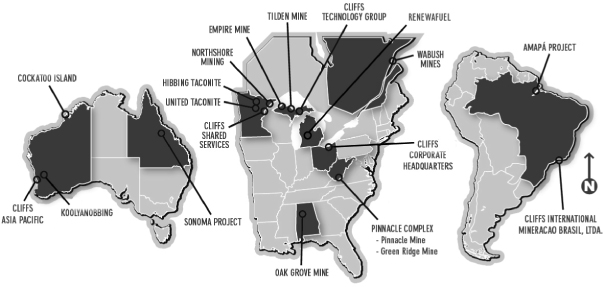
29
General Information about the Mines
Mining Rights and Leases. Mining is conducted on multiple mineral leases having varying expiration dates. Mining leases are routinely renegotiated and renewed as they approach their respective expiration dates.
Geological Composition. All iron ore mining operations are open-pit mines that are in production. Additional pit development is underway at each mine as required by long-range mine plans. At our North American Iron Ore mines, drilling programs are conducted periodically for the purpose of refining guidance related to ongoing operations.
The Biwabik, Negaunee, and Wabush Iron Formations are classified as Lake Superior type iron-formations that formed under similar sedimentary conditions in shallow marine basins approximately two billion years ago. Magnetite and hematite are the predominant iron oxide ore minerals present, with lesser amounts of goethite and limonite. Chert is the predominant waste mineral present, with lesser amounts of silicate and carbonate minerals. The ore minerals liberate from the waste minerals upon fine grinding.
All North American Coal mine operations are underground mines that are in production. Drilling programs are conducted periodically for the purpose of refining guidance related to ongoing operations. The Pocahontas No. 3 and Blue Creek Coal Seams are Pennsylvanian Age low ash, high quality coals.
At Koolyanobbing, an exploration program began in 2008 targeting extensions to the iron ore resource base, and regional exploration targets in the Yilgarn Mineral Field were active in 2009. At Cockatoo Island, feasibility studies have been completed for a below-sea-level eastward mine pit extension. The Stage 3 extension was reviewed by the regulators and approved in August 2008. Production at Cockatoo Island ended during 2008 due to construction on Phase 3 of the seawall, which is expected to extend production for approximately two additional years. In April 2009, an unanticipated subsidence of the seawall occurred. As a result, production from the mine has been delayed. Production is not expected to resume until the first half of 2011 once the seawall is completed.
The mineralization at the Koolyanobbing operations is predominantly hematite and goethite replacements in greenstone-hosted banded iron-formations. Individual deposits tend to be small with complex ore-waste contact relationships. The Koolyanobbing operations reserves are derived from 13 separate mineral deposits distributed over a 60-mile operating radius. The mineralization at Cockatoo Island is predominantly soft, hematite-rich sandstone that produces premium high grade, low impurity direct shipping fines.
Mineralized material at the Amapá mine is predominantly hematite occurring in weathered and leached greenstone-hosted banded iron-formation of the Archean Vila Nova Group. Variable degrees of leaching generate soft hematite mineralization suitable for either sinter feed production via crushing and gravity separation or pelletizing feed production via grinding and flotation.
In Australia, the Sonoma mine operation is an open-pit mine located in the northern section of Queensland’s Bowen Basin. A mix of high quality metallurgical coal and thermal coal is recovered from the B and C seams of the Permian Mooranbah Coal Measures.
Geologic models are developed for all mines to define the major ore and waste rock types. Computerized block models are then constructed that include all relevant geologic and metallurgical data. These are used to generate grade and tonnage estimates, followed by detailed mine design and life of mine operating schedules.
30
Mine Facilities and Equipment. Each of the North American Iron Ore mines has crushing, concentrating, and pelletizing facilities. There are crushing and screening facilities at Koolyanobbing and Cockatoo Island. North American Coal mines have preparation, processing, and load-out facilities, with the Pinnacle and Green Ridge mines sharing facilities. The facilities at each site are in satisfactory condition, although they require routine capital and maintenance expenditures on an ongoing basis. Certain mine equipment generally is powered by electricity, diesel fuel or gasoline. Our share of the total cost of the property, plant and equipment, net of applicable accumulated amortization and depreciation as of December 31, 2009, for each of the mines is set forth in the chart below.
| (In Millions) | |||
| Mine Location |
Historical Cost of Mine Plant and Equipment, Net of Applicable Accumulated Amortization and Depreciation (Cliffs’ Share) | ||
| Empire |
$ | 44.2 | |
| Tilden |
168.0 | ||
| Hibbing |
37.0 | ||
| Northshore |
114.2 | ||
| United Taconite |
73.1 | ||
| Wabush |
11.9 | ||
| Pinnacle |
510.8 | ||
| Oak Grove |
227.6 | ||
| Sonoma |
128.3 | ||
| Cockatoo Island |
9.9 | ||
| Koolyanobbing |
777.1 | ||
| Amapá |
172.5 | ||
North American Iron Ore
We directly or indirectly own and operate interests in the following six North American iron ore mines from which we produced 17.1 million, 22.9 million and 21.8 million long tons of iron ore pellets in 2009, 2008 and 2007, respectively, for our account and 2.5 million, 12.3 million and 12.8 million long tons, respectively, on behalf of the steel company partners of the mines:
Empire mine
The Empire mine is located on the Marquette Iron Range in Michigan’s Upper Peninsula approximately 15 miles west-southwest of Marquette, Michigan. The mine has been in operation since 1963. Over the past five years, the Empire mine has produced between 2.6 million and 4.9 million tons of iron ore pellets annually.
We own 79.0 percent of Empire, and a subsidiary of ArcelorMittal USA has retained the remaining 21 percent ownership in Empire with limited rights and obligations, which it has a unilateral right to put to us at any time subsequent to the end of 2007. This right has not been exercised. We own directly approximately one-half of the remaining ore reserves at the Empire mine and lease them to Empire. A subsidiary of ours leases the balance of the Empire reserves from other owners of such reserves and subleases them to Empire.
Tilden mine
The Tilden mine is located on the Marquette Iron Range in Michigan’s Upper Peninsula approximately five miles south of Ishpeming, Michigan. The Tilden mine has been in operation since 1974. Over the past five years, the Tilden mine has produced between 5.6 million and 7.9 million tons of iron ore pellets annually.
We own 85 percent of Tilden, with the remaining minority interest owned by U.S. Steel Canada. Each partner takes its share of production pro rata; however, provisions in the partnership agreement allow additional or reduced production to be delivered under certain circumstances. We own all of the ore reserves at the Tilden mine and lease them to Tilden.
31
The Empire and Tilden mines are located adjacent to each other. The logistical benefits include a consolidated transportation system, more efficient employee and equipment operating schedules, reduction in redundant facilities and workforce and best practices sharing. Two railroads, one of which is wholly-owned by us, link the Empire and Tilden mines with Lake Michigan at the loading port of Escanaba, Michigan and with the Lake Superior loading port of Marquette, Michigan.
Hibbing mine
The Hibbing mine is located in the center of Minnesota’s Mesabi Iron Range and is approximately ten miles north of Hibbing, Minnesota and five miles west of Chisholm, Minnesota. From the Mesabi Range, Hibbing pellets are transported by rail to a shiploading port at Superior, Wisconsin. The Hibbing mine has been in operation since 1976. Over the past five years, the Hibbing mine has produced between 1.7 million and 8.5 million tons of iron ore pellets annually. As a result of market conditions, Hibbing was shut down in May 2009 and is not expected to resume production until the second quarter of 2010.
We own 23.0 percent of Hibbing, ArcelorMittal USA has a 62.3 percent interest, and U.S. Steel Canada has a 14.7 percent interest. Each partner takes its share of production pro rata; however, provisions in the joint venture agreement allow additional or reduced production to be delivered under certain circumstances.
Northshore mine
The Northshore mine is located in northeastern Minnesota, approximately two miles south of Babbitt, Minnesota on the northeastern end of the Mesabi Iron Range. Northshore’s processing facilities are located in Silver Bay, Minnesota, near Lake Superior. Crude ore is shipped by a wholly-owned railroad from the mine to the processing and dock facilities at Silver Bay. The Northshore mine has been in continuous operation since 1990. Over the past five years, the Northshore mine has produced between 3.2 million and 5.5 million tons of iron ore pellets annually.
The Northshore mine began production under our management and ownership on October 1, 1994. We own 100 percent of the mine.
United Taconite mine
The United Taconite mine is located on Minnesota’s Mesabi Iron Range in and around the city of Eveleth, Minnesota. The United Taconite concentrator and pelletizing facilities are located ten miles south of the mine, near the town of Forbes, Minnesota. United Taconite pellets are shipped by railroad to the port of Duluth, Minnesota. The mine has been operating since 1965. Over the past five years, the United Taconite mine has produced between 3.8 million and 5.3 million tons of iron ore pellets annually.
In 2008, we completed the acquisition of the remaining 30 percent interest in United Taconite.
Wabush mine
The Wabush mine and concentrator are located in Wabush, Labrador, Newfoundland, and the pellet plant and dock facility is located in Pointe Noire, Quebec, Canada. At the Wabush mine, concentrates are shipped by rail from the Scully mine at Wabush to Pointe Noire where they are pelletized for shipment via vessel within Canada, to the United States and other international destinations. Additionally, concentrates may be shipped directly from Pointe Noire for sinter feed. The Wabush mine has been in operation since 1965. Over the past five years, the Wabush mine has produced between 2.7 million and 4.9 million tons of iron ore pellets annually. As of December 31, 2009, we owned 26.8 percent of Wabush. However, on October 12, 2009, we exercised our right of first refusal to acquire the remaining interest in Wabush, including U.S. Steel Canada’s 44.6 percent interest and ArcelorMittal Dofasco’s 28.6 percent interest. Ownership transfer to Cliffs was completed on February 1, 2010.
32
North American Coal
We directly own and operate the following two North American coal mining complexes from which we produced a total of 1.7 million, 3.5 million and 1.1 million short tons of coal in North America in 2009, 2008 and 2007, respectively, representing our volume since the acquisition of PinnOak on July 31, 2007:
Pinnacle Complex
The Pinnacle Complex includes the Pinnacle and Green Ridge mines and is located approximately 30 miles southwest of Beckley, West Virginia. The Pinnacle mine has been in operation since 1969. Over the past five years, the Pinnacle mine has produced between 0.7 million and 2.5 million tons of coal annually. The Green Ridge mines have been in operation since 2004 and have produced between 0.2 million and 0.5 million tons of coal annually. One of the Green Ridge mines will be closed permanently beginning in February 2010 due to exhaustion of the economic reserves at the mine.
Oak Grove mine
The Oak Grove mine is located approximately 25 miles southwest of Birmingham, Alabama. The mine has been in operation since 1972. Over the past five years, the Oak Grove mine has produced between 0.9 million and 1.7 million tons of coal annually.
Our coal production at each mine is shipped within the U.S. by rail or barge. Coal for international customers is shipped through the port of Mobile, Alabama or Newport News, Virginia.
Asia Pacific Iron Ore
In Australia, we own and operate interests in the following two Asia Pacific iron ore mines from which we produced 8.3 million tonnes, 7.7 million tonnes and 8.4 million tonnes in 2009, 2008 and 2007, respectively:
Koolyanobbing
The Koolyanobbing operations are located 250 miles east of Perth and approximately 30 miles northeast of the town of Southern Cross. Koolyanobbing produces lump and fines iron ore. An expansion program was completed in 2006 to increase capacity from six to eight million tonnes per annum. The expansion was primarily driven by the development of iron ore resources at Mount Jackson and Windarling, located 50 miles and 60 miles north of the existing Koolyanobbing operations, respectively. Over the past five years, the Koolyanobbing operation has produced between 5.8 million and 8.3 million tonnes annually.
All of the ore mined at the Koolyanobbing operations is transported by rail to the Port of Esperance, 350 miles to the south for shipment to Asian customers. In 2009, Asia Pacific Iron Ore completed an upgrade of the rail line used for its operations. The upgrade was performed to mitigate the risk of derailment and reduce service disruptions by providing a more robust infrastructure. The improvements included the replacement of 75 miles of rail and associated parts. We spent a total of approximately $45 million in 2009 and 2008 related to maintenance and improvements to the rail structure.
Cockatoo Island
The Cockatoo Island operation is located four miles to the west of Yampi Peninsula, in the Buccaneer Archipelago, and 90 miles north of Derby in the West Kimberley region of Western Australia. The island has been mined for iron ore since 1951, with a break in operations between 1985 and 1993. During the past five years, Cockatoo Island has ranged from no production to 1.4 million tonnes annually. No ore was mined in 2009 due to subsidence of the seawall and no production is expected in 2010.
We own a 50 percent interest in this joint venture to mine remnant iron ore deposits. Mining from this phase of the operation commenced in late 2000. Production at Cockatoo Island ended during 2008 due to construction on Phase 3 of the seawall, which is expected to extend production for approximately two additional years. In April 2009, an unanticipated subsidence of the seawall occurred. As a result, production from the mine has been
33
delayed. Production is not expected to resume until the first half of 2011 once the seawall is completed. Ore is hauled by haul truck to the stockpiles, crushed and screened and then transferred by conveyor to the shiploader. Direct ship premium fines mined at Cockatoo Island are then loaded at a local dock.
Mine Capacity and Mineral Reserves
We have a corporate policy relating to internal control and procedures with respect to auditing and estimating mineral reserves. The procedures include the calculation of mineral reserves at each mine by professional mining engineers and geologists. Management compiles and reviews the calculations, and once finalized, such information is used to prepare the disclosures for our annual and quarterly reports. The disclosures are reviewed and approved by management, including our Chief Financial Officer and Chief Executive Officer. Additionally, the long-range mine planning and mineral reserve estimates are reviewed annually by our Audit Committee. Furthermore, all changes to mineral reserve estimates, other than those due to production, are adequately documented and submitted to our President and Chief Executive Officer for review and approval. Finally, we perform periodic reviews of long-range mine plans and mineral reserve estimates at mine staff meetings and senior management meetings.
Reserves are defined by SEC Industry Standard Guide 7 as that part of a mineral deposit that could be economically and legally extracted and produced at the time of the reserve determination. All reserves are classified as proven or probable and are supported by life-of-mine plans.
Iron Ore Reserves
Ore reserve estimates for our iron ore mines as of December 31, 2009 were estimated from fully-designed open pits developed using three-dimensional modeling techniques. These fully designed pits incorporate design slopes, practical mining shapes and access ramps to assure the accuracy of our reserve estimates. The iron ore prices utilized for reserve estimation are derived from 3-year trailing averages of regional benchmark pricing. For North American Iron Ore operations, prices are based on iron ore pellets delivered to the Lower Great Lakes, and for operations in Asia Pacific, iron ore prices represent the 3-year trailing average of international benchmark pricing for the products generated by our Asia Pacific Iron Ore business unit (sinter fines, lump ore). We evaluate and analyze iron ore reserve estimates every three years in accordance with our mineral reserve policy or earlier if conditions merit. For the fiscal year ended December 31, 2009, iron ore prices vary based on the date of the last reserve analysis. The table below identifies the reserve analysis date and the respective 3-year trailing price for each of our iron ore mines as of December 31, 2009.
| Mine |
Date of Base Economic Ore Reserve Analysis |
Commodity Pricing (1) | |||
| North America |
|||||
| Empire |
2009 | (2) | $89.19 | ||
| Hibbing Taconite |
2008 | $90.42 | |||
| Northshore |
2009 | (2) | $90.42 | ||
| Tilden |
2008 | $89.19 | |||
| United Taconite |
2007 | $85.76 | |||
| Wabush |
2008 | $85.16 | |||
| Asia Pacific |
|||||
| Koolyanobbing |
2009 | Lump - $1.1692 | |||
| Fines - $0.9071 | |||||
| Cockatoo Island |
2008 | Fines - $0.6847 |
| (1) | Pricing in North America reflects US$ per long tons of pellets FOB port, except for Empire and Tilden, which are FOB mine. Pricing in Asia Pacific reflects US$ per product dry metric ton iron unit. |
| (2) | The decision was made to exclude anomolous 2008 Benchmark Pricing from the 3-year trailing average price used in determining our North American Iron Ore reserve estimates. Therefore, the 3-year trailing average for the 2009 reserve analysis reflects 2005-2007 prices. |
34
The following tables reflect expected current annual capacity and economic ore reserves for our North American and Asia Pacific iron ore mines as of December 31, 2009. Ore reserves for Amapá, in which we have a 30 percent ownership interest, have not been estimated by Cliffs. The ore reserve estimation process is controlled and managed by Anglo as the parent company and mine operator. Sufficient technical data on the processing of Amapá mineralized material does not exist at this time, precluding estimation of recoverable product and grade, and therefore economic reserves as defined by SEC Industry Guide 7. However, Anglo has indicated that exploration drilling to date has resulted in a currently declared resource size of 207 million tonnes based on measured, indicated and inferred resources.
North American Iron Ore
| Mine |
Iron Ore Mineralization |
Current Annual Capacity |
Mineral Reserves (2) | Mineral Rights | Method of Reserve Estimation |
Operating Since |
Infrastructure | |||||||||||||||||
| Current Year | Previous Year |
|||||||||||||||||||||||
| Proven | Probable | Total | Owned | Leased | ||||||||||||||||||||
| Tons in millions (1) | ||||||||||||||||||||||||
| Empire |
Negaunee Iron Formation (Magnetite) |
5.5 | 12.6 | — | 12.6 | 33 | 53 | % | 47 | % | Geologic - Block Model | 1963 | Mine, Concentrator, Pelletizer | |||||||||||
| Tilden |
Negaunee Iron Formation (Hematite, Magnetite) | 8.0 | 214 | 60 | 274 | 280 | 100 | % | 0 | % | Geologic - Block Model | 1974 | Mine, Concentrator, Pelletizer, Railroad | |||||||||||
| Hibbing Taconite |
Biwabik Iron Formation (Magnetite) | 8.0 | 103 | 10 | 113 | 114 | 3 | % | 97 | % | Geologic - Block Model | 1976 | Mine, Concentrator, Pelletizer | |||||||||||
| Northshore |
Biwabik Iron Formation (Magnetite) | 5.7 | 304 | 16 | 320 | 308 | 0 | % | 100 | % | Geologic - Block Model | 1989 | Mine, Concentrator, Pelletizer, Railroad | |||||||||||
| United Taconite |
Biwabik Iron Formation (Magnetite) |
5.4 | 124 | 16 | 140 | 144 | 0 | % | 100 | % | Geologic - Block Model |
1965 | Mine, Concentrator, Pelletizer | |||||||||||
| Wabush |
Sokoman Iron Formation (Hematite) | 5.5 | 72.3 | — | 72.3 | 75 | 0 | % | 100 | % | Geologic - Block Model | 1965 | Mine, Concentrator, Pelletizer, Railroad | |||||||||||
| Total |
38.1 | 830 | 102 | 932 | 954 | |||||||||||||||||||
| (1) | Tons are long tons of 2,240 pounds. |
| (2) | Estimated standard equivalent pellets, including both proven and probable reserves based on life of mine operating schedules. |
In 2009, there were no changes in reserve estimates at Tilden, Hibbing Taconite, United Taconite, or Wabush except for production.
New economic reserve analyses were performed at Empire and Northshore in 2009. Each of the new reserve analyses incorporate updates to both iron ore pellet pricing and operating costs. Changes in the reserve estimates are as follows:
| • | Empire – Pellet reserves are decreased by 18 million tons net of 2009 production. The reserves have decreased due to the postponement of a multi-year development project that can not be economically justified in the present market conditions. |
| • | Northshore – Pellet reserves are increased by 16 million tons net of 2009 production. The increased reserves are the result of improved mine pit designs. |
35
Asia Pacific Iron Ore
| Mine |
Iron Ore Mineralization |
Current Annual Capacity |
Mineral Reserves (2) | Mineral Rights | Method of Reserve Estimation |
Operating Since |
Infrastructure | |||||||||||||||||
| Current Year | Previous Year |
|||||||||||||||||||||||
| Proven | Probable | Total | Owned | Leased | ||||||||||||||||||||
| Tonnes in millions (1) | ||||||||||||||||||||||||
| Koolyanobbing (3) |
Banded Iron Formations Southern Cross Terrane Yilgarn Mineral Field (Hematite, Goethite) |
8.5 | 3.5 | 81.7 | 85.2 | 90.5 | 0 | % | 100 | % | Geologic - Block Model |
1994 | Mine, Road Train Haulage, Crushing- Screening Plant | |||||||||||
| Cockatoo Island JV (4) |
Sandstone Yampi Formation Kimberley Mineral Field (Hematite) |
1.2 | — | 2.3 | 2.3 | 2.3 | 0 | % | 100 | % | Geologic - Block Model |
1994 | Mine, Crushing- Screening Plant, Shiploader | |||||||||||
| Total | 9.7 | 3.5 | 84.0 | 87.5 | 92.8 | |||||||||||||||||||
| (1) | Metric tons of 2,205 pounds. |
| (2) | Reported ore reserves restricted to proven and probable tonnages based on life of mine operating schedules. 3.5 million tonnes of the Koolyanobbing reserves are sourced from current stockpiles. |
| (3) | Rail and plant upgrades in 2009 increase the annual capacity to 8.5 million tonnes. |
| (4) | Asia Pacific Iron Ore has a 50% interest in the Cockatoo Island joint venture. Reserves reported at 100% and represent the Stage 3 Seawall extension project area. |
Net of 2009 production, Koolyanobbing ore reserves have increased by 3 million tonnes. The increase is from the addition of newly discovered resources and mine planning optimization.
During 2009, construction of a Stage 3 extension of the seawall embankment continued at Cockatoo Island, which will provide access to an additional 2.3 million tonnes of premium high grade iron ore fines for the joint venture. However, production from the mine has been delayed due to subsidence of the seawall in April 2009. Production is not expected to resume until the first half of 2011 once the seawall is completed. This extension is expected to extend production for approximately two years.
Coal Reserves
North American Coal
Coal reserve estimates for our North American underground coal mines as of December 31, 2009 were estimated using three-dimensional modeling techniques, coupled with mine plan designs. A complete re-estimation of the moist, recoverable coal reserves was completed subsequent to the 2007 acquisition and was updated most recently in 2009. Coal pricing for the North American Coal reserve estimate in 2009 was $85 per ton FOB mine based upon a 3-year trailing average.
The following table reflects expected current annual capacities and economically recoverable reserves for our North American coal mines as of December 31, 2009.
| Mine (2) |
Category (3) | Current Annual Capacity |
Proven and Probable Reserves | Mineral Rights | Method of Reserve Estimation |
Infrastructure | ||||||||||||
| In-place | Moist Recoverable | Owned | Leased | |||||||||||||||
| Tons in Millions(1) | ||||||||||||||||||
| Pinnacle Complex |
4.0 | 0 | % | 100 | % | Geologic - | Mine, Preparation | |||||||||||
| Pocahontas No 3 |
Assigned | 114.4 | 53.4 | Block Model | Plant, Load-out | |||||||||||||
| Pocahontas No 4 |
Unassigned | 26.8 | 9.8 | |||||||||||||||
| Oak Grove |
2.5 | 0 | % | 100 | % | Geologic - | Mine, Preparation | |||||||||||
| Blue Creek Seam |
Assigned | 81.3 | 43.0 | Block Model | Plant, Load-out | |||||||||||||
| Total |
6.5 | 222.5 | 106.2 | |||||||||||||||
36
| (1) | Short tons of 2,000 pounds. |
| (2) | All coal extracted by underground mining using longwall and continuous miner equipment. |
| (3) | Assigned reserves represent coal reserves that can be mined without a significant capital expenditure for mine development, whereas unassigned reserves will require significant capital expenditures to mine the reserves. |
The North American recoverable coal reserves have decreased 12 million tons net of 2009 production. The decrease is mainly attributed to lower mine face to product yield reconciliations compared to the previous estimate.
All recoverable coal reserves at our North American operations are high quality, low volatile, metallurgical grade coal. The following table presents the coal quality at our North American coal mines.
| Mine |
Coal Type | Moist Recoverable Reserves (1) Proven & Probable |
Sulfur Content % |
As Received Btu/lb | ||||
| Pinnacle Complex |
||||||||
| Pocahontas No 3 |
Metallurgical | 53.4 | 0.77 | 14,870 | ||||
| Pocahontas No 4 |
Metallurgical | 9.8 | 0.58 | 14,000 | ||||
| Oak Grove |
||||||||
| Blue Creek Seam |
Metallurgical | 43.0 | 0.57 | 14,000 | ||||
| Total |
106.2 | |||||||
| (1) | In millions of short tons of 2,000 pounds. |
Asia Pacific Coal
The coal reserve estimate for our Asia Pacific coal mine as of December 31, 2009 is based on a JORC-compliant resource estimate. An optimized pit design for an initial 10-year mine operating schedule was generated supporting the reserve estimate. Coal pricing for the reserve estimate is based upon international benchmark pricing for our Sonoma joint venture at the time of investment in 2007, which was $71 per tonne FOB port for the range of products generated at Sonoma.
The following table reflects expected current annual capacity and economically recoverable reserves for Sonoma:
| Mine (2) |
Category (3) | Current Annual Capacity |
Proven and Probable | Mineral Rights | Method of Reserve Estimation |
Infrastructure | ||||||||||||
| In-place | Moist Recoverable | Owned | Leased | |||||||||||||||
| Tonnes in Millions (1) | ||||||||||||||||||
| Sonoma |
||||||||||||||||||
| Moranbah Coal Measures B, C and E Seams |
Assigned | 4.0 | 38.5 | 21.6 | 0 | % | 100 | % | Geologic - Block Model |
Mine, Preparation, Plant, Load-out | ||||||||
| (1) | Metric tons of 2,205 pounds. In-place coal at 8 percent moisture, recoverable clean coal at 9 percent moisture. Reserves listed on 100 percent basis. Cliffs Natural Resources has an effective 45 percent interest in the joint venture. |
| (2) | All coal is extracted by conventional surface mining techniques. |
| (3) | Assigned reserves represent coal reserves that can be mined without a significant capital expenditure for mine development, whereas unassigned reserves will require significant capital expenditures to mine the reserves. |
An update to the Sonoma resource model and economic reserve estimate is scheduled for 2010.
37
Sonoma’s recoverable coal reserves are primarily metallurgical grade coal (standard coking coal plus low volatile coal for pulverized coal injection) with lesser steam coal. Sonoma coal quality is presented in the following table.
| Mine |
Coal Type (2) |
Moist Recoverable Reserves Proven & Probable (1) |
Sulfur Content % |
As Received Btu/lb | ||||
| Sonoma |
Metallurgical | 9.4 | 0.48 | 13,800 | ||||
| Steam | 12.2 | 0.55 | 10,800 | |||||
| Total |
21.6 |
| (1) | In million of metric tons of 2,205 pounds. In-place coal at 8 percent moisture, recoverable clean coal at 9 percent moisture. Reserves listed on 100% basis. Cliffs Natural Resources has an effective 45 percent interest in the joint venture. |
| (2) | Sonoma steam coal recoverable reserves meet US compliance standards as defined by Phase II of the Clean Air Act as coal having sulfur dioxide content of 1.2 pounds or less per million Btu. |
Alabama Dust Litigation. Waid et al. v. U.S. Steel Mining Company et al., was brought in 2004 by approximately 160 individual plaintiffs asserting property damage and injuries arising from particulate emissions from the Concord Preparation Plant. A writ of mandamus had been filed in connection with the Waid litigation arguing that the Waid litigation should be dismissed because of a 2002 settlement agreement in a related case, White et al. v. USX Corporation et al. The Supreme Court of Alabama ruled on this matter on June 26, 2009, denying our writ of mandamus and sending the case back to the Bessemer Division of the Jefferson Circuit Court for trial on claims originating after July 1, 2003. The case is in a very early stage of discovery and we intend to defend this case vigorously.
On February 1, 2009, an additional lawsuit was filed by approximately 210 individual plaintiffs also asserting post-July 1, 2003 property damage and injuries arising from particulate emissions from the Concord Preparation Plant. This case has been consolidated with the Waid litigation for purposes of discovery. We expect this case to be consolidated with the Waid litigation for trial. This litigation is in a very early stage and we intend to defend this case vigorously.
Amapá Environmental Litigation. In July 2009, an order issued by the Sole State Court for the County of Serra do Navio, State of Amapá was published with respect to a ruling in an ex parte proceeding, ordering the cessation of any activities at Amapá and the neighboring operations of Mineração Pedra Branca do Amapari that caused the displacement of soil into the riverbeds of certain creeks near the two operations, as well as the suspension of the use of water from or discharged into the Mário Cruz Creek by Amapá, pending the completion of an environmental audit to be conducted by experts selected by the plaintiff, the Public Prosecutor of the State of Amapá, and completed within 180 days from notification of the order. In addition, the judge ordered the parties to unclog and extend certain storm drains located on a road that provides access to Amapá. The order also provided for fines of approximately $26,000 per day for violations of the order. Amapá retained independent environmental consultants to assess the situation with respect to the nearby creeks and determine whether Amapá’s operations were impacting the creeks. At a special hearing held in August 2009 the Judge granted Amapá’s motion for suspension of the preliminary injunction for a period of 60 days, allowing immediate resumption of Amapá’s operations as long as appropriate measures were taken to minimize environmental impacts. The 60-day term was later extended an additional 30 days through November 2009. The Judge did not suspend the penalty/fine imposed on Amapá or determine that funds in Amapá’s bank account be blocked in order to guarantee payment of the fine. In September 2009 Amapá filed an interlocutory appeal to the Appellate Court concerning the State Court’s imposition of penalty fines. In October 2009, the reporting judge of the Appellate Court issued an interim order suspending the State Court Judge’s decision to block funds until a decision was rendered on the merits of the interlocutory appeal by the Appellate Court. In the fourth quarter of 2009, the parties entered into a settlement agreement with the Public Prosecutor Office and 33 families affected by the alleged environmental damages caused to Creek Willian. Under the settlement agreement, the parties
38
agreed to pay (i) R$142,000 for the costs of the environmental assessment of the creeks by the court; and (ii) R$20,580 to each of the 33 families affected by the alleged environmental damages caused to Creek Willian. The settlement agreement was confirmed by the court in December 2009. In its confirmation decision, the Amapá court agreed to suspend the enforceability of the preliminary injunction for an additional 90 days, through March 15, 2010. The settlement agreement did not terminate the current litigation, which is still ongoing. Amapá’s share of the costs has been deposited into an escrow account to fulfill its obligation.
ArcelorMittal Arbitrations. On August 19, 2009 ArcelorMittal USA Inc. filed an arbitration demand against The Cleveland-Cliffs Iron Company and Cliffs Mining Company with respect to the Pellet Sale and Purchase Agreement dated December 31, 2002 covering the Ispat works. Pursuant to the agreement, beginning in 2009, in the event the price of pellets is above or below a contractually agreed upon amount one of the parties may request a price reopener. Notice of the request must be received in writing before July 1 of the year in determination. ArcelorMittal did not attempt to provide written notice until July 31, 2009, and did not show that the triggering event had occurred. Cliffs declined to enter into price reopener discussions. Cliffs filed its answer on September 9, 2009. Summary judgment motions were filed by both sides on January 11, 2010.
On September 11, 2009 Cliffs, The Cleveland-Cliffs Iron Company, Cliffs Mining Company, Northshore Mining Company and Cliffs Sales Company filed an arbitration demand against ArcelorMittal USA Inc., ISG Cleveland Inc., ISG Indiana Harbor Inc. and Mittal Steel USA Weirton Inc. with respect to the pellet nominations ArcelorMittal submitted to Cliffs in 2008 and 2009 for the calendar year 2009. Pursuant to the umbrella agreement entered into by the parties in 2007, ArcelorMittal is to provide a nomination to Cliffs on or before October 31 for its pellet requirements for the following year. The parties are to reduce to writing a mutual confirmation of the nomination by November 30, which is to include a shipping schedule. After the written confirmation, the nomination and the accompanying shipping schedule are final. In the calendar year 2008, ArcelorMittal attempted to revise its nomination. An AAA panel found that the revised nomination was a nullity and not provided for under the terms of the contract. In 2009, ArcelorMittal again provided several revised nominations and shipping schedules. Cliffs filed the arbitration to enforce the nomination finalized in November 2008 for the year 2009. ArcelorMittal filed an answer on October 1, 2009. A panel for the arbitration has been selected; however the arbitration is in a very early phase.
On September 11, 2009 the same Cliffs companies filed a second arbitration demand against the same ArcelorMittal companies with respect to the pellet nominations submitted in 2008 and 2009 for the calendar year 2009. The umbrella agreement permits ArcelorMittal to make a one-time election to defer tons from one calendar year into the next. If ArcelorMittal elects to defer tonnage from 2009 into 2010, it is prohibited from electing a reduction in its required minimum tonnage for 2010 and must purchase the deferred tonnage in 2010. ArcelorMittal elected to defer 550,000 tons in its nomination for 2009. In early 2009, ArcelorMittal purported to revoke its deferral for the year 2009 tons, attempting to increase its nomination for the calendar year 2009 and thereby permit ArcelorMittal to reduce its required minimum tonnage for 2010. Cliffs filed the AAA demand requesting that the panel enforce the nomination and 2009 deferral contained therein. ArcelorMittal filed an answer and counterdemand on October 1, 2009. This arbitration has been consolidated with the other September 11, 2009 arbitration.
Cliffs Erie Citizens Suit. On January 28, 2010, we received a notice of intent to sue pursuant to Section 505 of the Clean Water Act on behalf of the Center for Biological Diversity, Save Lake Superior Association and the Indigenous Environmental Network. Pursuant to the notice, these environmental groups intend to file a lawsuit in Federal court for alleged violations by our Cliffs Erie subsidiary of NPDES permits at three separate locations on the Cliffs Erie property. We are currently investigating the allegations and intend to defend any resultant lawsuit vigorously.
Maritime Asbestos Litigation. The Cleveland-Cliffs Iron Company and/or The Cleveland-Cliffs Steamship Company have been named defendants in 487 actions brought from 1986 to date by former seamen in which the plaintiffs claim damages under federal law for illnesses allegedly suffered as the result of exposure to airborne asbestos fibers while serving as crew members aboard the vessels previously owned or managed by our entities until the mid-1980s. All of these actions have been consolidated into multidistrict proceedings in the Eastern District of Pennsylvania, whose docket now includes a total of over 30,000 maritime cases filed by seamen against
39
ship-owners and other defendants. All of these cases have been dismissed without prejudice, but could be reinstated upon application by plaintiffs’ counsel. By court orders on October 29, 2009 and January 4, 2010, the court reinstated a total of 760 cases in three groups. We are a defendant in eight cases that have been reinstated. The plaintiffs in these reinstated cases have been ordered to file notices in each case identifying the remaining defendants they intend to pursue and serve the remaining defendants with a medical diagnosis or opinion upon which the plaintiffs intend to rely within ten days of filing the notice. Defendants in each case will then have the opportunity to file answers and procedural motions. It is anticipated that scheduling orders will be issued in each group of cases providing discovery, motion practice and settlement discussions to occur during 2010, with unsettled cases going to trial beginning at the end of 2010. The claims in the eight reinstated cases involve allegations with respect to lung cancer, asbestosis and pleural changes of varying severity. The claims against our entities are insured in amounts that vary by policy year; however, the manner in which these retentions will be applied remains uncertain. Our entities continue to vigorously contest these claims and have made no settlements on them.
Northshore Air Permit Matters. On December 16, 2006, Northshore submitted an application to the MPCA for an administrative amendment to its air permit. The proposed amendment requested the deletion of a term in the air permit that was derived from a court case brought against the Silver Bay taconite operations in 1972. The permit term incorporated elements of the court-ordered requirement to reduce fiber emissions to below a medically significant level by installing controls that would be deemed adequate if the fiber levels in Silver Bay were below those of a control city such as St. Paul. We requested deletion of this “control city” permit requirement on the grounds that the court-ordered requirements had been satisfied more than 20 years ago and should no longer be included in the permit. The MPCA denied our application on February 23, 2007. We appealed the denial to the Minnesota Court of Appeals. The court of appeals ruled in MPCA’s favor. Subsequent to the court of appeals’ ruling, Northshore filed a major permit amendment on August 28, 2008 requesting the removal of all fiber-related provisions from Northshore’s air permit and proposing that Northshore install additional particulate controls. MPCA issued a “Findings of Fact, Conclusions of Law and Order” on November 25, 2008 declaring that Northshore’s request to remove the “Control City Standard” from its permit constitutes a “project” for which an EAW must be completed. MPCA also stated that it was ceasing all other work on the permit, including its own efforts to create a replacement standard, until the environmental review process was complete.
Northshore subsequently filed an action to challenge the MPCA’s requirement for an EAW in Minnesota State District Court for the Sixth Judicial District. Oral arguments on cross motions for summary judgment were heard on October 19, 2009. On January 13, 2010, the court ruled in Northshore’s favor, ruling that Northshore was entitled to judgment in its favor as a matter of law. The court specifically ruled that our request to remove the “Control City Standard” was not a project under Minnesota law and that MPCA’s determination that Northshore’s application required an EAW was arbitrary and capricious, unsupported by substantial evidence and an error of law. At this time it is not known whether MPCA will appeal the court’s ruling and no action has been taken to date with respect to our major permit amendment.
Republic Arbitration. On October 1, 2006, we entered into an agreement for the sale of pellets with Republic Engineered Products, Inc. (“Republic”). Pursuant to that agreement Republic was required to purchase a percentage of its iron ore requirements from us. Republic is required to provide us with a firm nomination by a certain date each year. As of the end of 2008 Republic had failed to take delivery and pay for a portion of the tons remaining from its 2008 nomination. After several failed attempts at negotiating a workout agreement, we filed a Demand for Arbitration on February 2, 2009 for a total of $30.7 million plus interest, commencing December 31, 2008. On September 21, 2009 Cliffs provided notice to Republic that it had mitigated its damages and would be offsetting its claim by those amounts. On September 28, 2009 Cliffs notified Republic of the value of the mitigation and that its claim had been reduced to approximately $9 million. Cliffs also amended its arbitration demand to reflect the mitigated damages. On October 30, 2009, the arbitration panel ruled in our favor, entering a judgment in favor of the Company of approximately $9.2 million. Republic paid the award in two equal payments on December 7, 2009 and January 8, 2010, respectively.
The Rio Tinto Mine Site. The Rio Tinto Mine Site is a historic underground copper mine located near Mountain City, Nevada, where tailings were placed in Mill Creek, a tributary to the Owyhee River. Site investigation and remediation work is being conducted in accordance with a Consent Order between the NDEP
40
and the RTWG composed of Cliffs, Atlantic Richfield Company, Teck Cominco American Incorporated, and E. I. du Pont de Nemours and Company. The Consent Order provides for technical review by the U.S. Department of the Interior Bureau of Indian Affairs, the U.S. Fish & Wildlife Service, U.S. Department of Agriculture Forest Service, the NDEP and the Shoshone-Paiute Tribes of the Duck Valley Reservation (collectively, “Rio Tinto Trustees”). The Consent Order is expected to continue with the objective of supporting the selection of the final remedy for the site. As of December 31, 2009, the estimated costs of the available remediation alternatives currently range from approximately $10.0 million to $30.5 million in total for all potentially responsible parties. In recognition of the potential for an NRD claim, the parties are actively pursuing a global settlement that would include the EPA and encompass both the remedial action and the NRD issues.
On May 29, 2009, the RTWG entered into a Rio Tinto Mine Site Work and Cost Allocation Agreement (the “Allocation Agreement”) to resolve differences over the allocation of any negotiated remedy. The Allocation Agreement contemplates that the RTWG will enter into an insured fixed-price cleanup agreement, or IFC, pursuant to which a contractor would assume responsibility for the implementation and funding of the remedy in exchange for a fixed price. We are obligated to fund 32.5 percent of the IFC. In the event an IFC is not implemented, the RTWG has agreed on allocation percentages in the Allocation Agreement, with Cliffs being committed to fund 32.5 percent of any remedy. We have a current reserve that we believe is adequate to fund our anticipated portion of the IFC.
United Taconite Air Emissions Matter. On March 27, 2008, United Taconite received a DSA from the MPCA alleging various air emissions violations of the facility’s air permit limit conditions, reporting and testing requirements. The allegations generally stem from procedures put in place prior to 2004 before our acquisition of our interest in the mine. The DSA requires the facility to install continuous emissions monitoring, evaluate compliance procedures, submit a plan to implement procedures to eliminate air deviations during the relevant time period, and proposes a civil penalty in an amount to be determined. While United Taconite does not agree with MPCA’s allegations, United Taconite and the MPCA continue discussions on the matter with the intent of working toward a mutual resolution. In the second quarter of 2009, United Taconite satisfied various requirements of the DSA, including installation of continuous emission monitoring systems (CEMS) on furnace waste gas stacks, purchase of a new water truck, installation of improved dust collector controls, retirement of 1,160 tons of sulfur dioxide emission allowances, and payment of a $125,000 civil penalty. All outstanding stipulation agreement requirements have been completed except for the certification of the three CEMS units. One unit must be certified by June 1, 2010, and the other two units must be certified within 60 days of the first.
Wisconsin Electric Power Company Rate Cases. The current tariff rates applicable to Tilden and Empire became effective on January 1, 2009. On July 2, 2009, WEPCO filed a new rate case wherein WEPCO has proposed an increase to these current tariff rates. On July 13, 2009, we filed a petition to intervene in the new rate case. Testimony in the rate case before an administrative law judge was completed in early February 2010. All parties will then have an opportunity to file briefs before the administrative law judge. A proposal for decision is expected from the administrative law judge by the end of April 2010.
On September 30, 2009 WEPCO filed with the MPSC its power supply cost recovery (“PSCR”) plan case for calendar year 2010. As part of its application, WEPCO calculates its proposed 2010 PSCR costs and seeks recovery of prior years’ power supply costs. On October 6, 2009, Tilden and Empire filed a petition to intervene in WEPCO’s 2010 PSCR plan case on the grounds that the rates, terms and conditions of service affected by the proceeding will directly and substantially impact them.
West Virginia Flood Litigation. As of February 2008, Cliffs’ Pinnacle Mining Company was named as a defendant in six lawsuits brought against over 60 defendants who were allegedly involved in land disturbing activities, primarily mining or logging, in Wyoming County, West Virginia. In each case the plaintiffs alleged that these activities in Wyoming County resulted in flooding on or after July 8, 2001. The plaintiffs sought a permanent injunction and unstated personal and property damages under a number of legal theories. We participated in a mandatory panel mediation on December 2 and 3, 2009. Certain defendants entered into a global confidential settlement with plaintiffs. We participated in the global confidential settlement and were dismissed from the litigation without having to make any payments.
Item 4. Submission of Matters to a Vote of Security Holders.
None.
41
| Item 5. | Market for Registrant’s Common Equity, Related Stockholder Matters and Issuer Purchases of Equity Securities. |
Stock Exchange Information
Our Common Shares (ticker symbol CLF) are listed on the New York Stock Exchange and the Professional Segment of NYSE Euronext Paris.
Common Share Price Performance and Dividends
The following table sets forth, for the periods indicated, the high and low sales prices per common share as reported on the NYSE and the dividends declared per common share:
| 2009 | 2008 | |||||||||||||||||
| High | Low | Dividends | High | Low | Dividends | |||||||||||||
| First Quarter |
$ | 32.48 | $ | 11.80 | $ | 0.0875 | $ | 63.89 | $ | 38.63 | $ | 0.0875 | ||||||
| Second Quarter |
32.14 | 17.18 | 0.0400 | 121.95 | 57.32 | 0.0875 | ||||||||||||
| Third Quarter |
35.57 | 19.44 | 0.0400 | 118.10 | 42.16 | 0.0875 | ||||||||||||
| Fourth Quarter |
48.41 | 29.05 | 0.0875 | 53.30 | 13.73 | 0.0875 | ||||||||||||
| Year |
48.41 | 11.80 | $ | 0.2550 | 121.95 | 13.73 | $ | 0.3500 | ||||||||||
At February 15, 2010, we had 1,509 shareholders of record.
Shareholder Return Performance
The following graph shows changes over the past five-year period in the value of $100 invested in: (1) Cliffs’ Common Shares; (2) S&P Stock Index; (3) S&P Steel Group Index; and (4) S&P Mid Cap 400 Index. The values of each investment are based on price change plus reinvestment of all dividends.

42
| 2004 | 2005 | 2006 | 2007 | 2008 | 2009 | |||||||||
| CLIFFS NATURAL RESOURCES INC. |
Return% | 70.90 | 9.77 | 108.77 | -48.90 | 81.92 | ||||||||
| Cum $ | 100.00 | 170.90 | 187.59 | 391.64 | 200.14 | 364.10 | ||||||||
| S&P 500 Index - Total Returns |
Return% | 4.91 | 15.78 | 5.49 | -36.99 | 26.47 | ||||||||
| Cum $ | 100.00 | 104.91 | 121.46 | 128.13 | 80.73 | 102.10 | ||||||||
| S&P 500 Steel Index |
Return% | 23.33 | 80.26 | 21.72 | -51.73 | 28.88 | ||||||||
| Cum $ | 100.00 | 123.33 | 222.31 | 270.60 | 130.62 | 168.34 | ||||||||
| S&P Midcap 400 Index |
Return% | 12.55 | 10.31 | 7.97 | -36.24 | 37.37 | ||||||||
| Cum $ | 100.00 | 112.55 | 124.16 | 134.05 | 85.47 | 117.41 |
Issuer Purchases of Equity Securities
| Period |
Total Number of Shares (or Units) Purchased |
Average Price Paid per Share (or Unit) $ |
Total Number of Shares (or Units) Purchased as Part of Publicly Announced Plans or Programs |
Maximum Number (or Approximate Dollar Value) of Shares (or Units) that May Yet be Purchased Under the Plans or Programs (1) | |||||
| October 1 — 31, 2009 |
— | — | — | 2,495,400 | |||||
| November 1 — 30, 2009 |
— | — | — | 2,495,400 | |||||
| December 1 — 31, 2009 |
76 | (2) | 35.57 | — | 2,495,400 | ||||
| Total |
76 | 35.57 | — | 2,495,400 |
| (1) | On July 11, 2006, we received the approval by the Board of Directors to repurchase up to an aggregate of four million outstanding Common Shares. There were no repurchases in the fourth quarter under this program. |
| (2) | On December 4, 2009, the Company acquired 76 Common Shares pursuant to a scheduled distribution election from a VNQDC Plan participant. The shares were repurchased by the Company to satisfy the tax withholding obligation of that participant pursuant to the distribution. |
43
| Item 6. | Selected Financial Data. |
Summary of Financial and Other Statistical Data
Cliffs Natural Resources Inc. and Subsidiaries
| 2009 | 2008 (a) | 2007 (b) | 2006 | 2005 (a) | ||||||||||||||||
| Financial data (in millions, except per share amounts and employees) |
||||||||||||||||||||
| Revenue from product sales and services |
$ | 2,342.0 | $ | 3,609.1 | $ | 2,275.2 | $ | 1,921.7 | $ | 1,739.5 | ||||||||||
| Cost of goods sold and operating expenses |
(2,033.1 | ) | (2,449.4 | ) | (1,813.2 | ) | (1,507.7 | ) | (1,350.5 | ) | ||||||||||
| Other operating expense |
(78.7 | ) | (220.8 | ) | (80.4 | ) | (48.3 | ) | (32.5 | ) | ||||||||||
| Operating income |
230.2 | 938.9 | 381.6 | 365.7 | 356.5 | |||||||||||||||
| Income from continuing operations |
204.3 | 537.0 | 285.4 | 296.9 | 283.3 | |||||||||||||||
| Income (loss) from discontinued operations |
— | — | 0.2 | 0.3 | (0.8 | ) | ||||||||||||||
| Income before cumulative effect of accounting changes |
204.3 | 537.0 | 285.6 | 297.2 | 282.5 | |||||||||||||||
| Cumulative effect of accounting changes (c) |
— | — | — | — | 5.2 | |||||||||||||||
| Net income |
204.3 | 537.0 | 285.6 | 297.2 | 287.7 | |||||||||||||||
| Less: Net income (loss) attributable to noncontrolling interest |
(0.8 | ) | 21.2 | 15.6 | 17.1 | 10.1 | ||||||||||||||
| Net income attributable to Cliffs shareholders |
205.1 | 515.8 | 270.0 | 280.1 | 277.6 | |||||||||||||||
| Preferred stock dividends |
— | (1.1 | ) | (5.2 | ) | (5.6 | ) | (5.6 | ) | |||||||||||
| Income attributable to Cliffs common shareholders |
205.1 | 514.7 | 264.8 | 274.5 | 272.0 | |||||||||||||||
| Earnings (loss) per common share attributable to Cliffs shareholders — basic (d) |
||||||||||||||||||||
| Continuing operations |
1.64 | 5.07 | 3.19 | 3.26 | 3.08 | |||||||||||||||
| Discontinued operations |
— | — | — | — | (0.01 | ) | ||||||||||||||
| Cumulative effect of accounting changes |
— | — | — | — | 0.06 | |||||||||||||||
| Earnings per common share attributable to Cliffs shareholders — basic (d) |
1.64 | 5.07 | 3.19 | 3.26 | 3.13 | |||||||||||||||
| Earnings (loss) per common share attributable to Cliffs shareholders — diluted (d) |
||||||||||||||||||||
| Continuing operations |
1.63 | 4.76 | 2.57 | 2.60 | 2.46 | |||||||||||||||
| Discontinued operations |
— | — | — | — | (0.01 | ) | ||||||||||||||
| Cumulative effect of accounting changes |
— | — | — | — | 0.05 | |||||||||||||||
| Earnings per common share attributable to Cliffs shareholders — diluted (d) |
1.63 | 4.76 | 2.57 | 2.60 | 2.50 | |||||||||||||||
| Total assets |
4,639.3 | 4,111.1 | 3,075.8 | 1,939.7 | 1,746.7 | |||||||||||||||
| Long-term obligations |
644.3 | 580.2 | 490.9 | 47.2 | 49.6 | |||||||||||||||
| Net cash from operating activities |
185.7 | 853.2 | 288.9 | 428.5 | 514.6 | |||||||||||||||
| Redeemable cumulative convertible perpetual preferred stock |
— | 0.2 | 134.7 | 172.3 | 172.5 | |||||||||||||||
| Distributions to preferred shareholders cash dividends |
— | 1.1 | 5.5 | 5.6 | 5.6 | |||||||||||||||
| Distributions to common shareholders cash dividends (e) |
||||||||||||||||||||
| - Per share (d) |
0.26 | 0.35 | 0.25 | 0.24 | 0.15 | |||||||||||||||
| - Total |
31.9 | 36.1 | 20.9 | 20.2 | 13.1 | |||||||||||||||
| Repurchases of common shares |
— | — | 2.2 | 121.5 | — | |||||||||||||||
| Iron ore and coal production and sales statistics (tons in millions — North America; tonnes in millions — Asia-Pacific) |
||||||||||||||||||||
| Production tonnage - North American iron ore |
19.6 | 35.2 | 34.6 | 33.6 | 35.9 | |||||||||||||||
| - North American coal |
1.7 | 3.5 | 1.1 | — | — | |||||||||||||||
| - Asia Pacific iron ore |
8.3 | 7.7 | 8.4 | 7.7 | 5.2 | |||||||||||||||
| Production tonnage - North American iron ore (Cliffs’ share) |
17.1 | 22.9 | 21.8 | 20.8 | 22.1 | |||||||||||||||
| Sales tonnage - North American iron ore |
16.4 | 22.7 | 22.3 | 20.4 | 22.3 | |||||||||||||||
| - North American coal |
1.9 | 3.2 | 1.2 | — | — | |||||||||||||||
| - Asia Pacific iron ore |
8.5 | 7.8 | 8.1 | 7.4 | 4.9 | |||||||||||||||
| Common shares outstanding - basic (millions) (d) |
||||||||||||||||||||
| - Average for year |
125.0 | 101.5 | 83.0 | 84.1 | 86.9 | |||||||||||||||
| - At year-end |
131.0 | 113.5 | 87.2 | 81.8 | 87.6 | |||||||||||||||
44
| (a) | On April 19, 2005, we completed the acquisition of 80.4 percent of our Asia Pacific Iron Ore segment (formerly known as Portman, an iron ore mining company in Australia). Results for 2005 include Portman’s results since the acquisition. On May 21, 2008, Portman authorized a tender offer to repurchase shares, and as a result, our ownership interest in Portman increased from 80.4 percent to 85.2 percent on June 24, 2008. On September 10, 2008, we announced an off-market takeover offer to acquire the remaining shares in Portman, which closed on November 3, 2008. We subsequently proceeded with a compulsory acquisition of the remaining shares and have full ownership of Portman as of December 31, 2008. Results for 2008 reflect the increase in our ownership of Portman since the date of each step acquisition. |
| (b) | On July 31, 2007, we completed the acquisition of Cliffs North American Coal LLC (formerly PinnOak), a producer of high-quality, low-volatile metallurgical coal. Results for 2007 include PinnOak’s results since the acquisition. |
| (c) | Effective January 1, 2005, we adopted the provisions of ASC 930-330-25-1 related to accounting for stripping costs incurred during production in the mining industry. |
| (d) | On March 11, 2008, our board of directors declared a two-for-one stock split of our common shares. The record date for the stock split was May 1, 2008 with a distribution date of May 15, 2008. On May 9, 2006, our board of directors approved a two-for-one stock split of our common shares. The record date for the stock split was June 15, 2006 with a distribution date of June 30, 2006. Accordingly, all common shares and per share amounts for all periods presented have been adjusted retroactively to reflect the stock splits. |
| (e) | On May 12, 2009, our board of directors enacted a 55 percent reduction in our quarterly common share dividend to $0.04 from $0.0875 for the second and third quarters of 2009 in order to enhance financial flexibility. The $0.04 common share dividends were paid on June 1, 2009 and September 1, 2009 to shareholders of record as of May 22, 2009 and August 14, 2009, respectively. In the fourth quarter of 2009, the dividend was reinstated to its previous level. |
45
| Item 7. | Management’s Discussion and Analysis of Financial Condition and Results of Operations. |
Overview
Cliffs Natural Resources Inc. traces its corporate history back to 1847. Today, we are an international mining and natural resources company. We are the largest producer of iron ore pellets in North America, a major supplier of direct-shipping lump and fines iron ore out of Australia, and a significant producer of metallurgical coal. Our company’s operations are organized according to product category and geographic location: North American Iron Ore, North American Coal, Asia Pacific Iron Ore, Asia Pacific Coal and Latin American Iron Ore.
In North America, we operate six iron ore mines in Michigan, Minnesota and Eastern Canada, and two coking coal mine complexes located in West Virginia and Alabama. Our Asia Pacific operations are comprised of two iron ore mining complexes in Western Australia, serving the Asian iron ore markets with direct-shipping fines and lump ore, and a 45 percent economic interest in Sonoma, a coking and thermal coal mine located in Queensland, Australia. In Latin America, we have a 30 percent interest in Amapá, a Brazilian iron ore project.
Over recent years, we have been executing a strategy designed to achieve scale in the mining industry and focused on serving the world’s largest and fastest growing steel markets. However, the current volatility and uncertainty in global markets, which persisted throughout 2009, coupled with the slowdown in the world’s major economies, has had a significant impact on commodity prices and demand. While showing signs of improvement during the second half of 2009, global crude steel production, a significant driver of our business, was down approximately 8 percent from 2008, with even greater production declines in some areas, including North America.
Consolidated revenues for 2009 decreased to $2.3 billion, with net income per diluted share of $1.63. This compares with revenues of $3.6 billion and net income per diluted share of $4.76 in 2008. In response to the economic downturn and its impact on the steel industry, we initiated and extended production curtailments at our North American mines during 2009 necessary to align output with lower demand and optimize inventory. In Asia Pacific, the demand for steelmaking raw materials remained strong throughout the year primarily led by demand from China. Despite the absence of benchmark price settlements in China, we negotiated final pricing arrangements consistent with agreed upon price declines reached between Asia Pacific steelmakers outside of China and producers in Australia. Results for 2009 were favorably impacted by the rise in the Australian dollar to an exchange rate of A$0.90 at December 31, 2009, resulting in $85.7 million of unrealized gains on foreign currency exchange contracts during the year.
Throughout 2009, we took proactive measures in response to the high degrees of uncertainty within our industry and the macroeconomic environment as well as to better position ourselves to take advantage of possible opportunities when the market improved. In 2009, we also continued to focus on cash conservation and generation from our business operations as well as reduction of discretionary capital expenditures, in order to ensure we were positioned to face the challenges and uncertainties associated with the current environment. These actions have allowed us to weather the financial crisis and continue to pursue our strategic plan.
Segments
We organize our business according to product category and geographic location: North American Iron Ore, North American Coal, Asia Pacific Iron Ore, Asia Pacific Coal and Latin American Iron Ore. The Asia Pacific Coal and Latin American Iron Ore operating segments do not meet the criteria for reportable segments.
All North American business segments are headquartered in Cleveland, Ohio. Our Asia Pacific headquarters is located in Perth, Australia, and our Latin American headquarters is located in Rio de Janeiro, Brazil. See NOTE 2 — SEGMENT REPORTING for further information.
Growth Strategy and Strategic Transactions
While maintaining a disciplined approach to our operating activities given the current economic environment, we continue to identify opportunities to grow and at the same time position ourselves to address any uncertainties that lie ahead. We expect to continue increasing our operating scale and presence as an
46
international mining and natural resources company by expanding both geographically and through the minerals we mine and market. Our growth in North America combined with our investments in Australia and Latin America, as well as acquisitions in minerals outside of iron ore, such as metallurgical coal and chromite, illustrates the execution of this strategy. We also expect to achieve growth through early involvement in exploration and development activities by partnering with junior mining companies, which provide us low-cost entry points for potentially significant reserve additions. In 2009, we established a global exploration group, led by professional geologists who have the knowledge and experience to identify new world-class projects for future development or projects that add significant value to existing operations.
We continued our strategic growth and transformation to an international mining and natural resources company through the following transactions:
| • | Acquisition of Freewest |
| • | Acquisition of remaining interest in Wabush |
| • | Acquisition of additional interest in renewaFUEL |
| • | Establishment of a global exploration group |
Refer to Recent Developments within Item 1 — Business, for additional information regarding each of these strategic transactions.
Results of Operations — Consolidated
2009 Compared to 2008
The following is a summary of our consolidated results of operations for 2009 compared with 2008:
| (In Millions) | ||||||||||||
| 2009 | 2008 | Variance Favorable/ (Unfavorable) |
||||||||||
| Revenues from product sales and services |
$ | 2,342.0 | $ | 3,609.1 | $ | (1,267.1 | ) | |||||
| Cost of goods sold and operating expenses |
(2,033.1 | ) | (2,449.4 | ) | 416.3 | |||||||
| Sales Margin |
$ | 308.9 | $ | 1,159.7 | $ | (850.8 | ) | |||||
| Sales Margin % |
13.2 | % | 32.1 | % | -18.9 | % | ||||||
Revenue from Product Sales and Services
Sales revenue in 2009 declined $1.3 billion, or 35 percent from 2008. The decrease in sales revenue was primarily due to lower sales volumes related to our North American business operations as a result of the volatility and uncertainty in global markets throughout much of 2009, which led to production slowdowns in the North American steel industry, and in turn reduced demand for iron ore and metallurgical coal. In addition, the global economic crisis resulted in a great deal of pressure from customers, particularly in China, for a roll back of the 2008 price increases for seaborne iron ore and metallurgical coal in 2009. We experienced a reduction in current year pricing at each of our business units, thereby contributing to lower revenue levels in 2009.
As a result of the deteriorating market conditions that continued throughout much of 2009, revenues related to our North American Iron Ore and Coal segments decreased approximately $921.8 million and $139.1 million, respectively, compared with 2008. Based upon the economic downturn and the resulting impact on demand, sales volumes in 2009 declined approximately 28 percent at North American Iron Ore. North American Coal experienced a decrease in volume of 42 percent year over year. Revenues in 2009 were also negatively impacted by base rate adjustments related to reductions in World Pellet Pricing and producer price indices referenced in certain of our North American Iron Ore contracts as well as the estimated decline in average annual hot band steel pricing for one of our North American Iron Ore customers.
47
Revenues from our Asia Pacific operations were negatively impacted by the decline in 2009 iron ore prices caused by lower demand for steel worldwide. As a result, revenues at Asia Pacific Iron Ore in 2009 declined 30 percent from the prior year. Pricing decreases in the current year contrast with settled price increases in 2008 of 97 percent and 80 percent for lump and fines, respectively. The overall decline in current year revenue at Asia Pacific Iron Ore was partially offset by positive sales mix and a 9 percent increase in sales volume as a result of increased demand from China.
Refer to “Results of Operations — Segment Information” for additional information regarding the impact of specific factors that impacted revenue during the period.
Cost of Goods Sold
Cost of goods sold was $2.0 billion in 2009, a decrease of $416.3 million, or 17 percent compared with 2008. The decrease is primarily attributable to lower costs at our North American business operations as a result of declines in sales volume and cost reductions during the year related to ongoing cash conservation efforts that have been reinforced in light of the economic environment. Costs were also favorably impacted in 2009 by approximately $35.2 million related to favorable foreign exchange rates compared with the prior year. In addition, year-to-date fuel and energy costs in our North American and Asia Pacific iron ore operations decreased approximately $71.6 million from 2008.
The overall decrease in cost of goods in 2009 was partially offset by idle expense of approximately $159.6 million related to production curtailments in North America throughout the year. In addition, costs in 2009 reflect the impact of the Asia Pacific Iron Ore and United Taconite step acquisitions, which occurred in the second half of 2008.
Refer to “Results of Operations — Segment Information” for additional information regarding the impact of specific factors that impacted our operating results during the period.
Other Operating Income (Expense)
Following is a summary of other operating income (expense) for 2009 and 2008:
| (In Millions) | ||||||||||||
| 2009 | 2008 | Variance Favorable/ (Unfavorable) |
||||||||||
| Royalties and management fee revenue |
$ | 4.8 | $ | 21.7 | $ | (16.9 | ) | |||||
| Selling, general and administrative expenses |
(120.7 | ) | (188.6 | ) | 67.9 | |||||||
| Terminated acquisition costs |
— | (90.1 | ) | 90.1 | ||||||||
| Gain on sale of other assets — net |
13.2 | 22.8 | (9.6 | ) | ||||||||
| Casualty recoveries |
— | 10.5 | (10.5 | ) | ||||||||
| Miscellaneous — net |
24.0 | 2.9 | 21.1 | |||||||||
| $ | (78.7 | ) | $ | (220.8 | ) | $ | 142.1 | |||||
The decrease in royalties and management fee revenue of $16.9 million in 2009 compared with 2008 is primarily attributable to lower production at our iron ore mines and reduced sales prices. Additionally, we received all of Tilden’s production in 2009. Therefore, the remaining venture partner at Tilden was not required to pay us the resulting royalty for their share of tons mined and produced from the ore reserves owned by Cliffs.
The decrease in selling, general and administrative expense of $67.9 million in 2009 compared with 2008 is primarily the result of an increased focus on cost reduction efforts due to the current economic conditions. In particular, outside professional service and legal fees associated with the expansion of our business declined approximately $38.4 million during the year. Additionally, employment costs were reduced by $26.2 million primarily as a result of lower share-based and incentive compensation. Expenses at our Asia Pacific Iron Ore segment were $6.2 million higher in 2009 when compared with 2008, reflecting an increased focus on marketing activities due to the weakening economic climate, as well as higher employment costs and outside professional
48
services to support business development and improvement efforts. In addition, selling, general and administrative expense in the prior year was impacted by a charge in the first quarter of 2008 of approximately $6.8 million in connection with a legal judgment.
On November 17, 2008, we announced the termination of the definitive merger agreement with Alpha Natural Resources, Inc., under which we would have acquired all outstanding shares of Alpha. Both our board of directors and Alpha’s board of directors made the decision after considering various issues, including the current macroeconomic environment, uncertainty in the steel industry, shareholder dynamics, and the risks and costs of potential litigation. Considering these issues, each board determined that termination of the merger agreement was in the best interest of its equity holders. Under the terms of the settlement agreement, we were required to pay Alpha a $70 million termination fee, which was financed through our revolving credit facility and paid in November 2008. As a result, $90.1 million in termination fees and associated acquisition costs were expensed in the fourth quarter of 2008 upon termination of the definitive merger agreement.
In October 2009, Asia Pacific Iron Ore completed the sale of its 50 percent interest in the Irvine Island iron ore project to its joint venture partner, Pluton Resources Limited (“Pluton Resources”). The consideration received consisted of a cash payment of approximately $5 million and the issuance of 19.4 million shares in Pluton Resources, all of which resulted in recognition of a gain on sale amounting to $12.1 million. Our interest in Pluton Resources is approximately 12.5 percent at December 31, 2009. The prior year gain on sale of assets of $22.8 million primarily related to the sale of Cliffs Synfuel Corp. (“Synfuel”), which was completed in June 2008.
Casualty recoveries in 2008 were primarily attributable to a $9.2 million insurance recovery related to a 2006 electrical explosion at our United Taconite facility.
Miscellaneous — net of $24.0 million in 2009 is primarily attributable to exchange rate gains on foreign currency transactions related to loans denominated in Australian dollars, as a result of the increase in exchange rates during the period from A$0.69 at December 31, 2008 to A$0.90 at December 31, 2009.
Other income (expense)
Following is a summary of other income (expense) for 2009 and 2008:
| (In Millions) | ||||||||||||
| 2009 | 2008 | Variance Favorable/ (Unfavorable) |
||||||||||
| Changes in fair value of foreign currency contracts, net |
$ | 85.7 | $ | (188.2 | ) | $ | 273.9 | |||||
| Interest income |
10.8 | 26.2 | (15.4 | ) | ||||||||
| Interest expense |
(39.0 | ) | (39.8 | ) | 0.8 | |||||||
| Impairment of securities |
— | (25.1 | ) | 25.1 | ||||||||
| Other non-operating income |
2.9 | 4.3 | (1.4 | ) | ||||||||
| $ | 60.4 | $ | (222.6 | ) | $ | 283.0 | ||||||
49
The impact of changes in the fair value of our foreign currency contracts on the Statement of Consolidated Operations is due to fluctuations in foreign currency exchange rates during the year. The favorable unrealized mark-to-market fluctuation of $85.7 million in 2009 relates to the Australian to U.S. dollar spot rate of A$0.90 as of December 31, 2009, which increased considerably from the Australian to U.S. dollar spot rate of A$0.69 as of December 31, 2008. The changes in the spot rates are correlated to the appreciation of the Australian dollar relative to the United States dollar during the year. During 2009, approximately $780 million of outstanding contracts matured or were sold, resulting in a cumulative net realized loss of $37.0 million since inception of the contracts. The following table represents our foreign currency derivative contract position as of December 31, 2009:
| ($ in Millions) | ||||||||||
| Contract Maturity |
Notional Amount | Weighted Average Exchange Rate |
Spot Rate | Fair Value | ||||||
| Contract Portfolio (excluding AUD Call Options) (1) : |
||||||||||
| Contracts expiring in the next 12 months |
$ | 33.0 | 0.82 | 0.90 | $ | 0.9 | ||||
| Total |
$ | 33.0 | 0.82 | 0.90 | $ | 0.9 | ||||
| AUD Call Options (2) |
||||||||||
| Contracts expiring in the next 12 months |
$ | 75.5 | 0.88 | 0.90 | $ | 3.3 | ||||
| Total |
$ | 75.5 | 0.88 | 0.90 | $ | 3.3 | ||||
| Total Hedge Contract Portfolio |
$ | 108.5 | $ | 4.2 | ||||||
| (1) | Includes collar options and convertible collar options. |
| (2) | AUD call options are excluded from the weighted average exchange rate used for the remainder of the contract portfolio due to the unlimited downside participation associated with these instruments. |
The decrease in interest income in 2009 compared with 2008 is attributable to a decline in interest-bearing cash and investments held during the current year coupled with lower overall average returns. Investment returns in 2009 are lower as a result of market declines. The slight decrease in interest expense in 2009 is primarily due to lower average interest rates on total debt outstanding of 4.48 percent at December 31, 2009, compared with 5.85 percent at December 31, 2008, partially offset by an increase in the period outstanding related to borrowings under our senior notes. Higher interest expense in 2008 also reflected interest accretion for the deferred payment related to the PinnOak acquisition. See NOTE 9 — DEBT AND CREDIT FACILITIES for further information.
In 2008, we recorded impairment charges of $25.1 million related to declines in the fair value of our available-for-sale securities which we concluded were other than temporary. As of December 31, 2008, our investments in PolyMet and Golden West had fair values totaling $6.2 million and $4.7 million, respectively, compared with a cost of $14.2 million and $21.8 million, respectively. The severity of the impairments in relation to the carrying amounts of the individual investments was consistent with the macroeconomic market and industry developments during 2008. However, we evaluated the near-term prospects of the issuers in relation to the severity and rapid decline in the fair value of each of these investments, and based upon that evaluation, we could not reasonably assert that the impairment period would be temporary primarily as a result of the global economic crisis and the corresponding uncertainties in the market.
As a result of acquiring the remaining interest in Freewest effective January 27, 2010, results in the first quarter of 2010 will be impacted by approximately $13 million of realized gains, which will be recognized in Other income (expense) on the Statement of Operations for the period ended March 31, 2010.
Income Taxes
Our tax rate is affected by recurring items, such as depletion and tax rates in foreign jurisdictions and the relative amount of income we earn in our various jurisdictions. It is also affected by discrete items that may occur in any given year, but are not consistent from year to year. The following represents a summary of our tax provision and corresponding effective rates for the years ended December 31, 2009 and 2008:
| (In Millions) | ||||||||
| 2009 | 2008 | |||||||
| Income tax expense |
$ | 20.8 | $ | 144.2 | ||||
| Effective tax rate |
7.2 | % | 20.1 | % | ||||
50
Our tax provision for the years ended December 31, 2009 and 2008 was $20.8 million and $144.2 million, respectively. The $123.4 million decrease in income tax expense and 12.9 percent decrease in the effective tax rate are primarily attributable to lower pre-tax book income and increased benefits from certain discrete items, partially offset by increased valuation allowances. Discrete items in 2009 relate to benefits associated with the settlement of tax audits and filings for prior years. We had a $39.0 million increase in the valuation allowance of certain deferred tax assets. Of this amount, $24.5 million relates to certain foreign operating losses and $14.5 million relates to certain foreign assets where tax basis exceeds book basis.
A reconciliation of the statutory tax rate to the effective tax rate for the years ended December 31, 2009 and 2008 is as follows:
| 2009 | 2008 | |||||
| U.S. statutory rate |
35.0 | % | 35.0 | % | ||
| Increases/(Decreases) due to: |
||||||
| Percentage depletion |
(11.6 | ) | (11.9 | ) | ||
| Impact of foreign operations |
(9.1 | ) | (2.1 | ) | ||
| Valuation allowance |
11.9 | 1.6 | ||||
| Other items — net |
0.4 | (0.6 | ) | |||
| Effective income tax rate before discrete items |
26.6 | 22.0 | ||||
| Discrete items |
(19.4 | ) | (1.9 | ) | ||
| Effective income tax rate |
7.2 | % | 20.1 | % | ||
See NOTE 14 — INCOME TAXES for further information.
Equity Loss in Ventures
Equity loss in ventures is primarily comprised of our share of the results from Amapá and AusQuest, for which we have a 30 percent ownership interest in each. The equity loss in ventures for the year ended December 31, 2009 of $65.5 million primarily represents our share of the operating results of our equity method investment in Amapá. Such results consist of operating losses of $62.2 million. Results in 2008 mainly consisted of operating losses of $45.6 million, partially offset by foreign currency hedge gains of $10.5 million. The negative operating results in each year are primarily due to slower than anticipated ramp-up of operations and product yields. Our equity share of the losses for Amapá were also higher in the current year due to a write-down in the value of inventory, asset impairment charges, as well as changes in foreign currency exchange rates during 2009 and the resulting impact on project debt denominated in Brazilian real.
Noncontrolling Interest
Noncontrolling interest in consolidated income was a loss of $0.8 million in 2009 compared with income of $21.2 million in 2008. The change is primarily attributable to the acquisition of the remaining 19.6 percent interest in Asia Pacific Iron Ore (formerly known as Portman Limited) during 2008, thereby eliminating the related noncontrolling interests in 2009.
2008 Compared to 2007
The following is a summary of our consolidated results of operations for 2008 compared with 2007:
| (In Millions) | ||||||||||||
| 2008 | 2007 | Variance Favorable/ (Unfavorable) |
||||||||||
| Revenues from product sales and services |
$ | 3,609.1 | $ | 2,275.2 | $ | 1,333.9 | ||||||
| Cost of goods sold and operating expenses |
(2,449.4 | ) | (1,813.2 | ) | (636.2 | ) | ||||||
| Sales Margin |
$ | 1,159.7 | $ | 462.0 | $ | 697.7 | ||||||
| Sales Margin % |
32.1 | % | 20.3 | % | 11.8 | % | ||||||
51
Revenue from Product Sales and Services
Sales revenue in 2008 increased $1.3 billion, or 59 percent, compared with 2007. The increase in sales revenue was primarily due to higher sales prices combined with increases in sales volume. Higher sales volume in 2008 was primarily due to increased demand and commitments under our long-term pellet sales agreements, increased spot sales, and customer plant outages during the prior year. However, this increase was partially offset by declines in sales volumes to customers during the fourth quarter of 2008 as a result of the volatility and uncertainty in global markets, which led to production slowdowns in the steel industry. In addition, sales volume was negatively impacted throughout the year by adverse mining conditions and production delays at our North American Coal segment. Results for North American Coal in 2007 represent five months of operations since the July 31, 2007 acquisition.
Revenues in 2008 related to our North American Iron Ore segment increased approximately $624.2 million over 2007 primarily as a result of higher steel prices, renegotiated and new long-term supply agreements with certain customers, which were negotiated at world pellet prices, and other contractual price adjustment factors. In 2008, revenue also included $225.5 million related to the supplemental steel payments compared with $98.3 million in 2007. In addition, the Australian benchmark prices for lump and fines settled at increases of 97 percent and 80 percent in 2008, thereby resulting in higher revenues from our Asia Pacific Iron Ore segment compared with 2007.
Cost of Goods Sold
Cost of goods sold was $2.4 billion in 2008, an increase of $636.2 million, or 35 percent compared with 2007. The increase in cost of goods sold in 2008 was primarily due to the fact that results for North American Coal in 2007 only represented five months of operations since the July 31, 2007 acquisition. In addition, the increase in cost of goods sold in 2008 was attributable to higher costs of production, higher royalty fees related to increases in pellet pricing, and increased maintenance costs associated with the Michigan expansion project and major furnace repairs at Empire and United Taconite during the first quarter of 2008. In 2008, we continued to be challenged with adverse geological conditions across the mines at our North American Coal segment and delays in delivery of new capital equipment, which contributed to overall equipment performance and availability issues, thereby resulting in production delays and increased costs in all operations. Costs were also negatively impacted in 2008 by approximately $1.6 million related to unfavorable foreign exchange rates as well as higher fuel and energy costs primarily related to our North American and Asia Pacific iron ore operations, which together increased $42.5 million compared with 2007. In addition, the impact of the United Taconite and Asia Pacific Iron Ore step acquisitions also contributed to the increase in 2008.
Other Operating Income (Expense)
Following is a summary of other operating income (expense) for 2008 and 2007:
| (In Millions) | ||||||||||||
| 2008 | 2007 | Variance Favorable/ (Unfavorable) |
||||||||||
| Royalties and management fee revenue |
$ | 21.7 | $ | 14.5 | $ | 7.2 | ||||||
| Selling, general and administrative expenses |
(188.6 | ) | (114.2 | ) | (74.4 | ) | ||||||
| Terminated acquisition costs |
(90.1 | ) | — | (90.1 | ) | |||||||
| Gain on sale of other assets — net |
22.8 | 18.4 | 4.4 | |||||||||
| Casualty recoveries |
10.5 | 3.2 | 7.3 | |||||||||
| Miscellaneous — net |
2.9 | (2.3 | ) | 5.2 | ||||||||
| $ | (220.8 | ) | $ | (80.4 | ) | $ | (140.4 | ) | ||||
The increase in selling, general and administrative expense of $74.4 million in 2008 compared with 2007 is primarily a result of $20.2 million in higher share-based and incentive compensation, and higher wages and benefits related to an increase in the number of employees. We also incurred approximately $2.2 million in
52
corporate severance costs during the fourth quarter of 2008. Outside professional service and legal fees associated with the expansion of our business increased approximately $15.1 million in 2008. Expenses at our Asia Pacific Iron Ore segment were $5.7 million higher than 2007, reflecting higher employment costs and outside professional services to support business development and improvement efforts. Selling, general and administrative expense in 2008 was also impacted by additional corporate development activities in Latin America, Asia Pacific, and other general business development, resulting in an increase of approximately $13.0 million. In addition, 2008 includes a full year of selling, general and administrative expenses from our North American Coal segment, compared with five months in 2007 based on a July 31, 2007 date of acquisition, resulting in an increase of $5.1 million. Selling, general and administrative expense in 2008 was also impacted by a charge in the first quarter of approximately $6.8 million in connection with a legal case as well as $4.3 million related to our interest in Sonoma acquired in 2007.
On November 17, 2008, we announced the termination of the definitive merger agreement with Alpha Natural Resources, Inc., under which we would have acquired all outstanding shares of Alpha. Both our Board of Directors and Alpha’s Board of Directors made the decision after considering various issues, including the macroeconomic environment, uncertainty in the steel industry, shareholder dynamics, and the risks and costs of potential litigation. Considering these issues, each board determined that termination of the merger agreement was in the best interest of its equity holders. Under the terms of the settlement agreement, we were required to pay Alpha a $70 million termination fee, which was financed through our revolving credit facility and paid in November 2008. As a result, $90.1 million in termination fees and associated acquisition costs were expensed in the fourth quarter of 2008 upon termination of the definitive merger agreement.
The gain on sale of other assets of $22.8 million in 2008 primarily relates to the sale of our wholly-owned subsidiary, Synfuel, which was completed on June 4, 2008. Under the agreement, Oil Shale Exploration Company-Skyline, LLC acquired 100 percent of Synfuel for $24 million. As additional consideration for the stock, a perpetual nonparticipating royalty interest was granted initially equal to $0.02 per barrel of shale oil and $0.01 per barrel of shale oil produced from lands covered by existing State of Utah oil shale leases, plus 25 percent of royalty payments from conventional oil and gas operations. We recorded a gain of $19 million in the second quarter of 2008 upon completion of the transaction. The gain on sale of assets in 2007 of $18.4 million primarily reflected the fourth quarter 2007 gain on the sale of portions of the former LTVSMC site. The sale included cash proceeds of approximately $18 million.
The increase in casualty recoveries in 2008 compared with 2007 is primarily attributable to a $9.2 million insurance recovery recognized in the current year related to a 2006 electrical explosion at our United Taconite facility.
Other income (expense)
Following is a summary of other income (expense) for 2008 and 2007:
| (In Millions) | ||||||||||||
| 2008 | 2007 | Variance Favorable/ (Unfavorable) |
||||||||||
| Changes in fair value of foreign currency contracts, net |
$ | (188.2 | ) | $ | — | $ | (188.2 | ) | ||||
| Interest income |
26.2 | 20.0 | 6.2 | |||||||||
| Interest expense |
(39.8 | ) | (22.6 | ) | (17.2 | ) | ||||||
| Impairment of securities |
(25.1 | ) | — | (25.1 | ) | |||||||
| Other non-operating income |
4.3 | 1.7 | 2.6 | |||||||||
| $ | (222.6 | ) | $ | (0.9 | ) | $ | (221.7 | ) | ||||
The impact of changes in the fair value of our foreign currency contracts on the Statement of Consolidated Operations in 2008 is due to fluctuations in foreign currency exchange rates during the year. We are required to record the market value of our open derivative positions on our Statements of Consolidated Financial Position. Previously, when the derivative instruments were designated as cash flow hedges, the mark-to-market
53
adjustments related to the effective portions of the hedges were recorded as a component of Other comprehensive income. Upon de-designation of the cash flow hedges, effective July 1, 2008, the instruments are prospectively marked to fair value, and the adjustments resulting from changes in the market value of these derivative instruments are recorded as an unrealized gain or loss each reporting period. The following table represents our foreign currency derivative contract position as of December 31, 2008:
| ($ in Millions) | |||||||||||
| Contract Maturity |
Notional Amount | Weighted Average Exchange Rate |
Spot Rate | Fair Value | |||||||
| Contract Portfolio (excluding AUD Call Options) (1) : |
|||||||||||
| Contracts expiring in the next 12 months |
$ | 537.0 | 0.81 | 0.69 | $ | (77.5 | ) | ||||
| Contracts expiring in the next 13 to 24 months |
202.5 | 0.74 | 0.69 | (25.5 | ) | ||||||
| Contracts expiring in the next 25 to 36 months |
55.0 | 0.77 | 0.69 | (8.8 | ) | ||||||
| Total |
$ | 794.5 | 0.79 | 0.69 | $ | (111.8 | ) | ||||
| AUD Call Options (2) |
|||||||||||
| Contracts expiring in the next 12 months |
$ | 33.0 | 0.87 | 0.69 | $ | 0.3 | |||||
| Contracts expiring in the next 13 to 24 months |
41.5 | 0.90 | 0.69 | 0.6 | |||||||
| Contracts expiring in the next 25 to 36 months |
— | — | — | — | |||||||
| Total |
$ | 74.5 | 0.88 | 0.69 | $ | 0.9 | |||||
| Total Hedge Contract Portfolio |
$ | 869.0 | $ | (110.9 | ) | ||||||
| (1) | Includes collar options, convertible collar options and forward exchange contracts. |
| (2) | AUD call options are excluded from the weighted average exchange rate used for the remainder of the contract portfolio due to the unlimited downside participation associated with these instruments. |
The significant unrealized mark-to-market fluctuations are related to the Australian to U.S. dollar spot rate of A$0.69 as of December 31, 2008, which significantly decreased from the Australian to U.S. dollar spot rate of A$0.96 as of June 30, 2008 upon de-designation of the hedges. The changes in the spot rates are correlated to the depreciation of the Australian dollar relative to the United States dollar during the period. In addition, the amount of outstanding contracts in our foreign exchange hedge book significantly increased from $559.2 million at June 30, 2008 to approximately $869.0 million as of December 31, 2008, primarily as a result of higher sales prices in 2008 partially offset by the expiration of contracts upon maturity.
In 2008, we recorded impairment charges of $25.1 million related to declines in the fair value of our available-for-sale securities which we concluded were other than temporary. As of December 31, 2008, our investments in PolyMet and Golden West had fair values totaling $6.2 million and $4.7 million, respectively, compared with a cost of $14.2 million and $21.8 million, respectively. The metals and mining industry and our investees are susceptible to changes in the U.S. and global economies and the industries of their customers. Their principal customers are part of the global steel industry, and their businesses had been adversely affected by the slowdown of the global economy, particularly during the last quarter of 2008 when our investments became impaired. The severity of the impairments in relation to the carrying amounts of the individual investments was consistent with the macroeconomic market and industry developments. However, we had evaluated the near-term prospects of the issuers in relation to the severity and rapid decline in the fair value of each of these investments, and based upon that evaluation, we could not reasonably assert that the impairment period would be temporary primarily as a result of the global economic crisis and the corresponding uncertainties in the market at the end of 2008.
The increase in interest income in 2008 compared with 2007 is attributable to additional cash and investments held by our Asia Pacific Iron Ore segment during 2008 coupled with higher overall average returns. However, investment returns were lower in the fourth quarter of 2008 as a result of market declines. Higher interest expense in 2008 reflected increased borrowings under our senior notes and interest accretion for the deferred payment related to the PinnOak acquisition.
54
Income Taxes
Our tax rate is affected by recurring items, such as depletion and tax rates in foreign jurisdictions and the relative amount of income we earn in our various jurisdictions. It is also affected by discrete items that may occur in any given year, but are not consistent from year to year. The following represents a summary of our tax provision and corresponding effective rates for the years ended December 31, 2008 and 2007:
| (In Millions) | ||||||||
| 2008 | 2007 | |||||||
| Income tax expense |
$ | 144.2 | $ | 84.1 | ||||
| Effective tax rate |
20.1 | % | 22.1 | % | ||||
Our tax provision for the year ended December 31, 2008 and 2007 was $144.2 million and $84.1 million, respectively. The increase was primarily attributable to higher pre-tax book income partially offset by a decrease in our effective tax rate. Our effective tax rate for the year ended December 31, 2008 and 2007 was 20.1 percent and 22.1 percent, respectively. The 2.0 percent decrease is primarily attributable to increased percentage depletion and release of the valuation allowance related to foreign net operating losses.
A reconciliation of the statutory tax rate to the effective tax rate for the years ended December 31, 2008 and 2007 is as follows:
| 2008 | 2007 | |||||
| U.S. statutory rate |
35.0 | % | 35.0 | % | ||
| Increases/(Decreases) due to: |
||||||
| Percentage depletion |
(11.9 | ) | (12.3 | ) | ||
| Impact of foreign operations |
(2.1 | ) | (1.9 | ) | ||
| Valuation allowance |
1.6 | 3.4 | ||||
| Other items — net |
(0.6 | ) | (2.3 | ) | ||
| Effective income tax rate before discrete items |
22.0 | 21.9 | ||||
| Discrete items |
(1.9 | ) | 0.2 | |||
| Effective income tax rate |
20.1 | % | 22.1 | % | ||
Equity Loss in Ventures
The equity loss in ventures for the year ended December 31, 2008 of $35.1 million primarily represents our share of the operating results of our equity method investment in Amapá. Such results mainly consist of start-up and operating losses of $45.6 million, which includes operating losses from Amapá’s railroad of $5.8 million. The loss was partially offset by foreign currency hedge gains of $10.5 million. This compares with a loss of $11.2 million in 2007, comprised of $7.2 million in pre-production costs and $4.0 million of operating losses from the railroad. The negative operating results in 2008 were mainly due to slower than anticipated ramp-up of operations and product yields.
Noncontrolling Interest
Noncontrolling interest in consolidated income increased $5.6 million, or 36 percent, for the year ended December 31, 2008. The increase was primarily driven by a corresponding increase in the operating results of Asia Pacific Iron Ore (formerly known as Portman Limited), a consolidated subsidiary in which we owned approximately 80.4 percent in 2007 and throughout the first half of 2008. In June 2008, we acquired an additional 4.8 percent interest in Asia Pacific Iron Ore through a share repurchase program offered by Portman. We subsequently made an off-market offer to purchase the outstanding shares and proceeded with a compulsory acquisition of the remaining shares to obtain full ownership of Asia Pacific Iron Ore in the fourth quarter of 2008. The transaction constituted a step acquisition of a noncontrolling interest, thereby reducing noncontrolling interest in consolidated income on a prospective basis. We accounted for the acquisition of the noncontrolling interest by the purchase method. As a result of the step acquisition, the then historical cost basis of the noncontrolling interest balance was reduced to the extent of the percentage interest sold, and the increased ownership obtained was accounted for by increasing the entity’s basis from historical cost to fair value for the portion of the assets acquired and liabilities assumed based on the additional ownership acquired.
55
Results of Operations — Segment Information
Our company is organized and managed according to product category and geographic location. Segment information reflects our strategic business units, which are organized to meet customer requirements and global competition. We evaluate segment performance based on sales margin, defined as revenues less cost of goods sold identifiable to each segment. This measure of operating performance is an effective measurement as we focus on reducing production costs throughout the Company.
2009 Compared to 2008
North American Iron Ore
Following is a summary of North American Iron Ore results for 2009 and 2008:
| (In Millions) | ||||||||||||||||||||||||||||
| Change due to | ||||||||||||||||||||||||||||
| 2009 | 2008 | Sales price and rate |
Sales volume |
Idle cost/ Production volume variance |
Freight and reimbursements |
Total change |
||||||||||||||||||||||
| Revenues from product sales and services |
$ | 1,447.8 | $ | 2,369.6 | $ | (165.5 | ) | $ | (580.7 | ) | $ | — | $ | (175.6 | ) | $ | (921.8 | ) | ||||||||||
| Cost of goods sold and operating expense |
(1,172.3 | ) | (1,565.3 | ) | (22.0 | ) | 358.3 | (118.9 | ) | 175.6 | 393.0 | |||||||||||||||||
| Sales margin |
$ | 275.5 | $ | 804.3 | $ | (187.5 | ) | $ | (222.4 | ) | $ | (118.9 | ) | $ | — | $ | (528.8 | ) | ||||||||||
| Sales tons |
16.4 | 22.7 | ||||||||||||||||||||||||||
Revenue in 2009 decreased $921.8 million, or 39 percent compared with 2008 primarily as a result of a 28 percent decline in sales volume, which contributed $580.7 million to the overall decrease in revenue. The decline in sales volume is a result of the economic downturn and its impact on the global steel industry, which led to a decline in demand for steel-making products in North America during 2009. In addition to the year-over-year decline in sales volume, reported price settlements for iron ore pellets reflected a decrease of approximately 48 percent below 2008 prices, compared with an increase of 87 percent in the prior year. As a result, base rate adjustments related to estimated reductions in World Pellet Pricing and producer price indices have contributed to a $165.5 million decline in revenues in 2009. Revenue in the current year included approximately $22.2 million related to supplemental contract payments compared with $225.5 million in 2008. The decrease between periods relates to the estimated decline in average annual hot band steel pricing for one of our North American Iron Ore customers.
In August 2009, an arbitration demand was filed against us by one of our customers relating to a pellet price reopener provision in one of our supply contracts. The customer claims that it is entitled to request a price renegotiation even though it did not provide written notice before the deadline specified in the supply agreement and did not show that the triggering event had occurred. Should the arbitration panel determine that the customer is permitted to request a price renegotiation, the two sides have 60 days following notice per the supply agreement to negotiate revised pricing. In the event these negotiations are unsuccessful, further arbitration would be utilized to determine the revised applicable price under the supply agreement. The price determined by the arbitrator would be effective retroactive to the beginning of 2009. In the event this matter goes to supplementary arbitration to determine the revised price under the supply agreement, and we are unsuccessful in defending our position, the retroactive revised pricing for 2009 sales under the supply agreement would have a material impact on our consolidated operating results. Refer to Part I — Item 3, Legal Proceedings, for additional information.
In 2009 and 2008, certain customers purchased and paid for approximately 0.9 million tons and 1.2 million tons of pellets, respectively, in order to meet minimum contractual purchase requirements for each year under the terms of take-or-pay contracts. The inventory was stored at our facilities in upper lakes stockpiles. At the request of the customers, the ore was not shipped, resulting in deferred revenue at December 31, 2009 and 2008 of $81.9 million and $82.9 million, respectively. As of December 31, 2009, all of the 1.2 million tons that were deferred at the end of 2008 were delivered, resulting in the related revenue being recognized in 2009. Furthermore, the
56
supply agreement with one of our customers requires the customer to pay for any tons remaining under its 2009 nomination in addition to certain stockpile payments by December 31, 2009. There were approximately 1.7 million unshipped tons remaining under the customer’s 2009 nomination and 0.8 million tons related to December 2009 shipments, for which payment of $147.5 million was due on December 31, 2009 per the terms of the contract. The customer did not remit payment of this amount until January 4, 2010. As a result, such amounts are not reflected in our 2009 consolidated financial statements.
Cost of goods sold and operating expense in 2009 decreased $393.0 million or 25 percent from the prior year primarily due to lower sales volume, which resulted in cost reductions of approximately $358.3 million. The overall decrease was partially offset by idle expense of $118.9 million related to production curtailments at nearly all of the North American Iron Ore mines during 2009 in order to balance production with anticipated sales demand. In addition, cost of goods sold and operating expenses were unfavorably impacted in 2009 by approximately $22 million due to higher cost rates. The increase was primarily attributable to $43 million of higher labor costs related to the new labor agreement entered into in September 2008 at our iron ore facilities as well as higher fringe rates combined with an increase of $22 million related to higher energy costs. This was partially offset by a $25 million reduction in fuel costs, a decrease in royalty costs of $18 million as a result of lower iron ore pellet pricing, and cost reductions of $11 million related to ongoing cash conservation efforts during the current year. In addition, due to lower partner demand, Cliffs acquired 1.6 million tons produced at Tilden and Wabush from the mine partners’ share at variable cost, which resulted in a favorable cost impact of approximately $79 million in 2009.
Production
Following is a summary of iron ore production tonnage for 2009 and 2008:
| (In Millions) (1) | |||||||||
| Company Share | Total | ||||||||
| Mine |
2009 | 2008 | 2009 | 2008 | |||||
| Empire |
2.0 | 3.6 | 2.6 | 4.6 | |||||
| Tilden |
5.6 | 6.5 | 5.6 | 7.6 | |||||
| Hibbing |
0.4 | 1.9 | 1.7 | 8.2 | |||||
| Northshore |
3.2 | 5.5 | 3.2 | 5.5 | |||||
| United Taconite |
3.8 | 4.3 | 3.8 | 5.1 | |||||
| Wabush |
2.1 | 1.1 | 2.7 | 4.2 | |||||
| Total |
17.1 | (2) | 22.9 | 19.6 | 35.2 | ||||
| (1) | Long tons of pellets (2,240 pounds). |
| (2) | Includes 1.6 million tons allocated to Cliffs due to re-nominations by Cliffs’ partners at Tilden and Wabush. |
In response to the economic downturn, we continue to rationalize production to match customer demand. In 2009, we reduced production at our six North American Iron Ore mines to 17.1 million equity tons compared with 2008 production of 22.9 million equity tons.
Based on signs of marked improvements in customer demand beginning in the second half of 2009, we have increased production at most of our facilities and have called employees back to work in order to ensure we are positioned to meet increases in demand. During the fourth quarter of 2009, Tilden and United Taconite began operating at full capacity. Northshore was operating its two large furnaces, and Empire continued to maintain its current production levels. Wabush was operating two of its three furnaces with Cliffs taking essentially all of the tonnage. Only Hibbing continues to be fully curtailed and is expected to remain idled until the second quarter of 2010.
Based on current market uncertainties and corresponding blast furnace capacity utilization in North America, we continue to monitor the marketplace closely and will adjust our production plans for 2010 accordingly to meet customer demand.
57
North American Coal
Following is a summary of North American Coal results for 2009 and 2008:
| (In Millions, except tonnage) | ||||||||||||||||||||||||||||
| Change due to | ||||||||||||||||||||||||||||
| 2009 | 2008 | Sales price and rate |
Sales volume |
Idle cost/ Production volume variance |
Freight and reimbursements |
Total change |
||||||||||||||||||||||
| Revenues from product sales and services |
$ | 207.2 | $ | 346.3 | $ | 0.9 | $ | (127.1 | ) | $ | — | $ | (12.9 | ) | $ | (139.1 | ) | |||||||||||
| Cost of goods sold and operating expense |
(279.1 | ) | (392.7 | ) | (5.3 | ) | 146.7 | (40.7 | ) | 12.9 | 113.6 | |||||||||||||||||
| Sales margin |
$ | (71.9 | ) | $ | (46.4 | ) | $ | (4.4 | ) | $ | 19.6 | $ | (40.7 | ) | $ | — | $ | (25.5 | ) | |||||||||
| Sales tons (in thousands) |
1,874 | 3,241 | ||||||||||||||||||||||||||
We reported sales margin losses of $71.9 million and $46.4 million for the years ended December 31, 2009 and 2008, respectively. Revenue of $207.2 million in 2009 was 40 percent lower than the prior year. The decrease in revenue is primarily attributable to a 42 percent decline in sales volume as a result of market conditions which have adversely impacted the demand for steel-making raw materials throughout the current year.
Cost of goods sold and operating expense in 2009 decreased $113.6 million or 29 percent from the prior year primarily due to lower sales volume, which resulted in cost reductions of approximately $146.7 million. The decrease in current year sales volume also resulted in a decline in freight costs of $12.9 million and a reduction in royalty costs of $7.5 million. In addition, in response to the economic downturn, we decreased spending across the North American Coal business segment and idled production at both the Oak Grove and Pinnacle complexes during 2009. Production curtailments and headcount reductions during the current year have resulted in lower production-related costs, including maintenance, supplies, and labor costs. Headcount reductions resulted in labor and benefit cost reductions of $32.2 million in 2009. Spending on operating supplies and maintenance costs was reduced in 2009 by approximately $26.1 million as we continued to focus on cash conservation and cost management strategies. However, these cost reductions were more than offset by higher cost per ton rates in 2009, due to the impact of lower volume, resulting in an overall unfavorable rate variance of $5.3 million. Cost of goods sold and operating expenses in 2009 were also negatively impacted by an increase in idle expense and production volume variance of $40.7 million related to production curtailments at both mine locations during the year and delays associated with development of longwall panels at Oak Grove in early 2009.
Production
Following is a summary of coal production tonnage for 2009 and 2008:
| (In Thousands) (1) | ||||
| 2009 | 2008 | |||
| Mine: |
||||
| Pinnacle Complex |
864 | 2,489 | ||
| Oak Grove |
877 | 979 | ||
| Total |
1,741 | 3,468 | ||
| (1) | Tons are short tons (2,000 pounds). |
Metallurgical coal demand has been reduced in the current year as the steel industry has cut back production in response to the global economic slowdown. As a result, we initiated plans in 2009 to align production with customer demand. In West Virginia, production was idled at our Green Ridge mines for part of the year, and production at our Pinnacle mine was temporarily suspended. In Alabama, operating levels were also reduced at our Oak Grove mine. However, production levels began to increase at the end of 2009 due to improvements in
58
market conditions and increases in customer demand. In particular, during the fourth quarter, production increased at Oak Grove and development was also accelerated to avoid downtime in 2010. At Pinnacle, the longwall move was completed and we resumed production in mid-October. These production adjustments at North American Coal resulted in a 2009 annual operating rate of approximately 1.7 million tons. This compares with 2008 production of 3.5 million tons.
The Oak Grove mine was recently idled due to ventilation, water and roofing issues at the mine. MSHA denied our request to continue limited production while we addressed these issues. Oak Grove continued to operate a continuous miner section to develop future longwall panels. MSHA approval was finally received on February 9, 2010 for longwall operations to resume.
Asia Pacific Iron Ore
Following is a summary of Asia Pacific Iron Ore results for 2009 and 2008:
| (In Millions) | ||||||||||||||||||||||||
| Change due to | ||||||||||||||||||||||||
| 2009 | 2008 | Sales price and rate |
Sales volume |
Other | Total change |
|||||||||||||||||||
| Revenues from product sales and services |
$ | 542.1 | $ | 769.8 | $ | (257.5 | ) | $ | 72.5 | $ | (42.7 | ) | $ | (227.7 | ) | |||||||||
| Cost of goods sold and operating expense |
(454.9 | ) | (421.2 | ) | 1.8 | (33.8 | ) | (1.7 | ) | (33.7 | ) | |||||||||||||
| Sales margin |
$ | 87.2 | $ | 348.6 | $ | (255.7 | ) | $ | 38.7 | $ | (44.4 | ) | $ | (261.4 | ) | |||||||||
| Sales tonnes |
8.5 | 7.8 | ||||||||||||||||||||||
Sales margin for Asia Pacific Iron Ore declined to $87.2 million in 2009 compared with $348.6 million in 2008. Revenue decreased 30 percent in the current year primarily as a result of lower pricing for lump and fines in 2009 compared with 2008 prices. While the 2009 benchmark prices for iron ore lump and fines did not settle with all of our customers, we negotiated pricing arrangements with certain customers in China to reflect the decline in steel demand and prices. Pricing decreases in the current year of 44 percent and 33 percent for lump and fines, respectively, contrast with settled price increases in 2008 of 97 percent and 80 percent, respectively. Pricing in 2009 was based upon previously reported settlements in Japan and worldwide pressures in the market and remained unchanged from the estimates we made throughout most of 2009. The overall decline in current year revenue was partially offset by a favorable variance of $72.5 million due to a 9 percent increase in sales volume as a result of increased demand as well as a positive sales mix variance of $34.1 million due to more sales of lump and fines at higher prices and reduced sales of low-grade fines.
Cost of goods sold and operating expenses in 2009 were relatively consistent with 2008. Costs were unfavorably impacted by approximately $38.8 million of amortization expense related to the accounting for the acquisition of the remaining ownership interest in Asia Pacific Iron Ore which occurred during the second half of 2008. Costs in 2009 also increased by approximately $29.6 million due to higher sales volumes as well as higher shipping costs of $5.3 million due to freight arrangements with customers to secure sales during the current year. Increases in costs during 2009 were partially offset by favorable foreign exchange variances of $35.2 million.
Production
Following is a summary of iron ore production tonnage for 2009 and 2008:
| (In Millions) (1) | ||||
| 2009 | 2008 | |||
| Mine: |
||||
| Koolyanobbing |
8.3 | 7.3 | ||
| Cockatoo Island |
— | 0.4 | ||
| Total |
8.3 | 7.7 | ||
| (1) | Tonnes are metric tons (2,205 pounds). Cockatoo production reflects our 50 percent share. |
59
Production at Asia Pacific Iron Ore in 2009 was higher than 2008 as a result of increased demand and initiatives taken during the year to improve supply conditions and eliminate certain production and logistics constraints, including rail upgrades and stockpile utilization. Increases in production in 2009 were partially offset by the end of production at Cockatoo during 2008. Production is not expected to resume until the first half of 2011 once the seawall is completed.
2008 Compared to 2007
North American Iron Ore
Following is a summary of North American Iron Ore results for 2008 and 2007:
| (In Millions) | ||||||||||||||||||||||||
| Change due to | ||||||||||||||||||||||||
| 2008 | 2007 | Sales price and rate |
Sales volume |
Freight and reimbursements |
Total change |
|||||||||||||||||||
| Revenues from product sales and services |
$ | 2,369.6 | $ | 1,745.4 | $ | 596.1 | $ | 34.4 | $ | (6.3 | ) | $ | 624.2 | |||||||||||
| Cost of goods sold and operating expense |
(1,565.3 | ) | (1,347.5 | ) | (199.0 | ) | (25.1 | ) | 6.3 | (217.8 | ) | |||||||||||||
| Sales margin |
$ | 804.3 | $ | 397.9 | $ | 397.1 | $ | 9.3 | $ | — | $ | 406.4 | ||||||||||||
| Sales tons |
22.7 | 22.3 | ||||||||||||||||||||||
The increase in sales revenue in 2008 was primarily due to higher sales prices combined with an increase in sales volume. Revenue per ton increased 33.3 percent in 2008 primarily as a result of higher steel prices, renegotiated and new long-term supply agreements with certain customers, which were negotiated at a time of higher world pellet prices, and other contractual price adjustment factors. In 2008, revenue included $225.5 million related to the supplemental steel payments compared with $98.3 million in 2007.
The comparison of sales volume between 2008 and 2007 shows a slight increase year over year. However, in 2007, certain of our customers purchased and paid for approximately 1.5 million tons of iron ore pellets in stockpiles at the end of the year in order to comply with the take-or-pay provisions of their existing long-term supply agreements. The customers requested via a fixed shipping schedule that we not ship the iron ore until the spring of 2008, when the Great Lakes waterways re-opened for shipping. We recognized revenue on the 1.5 million tons in 2007. The following represents a comparison of sales volume in 2008, 2007 and 2006 as if the impact of the stockpile sales were excluded from the period reported and instead recognized in the period shipped:
| (In Millions) | |||||||
| Actual Sales Tons Recognized |
Cash Received / Sales Tons Not Recognized |
Pro Forma Sales Tons | |||||
| 2006 |
20.3 | 1.2 | 21.5 | ||||
| 2007 |
22.3 | (1.2 | ) | 21.1 | |||
| 2008 |
22.7 | 1.2 | 23.9 | ||||
Absent the impact of the stockpile sales, the increase in sales volume in 2008 is primarily due to increased demand during the first three quarters of 2008, commitments under our long-term pellet sales agreements, and customer plant outages during 2007. However, this increase was partially offset by declines in sales volumes to customers during the fourth quarter of 2008 as a result of the volatility and uncertainty in global markets, which led to production curtailments in the steel industry.
The increase in 2008 revenue is also attributable to a $50.6 million favorable mark-to-market adjustment related to the unsold tons associated with our purchase of the remaining 30 percent interest in United Taconite.
The increase in cost of goods sold and operating expense in 2008 was primarily due to higher costs of production, higher royalty fees primarily related to the increases in pellet pricing, and increased maintenance
60
costs associated with the Michigan expansion project. Fuel and energy costs increased $28.4 million compared with 2007. In addition, the impact of the United Taconite step acquisition also contributed to the increase year over year.
Production
Following is a summary of iron ore production tonnage for 2008 and 2007:
| (In Millions) (1) | ||||||||
| Company Share | Total | |||||||
| Mine |
2008 | 2007 | 2008 | 2007 | ||||
| Empire |
3.6 | 3.9 | 4.6 | 4.9 | ||||
| Tilden |
6.5 | 6.1 | 7.6 | 7.2 | ||||
| Hibbing |
1.9 | 1.7 | 8.2 | 7.4 | ||||
| Northshore |
5.5 | 5.2 | 5.5 | 5.2 | ||||
| United Taconite |
4.3 | 3.7 | 5.1 | 5.3 | ||||
| Wabush |
1.1 | 1.2 | 4.2 | 4.6 | ||||
| Total |
22.9 | 21.8 | 35.2 | 34.6 | ||||
| (1) | Long tons of pellets (2,240 pounds). |
The decrease in production at Empire in 2008 compared with 2007 is primarily due to Empire processing Tilden ore to produce 0.4 million tons of pellets under a test period. The corresponding increase is reflected at Tilden, bringing total 2008 production to 7.6 million tons compared with 7.2 million tons in 2007.
The increase in Hibbing’s production in 2008 compared with 2007 was a result of the shutdown in late February 2007 due to severe weather conditions that caused significant buildup of ice in the basin supplying water to the processing facility. The full year production loss in 2007 totaled approximately 0.8 million tons (Company share 0.2 million tons).
The increase in production in 2008 at Northshore was due to reactivation of one of the furnaces at the end of March 2008. Accordingly, production at Northshore benefited from an incremental increase of approximately 0.6 million tons in 2008. This increase was partially offset by production curtailments totaling 0.3 million tons in the fourth quarter of 2008 from idling pellet furnaces in response to production slowdowns in the steel industry.
The increase in our share of production at United Taconite is primarily related to the acquisition of the remaining 30 percent interest in July 2008. United Taconite’s 2008 production was reduced by 0.2 million tons in the fourth quarter from idling a pellet furnace in response to production slowdowns in the steel industry.
In December 2008, we executed plans to reduce production at our six North American iron ore mines. In order to implement the lower production levels, we temporarily idled various pellet furnaces and initiated workforce adjustments at each of our North American Iron Ore mines.
North American Coal
Following is a summary of North American Coal results for 2008 and 2007:
| (In Millions, except tonnage) | ||||||||||||||||||||||||
| Twelve Months | Five Months | Change due to | ||||||||||||||||||||||
| Ended December 31, | Sales price and rate |
Sales volume |
Freight and reimbursements |
Total change |
||||||||||||||||||||
| 2008 | 2007 | |||||||||||||||||||||||
| Revenues from product sales and services |
$ | 346.3 | $ | 85.2 | $ | 70.5 | $ | 147.9 | $ | 42.7 | $ | 261.1 | ||||||||||||
| Cost of goods sold and operating expense |
(392.7 | ) | (116.9 | ) | (29.3 | ) | (203.8 | ) | (42.7 | ) | (275.8 | ) | ||||||||||||
| Sales margin |
$ | (46.4 | ) | $ | (31.7 | ) | $ | 41.2 | $ | (55.9 | ) | $ | — | $ | (14.7 | ) | ||||||||
| Sales tons (in thousands) |
3,241 | 1,171 | ||||||||||||||||||||||
61
Results for 2007 represent five month totals since the July 31, 2007 acquisition.
We reported losses of $46.4 million and $31.7 million in sales margin for the years ended December 31, 2008 and 2007, respectively. Sales volume and costs in 2008 were negatively impacted by adverse mining conditions and production delays throughout the year. In addition, we declared force majeure on customer shipments from our Pinnacle mine in mid-March 2008. Production at the mine slowed as a result of encountering a fault area within the coal panel being mined at the time. The force majeure was lifted in mid-June 2008.
Despite completion of a longwall move in June 2008, our Oak Grove mine continued to experience delays and lower than planned production levels during the second half of 2008. The mine encountered lower than planned coal heights in the current mining panel and harsh geological conditions in the development areas. Additional costs have also been incurred for repairs and maintenance as a result of mechanical problems caused by adverse geological conditions, delays associated with equipment replacements and availability of experienced mining personnel. Oak Grove decreased production in the fourth quarter of 2008 to enable continuous miners to prepare longwall panels. One of our Green Ridge facilities, located in the Pinnacle Complex shut down production in an effort to focus on mining the remaining other Green Ridge location, resulting in lower overall production for the facility.
We continued to be challenged with adverse geological conditions across the mines and delays in delivery of new capital equipment, which contributed to overall equipment performance and availability issues, which increased costs in all operations in 2008.
Production
Following is a summary of coal production tonnage for 2008 and 2007:
| (In Thousands) (1) | ||||
| Twelve Months | Five Months | |||
| Ended December 31, | ||||
| 2008 | 2007 (2) | |||
| Mine: | ||||
| Pinnacle Complex |
2,489 | 685 | ||
| Oak Grove |
979 | 406 | ||
| Total |
3,468 | 1,091 | ||
| (1) | Tons are short tons (2,000 pounds). |
| (2) | Prior year results represent production since the July 31, 2007 acquisition. |
Production in 2008 was impacted by the extension of longwall development timing related to unplanned geological conditions, difficulty in obtaining additional equipment and personnel, and mechanical problems experienced within the second half of 2008 at our Oak Grove Mine. Also impacting production in 2008 were adverse mining conditions at our Pinnacle Complex. In addition, as a result of the economic downturn and its impact on the global steel industry, we initiated operating plans to reduce production and commence workforce adjustments at the Pinnacle Complex in December 2008.
Asia Pacific Iron Ore
Following is a summary of Asia Pacific Iron Ore results for 2008 and 2007:
| (In Millions) | ||||||||||||||||||||
| Change due to | ||||||||||||||||||||
| 2008 | 2007 | Sales price and rate |
Sales volume |
Total change |
||||||||||||||||
| Revenues from product sales and services |
$ | 769.8 | $ | 444.6 | $ | 343.9 | $ | (18.7 | ) | $ | 325.2 | |||||||||
| Cost of goods sold and operating expense |
(421.2 | ) | (348.8 | ) | (87.1 | ) | 14.7 | (72.4 | ) | |||||||||||
| Sales margin |
$ | 348.6 | $ | 95.8 | $ | 256.8 | $ | (4.0 | ) | $ | 252.8 | |||||||||
| Sales tons |
7.8 | 8.1 | ||||||||||||||||||
62
In 2008, the Australian benchmark prices for lump and fines settled at increases of 97 percent and 80 percent, respectively. As a result of the price settlement, sales from our Asia Pacific Iron Ore segment were recorded at the higher 2008 prices, thereby resulting in record revenues.
Cost of goods sold and operating expenses in 2008 increased primarily due to higher costs of production partially offset by lower volume and reduction of stockpiles. Increased costs of production were a result of higher fuel, maintenance and contract labor expenditures arising from inflationary pressures. Fuel and energy costs in 2008 increased approximately $14.1 million compared with 2007. Costs were also negatively impacted in 2008 by increased royalty payments due to higher revenues and approximately $1.6 million related to unfavorable foreign exchange rates. In addition, 2008 was impacted by the step acquisition of the remaining ownership interest in Asia Pacific Iron Ore.
Production
Following is a summary of iron ore production tonnage for 2008 and 2007:
| (In Millions) (1) | ||||
| Total | ||||
| 2008 | 2007 | |||
| Mine: |
||||
| Koolyanobbing |
7.3 | 7.7 | ||
| Cockatoo Island |
0.4 | 0.7 | ||
| Total |
7.7 | 8.4 | ||
| (1) | Tonnes are metric tons (2,205 pounds). Cockatoo production reflects our 50 percent share. |
The decrease in production in 2008 compared with 2007 was primarily due to inventory stockpile reductions in an effort to improve working capital. In addition, production at Cockatoo declined as the second stage of the seawall reserves were exhausted.
Liquidity, Cash Flows and Capital Resources
Our primary sources of liquidity are cash generated from our operating and financing activities. Our cash flows from operating activities are driven primarily by our operating results and changes in our working capital requirements. Our cash flows from financing activities are dependent upon our ability to access credit or other capital.
Throughout 2009, we have taken a balanced approach to allocation of our capital resources and free cash flow. We continued to focus on cash conservation and generation in our business operations as well as reduction of any discretionary capital expenditures in order to ensure we are positioned to face the challenges and uncertainties associated with the current economic environment.
63
The following is a summary of significant sources and uses of cash in 2009 and 2008:
| (In Millions) | ||||||||
| 2009 | 2008 | |||||||
| Cash and cash equivalents — January 1 |
$ | 179.0 | $ | 157.1 | ||||
| Significant Transactions |
||||||||
| Investment in ventures |
$ | (81.8 | ) | $ | (93.1 | ) | ||
| Rail upgrade in Asia Pacific |
(28.8 | ) | (11.7 | ) | ||||
| Payments for new longwall system at North American Coal |
— | (29.6 | ) | |||||
| Purchase of noncontrolling interest in Asia Pacific Iron Ore |
— | (485.1 | ) | |||||
| Purchase of noncontrolling interest in United Taconite |
— | (104.4 | ) | |||||
| Acquisition termination fees |
— | (70.0 | ) | |||||
| Michigan expansion project |
— | (47.7 | ) | |||||
| Other capital expenditures |
(87.5 | ) | (93.5 | ) | ||||
| Sale of assets |
28.3 | 41.2 | ||||||
| Dividend distributions (1) |
(31.9 | ) | (37.2 | ) | ||||
| Total |
(201.7 | ) | (931.1 | ) | ||||
| Sources of Financing |
||||||||
| Net cash provided by operating activities (2) |
185.7 | 923.2 | ||||||
| Proceeds from sale of common shares |
347.3 | — | ||||||
| Net borrowings under senior notes |
— | 325.0 | ||||||
| Net borrowings (repayments) under credit facility |
3.3 | (240.0 | ) | |||||
| Total |
536.3 | 1,008.2 | ||||||
| Other net activity |
(10.9 | ) | (55.2 | ) | ||||
| Cash and cash equivalents — December 31 |
$ | 502.7 | $ | 179.0 | ||||
| (1) | On May 12, 2009, our board of directors enacted a 55 percent reduction in our quarterly common share dividend to $0.04 from $0.0875 for the second and third quarters of 2009 in order to enhance financial flexibility. In the fourth quarter of 2009, the dividend was reinstated to its previous level. |
| (2) | Excludes $70 million of acquisition termination fees paid in 2008 related to the Alpha transaction. |
The following discussion summarizes the significant activities impacting our cash flows during the year as well as those expected to impact our future cash flows over the next 12 months. Refer to the Statements of Consolidated Cash Flows for additional information.
Operating Activities
Net cash provided by operating activities was $185.7 million in 2009, compared with $853.2 million in 2008 and $288.9 million in 2007. Operating cash flows in 2009 were impacted by lower operating results, as previously noted, and increases in working capital primarily at our North American Iron Ore business segment. Our operating cash flows vary with prices realized from iron ore and coal sales, production levels, production costs, cash payments for income taxes and interest, other working capital changes and other factors. As a result of weak economic conditions, operating plans were revised earlier in 2009 to curtail production, defer or eliminate capital projects and reduce costs.
We have responded to the uncertain near-term outlook and will continue to adjust our operating strategy as market conditions change. Beginning in the second half of 2009, capacity utilization among steelmaking facilities in North America demonstrated ongoing improvement, which continued through the remainder of 2009 and is expected to continue into 2010. The industry is showing signs of stabilization and recovery based on increasing steel production and the restarting of blast furnaces in North America and Europe. As a result, we have experienced marked improvements in customer demand and market expectations and have increased production at most of our facilities.
64
While we do not expect demand to return to the levels seen in 2008 for some time, we remain cautiously optimistic for a slow and progressive recovery. Based on current mine plans and subject to future iron ore and coal prices, we expect estimated operating cash flows in 2010 to be greater than our budgeted investments and capital expenditures, expected debt payments, dividends, and other cash requirements. Refer to “Outlook” for additional guidance regarding expected future results, including projections on pricing, sales volume and production for our various businesses.
Investing Activities
Net cash used by investing activities was $179.3 million in 2009, compared with $795.6 million and $745.4 million in 2008 and 2007, respectively. Capital expenditures were $116.3 million, $182.5 million and $199.5 million in 2009, 2008 and 2007, respectively. Investing activities in 2009 also included additional capital contributions of $70.2 million related to our investment in Amapá during the year. In addition, in January 2009, Asia Pacific Iron Ore sold a fleet of rail cars and subsequently leased them back for a period of 10 years. We received proceeds of $23.8 million from the sale of the rail cars, and the leaseback has been accounted for as a capital lease.
Aside from capital expenditures, significant investing activities in 2008 included $485.1 million for the acquisition of the remaining noncontrolling interest in our Asia Pacific Iron Ore segment and $104.4 million for the acquisition of the remaining 30 percent interest in United Taconite. In addition, we received proceeds of approximately $24 million from the sale of our wholly-owned subsidiary, Synfuel, in June 2008. Non-cash investing activities in 2008 included the issuance of $165 million of unregistered common shares and the commitment to provide 1.2 million tons of iron ore pellets as part of the consideration paid to acquire the remaining 30 percent interest in United Taconite. Non-cash investing activities during the prior year also included the issuance of four million of our common shares at a share price of $38.27 to the former owners of PinnOak to accelerate the deferred payment and settle the contingent earn-out associated with the initial purchase agreement. Investing activities in 2007 primarily included the purchase of PinnOak as well as our investments in Sonoma and Amapá.
The current volatility and uncertainty in global markets, coupled with the slowdown in the world’s major economies, has had a significant impact on commodity prices in 2009. In addition, the credit environment is expected to limit the funding and expansion capabilities of many mining companies. Based on these economic conditions, we continue to evaluate and assess our capital expenditures, in order to ensure we are positioned to face the challenges, uncertainties, as well as opportunities, associated with the current environment.
We anticipate that total cash used for investments and capital expenditures in 2010 will be approximately $250 million, including approximately $30 million related to the funding of our investment in Amapá. This amount does not include the additional investment to acquire the remaining interest in Wabush, which is approximately $88 million, subject to certain working capital adjustments. As we continue to increase production and look toward continued recovery in 2010, capital expenditures will include the construction of a new portal at Oak Grove to improve productivity and support growth and expansion of the mine. At Pinnacle, a new longwall plow system was purchased to reduce maintenance costs and increase production at the mine. Remaining expenditures for the new system of approximately $54 million will be made throughout 2010 and 2011. In addition, based on signs of improving demand for iron ore pellets, we continue to perform studies to determine whether to resume a previously announced expansion project at our Empire and Tilden mines in Michigan’s Upper Peninsula. Furthermore, in 2009 we implemented a global exploration program, which is integral to our growth strategy and is focused on identifying and capturing new world-class projects for future development or projects that add significant value to existing operations. We expect to spend between $25 million and $30 million on exploration and development activities in 2010, which will provide us with opportunities for significant future potential reserve additions globally.
We are evaluating funding options for our capital needs and expect to be able to fund these requirements through operations and availability under our borrowing arrangements. Other funding options may include new lines of credit or other financing arrangements.
65
The following represents our future cash commitments and contractual obligations as of December 31, 2009:
| Payments Due by Period (1) (In Millions) | |||||||||||||||
| Contractual Obligations |
Total | Less Than 1 Year |
1 - 3 Years |
3 - 5 Years |
More Than 5 Years | ||||||||||
| Long-term debt |
$ | 529.6 | $ | 4.6 | $ | 200.0 | $ | 270.0 | $ | 55.0 | |||||
| Interest on debt (2) |
94.2 | 25.8 | 50.8 | 15.8 | 1.8 | ||||||||||
| Operating lease obligations |
94.3 | 22.4 | 33.3 | 26.4 | 12.2 | ||||||||||
| Capital lease obligations |
183.2 | 24.3 | 47.2 | 43.7 | 68.0 | ||||||||||
| Purchase obligations: |
|||||||||||||||
| Asia Pacific rail upgrade |
8.8 | 8.8 | — | — | — | ||||||||||
| Longwall plow system |
54.0 | 40.0 | 14.0 | ||||||||||||
| Open purchase orders |
235.0 | 226.5 | 8.5 | — | — | ||||||||||
| Minimum “take or pay” purchase commitments (3) |
798.0 | 120.7 | 194.8 | 146.8 | 335.7 | ||||||||||
| Total purchase obligations |
1,095.8 | 396.0 | 217.3 | 146.8 | 335.7 | ||||||||||
| Other long-term liabilities: |
|||||||||||||||
| Pension funding minimums |
242.9 | 45.9 | 102.1 | 94.9 | — | ||||||||||
| OPEB claim payments |
134.5 | 35.2 | 53.0 | 46.3 | — | ||||||||||
| Deferred revenue |
105.1 | 94.8 | 10.3 | — | — | ||||||||||
| Environmental and mine closure obligations |
132.3 | 7.9 | 4.5 | 3.3 | 116.6 | ||||||||||
| FIN 48 obligations (4) |
21.2 | — | 17.9 | 3.3 | — | ||||||||||
| Personal injury |
23.3 | 4.1 | 8.2 | 2.9 | 8.1 | ||||||||||
| Other (5) |
|||||||||||||||
| Total other long-term liabilities |
659.3 | 187.9 | 196.0 | 150.7 | 124.7 | ||||||||||
| Total |
$ | 2,656.4 | $ | 661.0 | $ | 744.6 | $ | 653.4 | $ | 597.4 | |||||
| (1) | Includes our consolidated obligations. |
| (2) | Interest on the $200 million term debt is calculated using actual rates through April 2010 and is estimated using an average 2 and 3-year Libor swap rate of 1.74 percent plus a margin of 1.125 from April 2010 through maturity in August 2012. For the $325 million senior notes, interest is calculated for the $270 million five-year senior notes using a fixed rate of 6.31 percent from 2010 to maturity in June 2013, and for the $55 million seven-year senior notes, interest is calculated at 6.59 percent from 2010 to maturity in June 2015. |
| (3) | Includes minimum electric power demand charges, minimum coal, diesel and natural gas obligations, minimum railroad transportation obligations, and minimum port facility obligations. |
| (4) | Includes accrued interest. |
| (5) | Other contractual obligations of approximately $11.3 million primarily include income taxes payable and deferred income tax amounts for which timing of payment is non-determinable. |
Refer to NOTE 18 — COMMITMENTS AND CONTINGENCIES of the Consolidated Financial Statements for additional information regarding our future purchase commitments and obligations.
Financing Activities
Net cash provided by financing activities in 2009 was $304.3 million compared with $32.4 million in 2008 and $250.1 million in 2007. Cash flows from financing activities in 2009 primarily included $348 million in net proceeds from the sale of our common shares. Cash flows from financing activities in 2008 primarily included borrowings under our revolving credit facility and senior notes of $865 million, partially offset by debt repayments of $780 million and dividend distributions of $37.2 million. In 2007, financing activities included borrowings under our revolving credit facility of approximately $1.2 billion, partially offset by the repayment of $755.0 million under our credit facility and $159.6 million of PinnOak debt.
66
Throughout 2009 we have implemented proactive initiatives to enhance financial flexibility and strengthen liquidity, including a public offering of our common shares, a 55 percent reduction in our common share quarterly dividend to $0.04 from $0.0875 for the second and third quarters of 2009, and compensation reductions across the organization. These initiatives were taken in response to the high degree of uncertainty within our industry and the macroeconomic environment as well as to better position ourselves to take advantage of possible opportunities when the market improves.
Through the public offering of our common shares, which closed on May 19, 2009, we sold a total of 17.25 million shares out of treasury stock. Net proceeds at a price of $21.00 per share were approximately $348 million, which will be used for general corporate purposes, including, among other things, funding certain capital expenditures, repayment of indebtedness or other strategic transactions. In addition, the quarterly dividend and compensation reductions resulted in savings of approximately $22 million and $15 million, respectively, in 2009.
Capital Resources
We expect to fund our business obligations from available cash, current operations and borrowings under our credit facility. The following represents a summary of key liquidity measures as of December 31, 2009 and 2008:
| (In Millions) | ||||||||
| December 31, 2009 |
December 31, 2008 |
|||||||
| Cash and cash equivalents |
$ | 502.7 | $ | 179.0 | ||||
| Credit facility |
$ | 800.0 | $ | 800.0 | ||||
| Senior notes |
325.0 | 325.0 | ||||||
| Asia Pacific Iron Ore facilities |
— | 27.6 | ||||||
| Senior notes drawn |
(325.0 | ) | (325.0 | ) | ||||
| Term loans drawn |
(200.0 | ) | (200.0 | ) | ||||
| Letter of credit obligations and other commitments |
(31.4 | ) | (40.3 | ) | ||||
| Borrowing capacity available |
$ | 568.6 | $ | 587.3 | ||||
Refer to NOTE 9 — DEBT AND CREDIT FACILITIES of our consolidated financial statements for further information regarding our debt and credit facilities.
Apart from cash generated by the business, our primary source of funding is cash on hand, which totals $502.7 million as of December 31, 2009 based on successful execution of an equity offering in the second quarter of 2009. We also have a $600 million revolving credit facility, which matures in 2012. This facility has available borrowing capacity of $569 million as of December 31, 2009. Effective October 29, 2009, we amended our credit facility agreement, which resulted in improved borrowing flexibility, more liberally defined financial covenants and debt restrictions, and other benefits in exchange for a modest increase in pricing. The combination of cash and the credit facility give us over $1 billion in liquidity entering 2010.
As previously noted under Results of Operations — Segment Information, at the end of 2009, one of our North American Iron Ore customers did not pay $147.5 million that was due by December 31, 2009 under the terms of its supply agreement. Instead, the customer remitted payment of the full amount on January 4, 2010. As a result, this amount is not included in the $502.7 million of cash on hand at December 31, 2009.
We are party to financing arrangements under which we issue guarantees on behalf of certain of our unconsolidated subsidiaries. In the event of non-payment, we are obligated to make payment in accordance with the provisions of the guarantee arrangement. At December 31, 2009 and 2008, Amapá had total project debt outstanding of approximately $530 million and $493 million, respectively, for which we have provided a several guarantee on our 30 percent share. Amapá is currently in violation of certain operating and financial loan covenants contained in the debt agreements. However, Amapá and its lenders have agreed to waive these covenants through May 31, 2010 related to the remaining debt outstanding. If Amapá is unable to either
67
renegotiate the terms of the debt agreements or obtain further extension of the compliance waivers, violation of the operating and financial loan covenants may result in the lenders calling the debt, thereby requiring us to recognize and repay our share of the debt in accordance with the provisions of the guarantee arrangement.
Based on our current borrowing capacity and the actions we have taken in response to the global economic crisis to conserve cash, we have adequate liquidity and expect to fund our business obligations from available cash, current operations and borrowing under our current credit facilities. Other sources of funding may include new lines of credit or other financing arrangements.
Several credit markets may provide additional capacity should that become necessary. The bank market may provide funding through a term loan or through exercising the $200 million accordion in our credit facility. The risk associated with this market is significant increases in borrowing costs as a result of decreasing capacity. Capacity, as in all debt markets, is a global issue that impacts the private placement market. However, capacity in the bond market has rebounded for investment grade companies. Longer term debt arrangements at current corporate bond rates must be aligned with our longer term capital structure needs.
Off-Balance Sheet Arrangements
We have entered into certain agreements under which we have provided guarantees to an unconsolidated entity that are off-balance sheet arrangements. In addition, we have operating leases, which are primarily utilized for certain equipment and office space. Aside from this, we do not have any other off-balance sheet financing arrangements. Refer to NOTE 18 — COMMITMENTS AND CONTINGENCIES for additional information regarding our guarantees.
Market Risks
We are subject to a variety of risks, including those caused by changes in the market value of equity investments, changes in commodity prices, interest rates and foreign currency exchange rates. We have established policies and procedures to manage such risks; however, certain risks are beyond our control.
Foreign Currency Exchange Rate Risk
We are subject to changes in foreign currency exchange rates primarily as a result of our operations in Australia, which could impact our financial condition. Foreign exchange risk arises from our exposure to fluctuations in foreign currency exchange rates because our reporting currency is the United States dollar. Our Asia Pacific operations receive funds in United States currency for their iron ore and coal sales and incur costs in Australian currency. We use forward exchange contracts, call options, collar options and convertible collar options to hedge our foreign currency exposure for a portion of our sales receipts. The primary objective for the use of these instruments is to reduce exposure to changes in Australian and United States currency exchange rates and to protect against undue adverse movement in these exchange rates. At December 31, 2009, we had $108.5 million of outstanding exchange rate contracts with varying maturity dates ranging from January 2010 to October 2010. A 10 percent increase in the value of the Australian dollar from the month-end rate would increase the fair value by approximately $7.4 million, and a 10 percent decrease would reduce the fair value by approximately $5.6 million. We may enter into additional hedging instruments in the near future as needed in order to further hedge our exposure to changes in foreign currency exchange rates.
Our share of pellets produced at the Wabush operation in Canada represented approximately 12 percent of our North American Iron Ore pellet production in 2009. This operation is subject to currency exchange fluctuations between the United States and Canadian currency; however, we do not hedge our exposure to this currency exchange fluctuation.
Under the majority ownership of MMX, Amapá’s functional currency was previously determined to be the Brazilian real. The change in control of Amapá to Anglo in August 2008 resulted in the review of financial, operating and treasury policies of the entity under new management. This, along with efforts to mitigate exposures related to fluctuations in foreign currency exchange rates resulted in the reassessment of the accounting principles related to the determination of Amapá’s functional currency during the fourth quarter of
68
2008. As a result, effective October 1, 2008, the functional currency of Amapá was changed from the local currency to the U.S. dollar reporting currency primarily due to changes in the debt structure under which the entity is financed as well as changes in the treasury, risk mitigation and financial reporting policies under which the entity’s operations are managed, resulting in the U.S. dollar becoming the currency of the primary economic environment in which the business operates.
Interest Rate Risk
Interest for borrowings under our credit facility is at a floating rate, dependent in part on the LIBOR rate, which exposes us to the effects of interest rate changes. Based on $200 million in outstanding term loans at December 31, 2009, with a floating interest rate and no corresponding fixed rate swap, a 100 basis point change to the LIBOR rate would result in a change of $2.0 million to interest expense on an annual basis.
In October 2007, we entered into a $100 million fixed rate swap to convert a portion of this floating rate into a fixed rate. The interest rate swap terminated in October 2009. Based on the current interest rate environment and the mix of fixed and variable interest rates that apply to our outstanding debt, we have no plans at this time to replace the interest rate swap.
Pricing Risks
The current global economic crisis has resulted in increasing downward pressure from customers, particularly in China, for a roll back of the 2008 price increases for seaborne iron ore and metallurgical coal in 2009. The 2008 record price increase was driven by high demand for iron ore and coking coal, global steel production at historically high levels, combined with production and logistics constraints for both iron ore and coking coal, resulting in tight supply conditions. With the current global economic crisis, the market in some geographies, including North America, now is characterized by a reduction in steel demand with limited demand for iron ore and coking coal. Reduced demand for iron ore and coking coal has resulted in decreased demand for our products and decreasing prices, resulting in lower revenue levels in 2009 and decreasing margins as a result of decreased production, thereby adversely affecting our results of operations, financial condition and liquidity.
Certain supply agreements with one North American Iron Ore customer provide for supplemental revenue or refunds based on the customer’s average annual steel pricing at the time the product is consumed in the customer’s blast furnace. The supplemental pricing is characterized as an embedded derivative, which is finalized based on a future price, and is marked to fair value as a revenue adjustment each reporting period until the pellets are consumed and the amounts are settled. The fair value of the instrument is determined using an income approach based on an estimate of the annual realized price of hot rolled steel at the steelmaker’s facilities.
At December 31, 2009, we had a derivative asset of $63.2 million, representing the fair value of the pricing factors, based upon the amount of unconsumed tons and an estimated average hot band steel price related to the period in which the tons are expected to be consumed in the customer’s blast furnace at each respective steelmaking facility, subject to final pricing at a future date. This compares with a derivative asset of $76.6 million as of December 31, 2008, based upon the amount of unconsumed tons and the related estimated average hot band steel price. We estimate that a $25 change in the average hot band steel price realized from the December 31, 2009 estimated price recorded would cause the fair value of the derivative instrument to increase or decrease by approximately $13.7 million, thereby impacting our consolidated revenues by the same amount.
We have not entered into any hedging programs to mitigate the risk of adverse price fluctuations, nor do we intend to hedge our exposure to such risks in the future; however, certain of our term supply agreements contain price collars, which typically limit the percentage increase or decrease in prices for our products during any given year.
Nonperformance and Liquidity Risks
The current global economic crisis has adversely affected our business and could impact our financial results. All of our customers have announced curtailments of production, which has adversely affected the demand for our iron ore and coal products. Continuation or worsening of the current economic conditions, a
69
prolonged global, national or regional economic recession or other events that could produce major changes in demand patterns, could have a material adverse effect on our sales, margins, liquidity and profitability. We are not able to predict the impact the current global economic crisis will have on our operations and the industry in general going forward.
In addition, consolidations in some of the industries in which our customers operate have created larger customers, some of which are highly leveraged. These factors have caused some customers to be less profitable and increased our exposure to credit risk. A significant adverse change in the financial and/or credit position of a customer could require us to assume greater credit risk relating to that customer and could limit our ability to collect receivables. Failure to receive payment from our customers for products that we have delivered could adversely affect our results of operations, financial condition and liquidity.
Our investment policy relating to short-term investments is to preserve principal and liquidity while maximizing the short-term return through investment of available funds. The carrying value of these investments approximates fair value on the reporting dates. We commonly use AAA-rated money market funds for short-term investments. All money market funds in which we invest have maintained daily cash redemptions throughout 2009.
Volatile Energy and Fuel Costs
The volatile cost of energy and supplies is an important issue affecting our production costs, primarily in relation to our iron ore operations. Recent trends have shown that although electric power, natural gas, and oil costs are declining, the direction and magnitude of short-term changes are difficult to predict. Our consolidated North American Iron Ore mining ventures consumed approximately 8.4 million MMBtu’s of natural gas at an average delivered price of $6.63 per MMBtu, and 15.5 million gallons of diesel fuel at an average delivered price of $2.17 per gallon in 2009. Consumption of diesel fuel by our Asia Pacific Operations was approximately 13.3 million gallons for the same period.
Our strategy to address increasing energy rates includes improving efficiency in energy usage and utilizing the lowest cost alternative fuels. Through 2009, our North American Iron Ore mining ventures entered into forward contracts for certain commodities, primarily natural gas and diesel fuel, as a hedge against price volatility. Such contracts were in quantities expected to be delivered and used in the production process. As of December 31, 2009, all of our hedge contracts have matured. At the present time we have no specific plans to enter into further hedging activity for 2010 and beyond and do not plan to enter into any new forward contracts for natural gas or diesel fuel in the near term. We will continue to monitor relevant energy markets for risk mitigation opportunities and may make forward purchases or employ other hedging instruments in the future as warranted and deemed appropriate by management. Assuming we do not enter into further hedging activity in the near term, a 10 percent change in natural gas and diesel fuel prices would result in a change of approximately $13.8 million in our annual fuel and energy costs based on expected consumption in 2010.
Supply Concentration Risks
Many of our mines are dependent on one source for electric power and for natural gas. A significant interruption or change in service or rates from our energy suppliers could materially impact our production costs, margins and profitability. As an example, WEPCO, the sole supplier of electric power to our Tilden and Empire mines, has filed a rate case with the Michigan Public Utilities Commission requesting a 33 percent increase in rates from its rate payers, including our Empire and Tilden mines. If WEPCO is successful in effectuating the 33 percent rate increase currently being proposed, our estimated energy costs at Tilden and Empire in 2010 may be unfavorably impacted by approximately $29 million.
Uncertainties of Proposed Tax Reform Legislation
In 2010, significant proposed changes to U.S. income tax rules were announced as part of the Obama Administration’s 2011 budget proposals. The proposed changes that could have a significant impact include the deferral of certain U.S. income tax deductions related to foreign operations, repeal of LIFO inventory accounting,
70
and elimination of certain current tax incentives for the coal industry, such as percentage depletion. These changes, if enacted, may reduce the competitive position of many U.S. businesses across all industries. The impact of the proposed changes on our business operations and financial statements remains uncertain. However, as the possibility of enactment progresses, we will continue to monitor current developments and assess the potential implications of these tax law changes on our business.
Outlook
We expect continued stabilization of the macroeconomic environment throughout 2010 and corresponding improvements for steelmaking raw material demand. Annual price settlements for iron ore products in 2010 are not yet concluded. As such, we are using the following assumptions, based on an average of widely published industry analyst estimates, to provide expectations for our iron ore businesses, which use the settlement prices as factors in determining individual customer pricing. Any deviation from the following assumptions will impact average realized price:
| • | Increases of 40 percent for world blast furnace iron ore pellet price settlements; |
| • | Increases of 35 percent and 30 percent, respectively, for Australian lump and fines benchmark price settlements; and, |
| • | North America hard coking coal prices of $125 per short ton FOB mine |
Based on the above assumptions, the following table provides a summary of our 2010 guidance for our three reportable business segments, including further detail below:
| 2010 Outlook Summary | |||||||||||||||
| North American Iron Ore |
North American Coal | Asia Pacific Iron Ore | |||||||||||||
| Current Outlook |
Previous Outlook |
Current Outlook |
Previous Outlook |
Current Outlook |
Previous Outlook | ||||||||||
| Sales volume (million tons/tonnes) |
25.0 | 23.0 | 3.4 | 3.0 | 8.5 | 8.5 | |||||||||
| Revenue per ton/tonne |
$ | 90 - $95 | — | $ | 115 - $120 | — | $ | 80 - $85 | — | ||||||
| Cost per ton/tonne |
$ | 65 - $70 | — | $ | 105 - $110 | — | $ | 50 - $55 | — | ||||||
North American Iron Ore Outlook
For 2010, we are increasing our sales volume expectations to approximately 25 million tons, up from a previous expectation of 23 million tons due to improving demand from customers.
We used a number of widely published analyst estimates, which call for an average 40 percent increase in blast furnace pellet pricing settlements, in providing guidance on average revenue per ton in our North American Iron Ore business segment. Applying this assumption, along with a 2010 range for hot band steel pricing of $550 to $650 per ton and no inflation for any other factors contained in our current supply agreements, we expect revenue per ton in North American Iron Ore to be $90 to $95. This expectation also considers the contractual base price changes, lag year adjustments and pricing caps and floors contained in our North American Iron Ore supply agreements. Actual realized average revenue per ton will ultimately depend on sales volume levels and customer mix, blast furnace pellet price settlements, production input costs and/or steel prices, all of which are factors in the our formula based pricing for the North American Iron Ore business segment.
In addition, the following approximate sensitivities would impact our actual realized price:
| • | For every 10 percent change from the above average analyst expectation for blast furnace pellet price settlements, we would expect our average realized revenue per ton in North American Iron Ore to change by $4 to $5. |
| • | For every $25 change from the estimated 2010 hot rolled steel prices noted above, we would expect our average revenue per ton in North American Iron Ore to change by $0.40. |
71
We expect 2010 production of approximately 25 million tons in our North American Iron Ore business segment. At this level of production, 2010 cost per ton is expected to be between $65 and $70 and includes a $5 per ton benefit from increased volume, offset by increased costs related to the acquisition of Wabush, and increases in labor costs as well as maintenance spending that was deferred in 2009.
North American Coal Outlook
In our North American Coal business segment, we are increasing our sales volume expectations to approximately 3.4 million tons, up from a previous expectation of 3.0 million tons.
We begin 2010 with approximately 1.4 million tons of coal under contractual obligation, or approximately 40 percent of our current annual production guidance. This coal is priced at an average of $110 per ton, which includes production earmarks to fulfill obligations for 2009 international contracts ending March 31, 2010. Approximately 30 percent of our 2010 production volume is committed, but not yet priced, as benchmark pricing has not yet settled. We currently expect to sell the remaining 30 percent of uncommitted production on a spot basis throughout the year.
In 2010, we expect cost per ton for the year to be approximately $105 to $110, with approximately $14 per ton comprised of depreciation, depletion and amortization.
Asia Pacific Iron Ore Outlook
Asia Pacific Iron Ore 2010 sales volume is expected to be 8.5 million tonnes, with production of 8.6 million tonnes. With annual price settlements for iron ore in 2010 not yet concluded, as noted above, we used an average industry analyst estimated increase for Australian lump and fines benchmark price settlements of 35 percent and 30 percent, respectively, in providing guidance on average revenue per ton in our Asia Pacific Iron Ore business segment. With these estimates, we expect revenue per ton in Asia Pacific Iron Ore to be $80 to $85. We expect 2010 Asia Pacific Iron Ore costs per tonne of approximately $50 to $55.
Outlook for Sonoma and Amapá
We have a 45 percent economic interest in the Sonoma Coal. In 2010, we expect total production of approximately 3.3 million tonnes. Sonoma expects to have sales volume of 3.5 million tonnes with an approximate 65/35 mix between thermal and metallurgical coal respectively. We expect Sonoma average revenue per tonne to be $85 to $90 in 2010. Per-tonne costs at Sonoma are expected to be between $80 and $85.
We have a 30 percent interest in Amapá. In 2010, assuming a 30 percent increase in iron ore pricing settlements for iron ore concentrate products, we expect to report an equity loss between $10 million and $20 million for our share of Amapá’s results.
Selling, General and Administrative Expenses and Other Expectations
Selling, general and administrative expenses are anticipated to be approximately $130 million in 2010. As noted above, we intend to incur costs of approximately $25 to $30 million related to our global exploration efforts. We anticipate an effective tax rate of approximately 24 percent for the year and depreciation and amortization of approximately $275 million.
We recently completed our previously announced acquisition of Freewest and, under the terms of the acquisition agreement, issued approximately 4.2 million shares. As a result, we currently have total diluted shares outstanding of approximately 136 million.
2010 Capital Budget and Other Uses of Cash
Based on the above guidance, we expect to generate approximately $900 million in cash from operations in 2010. We expect capital expenditures of approximately $200 million, comprised of approximately $110 million in sustaining capital and approximately $90 million earmarked for expansion, including the following projects:
| • | $40 million related to installation of a new longwall mining system at the Pinnacle Mine in West Virginia, which is expected to be complete in the fourth quarter of 2010. |
72
| • | $15 million related to an upgrade of the Pinnacle Complex preparation plant, which is expected to be complete in the third quarter of 2011. |
| • | $20 million related to installing a new mine shaft closer to current mining areas at our Oak Grove mine, which is expected to be complete in the first quarter of 2011. |
Combined, the above projects are anticipated to enable future production from our North American Coal assets to ramp up to 5 million tons annually from an expectation of 3.4 million tons in 2010. Other expected uses of cash in 2010 include approximately:
| • | $90 million related to the acquisition of Cliffs’ partners’ 73.2 percent interest in Wabush. |
| • | $30 million related to our investment in Amapá, comprised of expected losses and capital spending. |
| • | $70 million related to the reduction of Cliffs’ debt obligation at Amapá. |
| • | $15 million related to renewaFUEL’s build out of its first commercial-scale production facility in Michigan. |
| • | $10 million related to Cliffs’ recently acquired chromite project in Ontario, Canada. |
Recently Issued Accounting Pronouncements
Refer to NOTE 1 — BUSINESS SUMMARY AND SIGNIFICANT ACCOUNTING POLICIES of the consolidated financial statements for a description of recent accounting pronouncements, including the respective dates of adoption and effects on results of operations and financial condition.
Critical Accounting Estimates
Management’s discussion and analysis of financial condition and results of operations is based on our consolidated financial statements, which have been prepared in accordance with GAAP. Preparation of financial statements requires management to make assumptions, estimates and judgments that affect the reported amounts of assets, liabilities, revenues, costs and expenses, and the related disclosures of contingencies. Management bases its estimates on various assumptions and historical experience, which are believed to be reasonable; however, due to the inherent nature of estimates, actual results may differ significantly due to changed conditions or assumptions. On a regular basis, management reviews the accounting policies, assumptions, estimates and judgments to ensure that our financial statements are fairly presented in accordance with GAAP. However, because future events and their effects cannot be determined with certainty, actual results could differ from our assumptions and estimates, and such differences could be material. Management believes that the following critical accounting estimates and judgments have a significant impact on our financial statements.
Revenue Recognition
North American Iron Ore Customer Supply Agreements
Most of our North American Iron Ore long-term supply agreements are comprised of a base price with annual price adjustment factors, some of which are subject to annual price collars in order to limit the percentage increase or decrease in prices for our iron ore pellets during any given year. The base price is the primary component of the purchase price for each contract. The inflation-indexed price adjustment factors are integral to the iron ore supply contracts and vary based on the agreement but typically include adjustments based upon changes in international pellet prices, changes in specified Producers Price Indices including those for all commodities, industrial commodities, energy and steel. The pricing adjustments generally operate in the same manner, with each factor typically comprising a portion of the price adjustment, although the weighting of each factor varies based upon the specific terms of each agreement. In most cases, these adjustment factors have not been finalized at the time our product is sold. In these cases, we estimate the adjustment factors at each reporting period based upon the best third-party information available and adjust the estimate to actual when the information has been finalized.
With respect to international pellet prices, certain long-term supply agreements reference the previous year’s settled price, in which case, no estimate is required. However, pricing in some of our supply agreements is based upon the international pellet price for the current year. The period during which we must estimate changes in
73
international pellet prices varies year to year based on the timing of final settlement. Historically, contract negotiations were completed and pricing settlements for the upcoming year were reached during the first quarter of the contract year, in which case an estimate was required only for a short period of time and was adjusted to actual prior to reporting first quarter results. This was the case in 2007. As a result, the price adjustment provisions related to international pellet prices were essentially a fixed component of the purchase price for that contract year based upon the timing of settlement. However, several instances have occurred in more recent years, including 2009 and 2008, in which contract negotiations have been extended with settlement occurring later in the year. Information used in developing the estimate prior to settlement includes such factors as previous pricing settlements among other iron ore producers and consumers in the industry, current spot prices, market trends, publications and other industry information. However, based on the timing of settlement, adjustments of our estimate to the actual international pellet price were not material in 2009 or 2008 as a result of having limited shipments to customers with these contract provisions during the first quarter of each respective year.
The producer price indices remain a provisional component of the sales price throughout the contract year and are estimated each quarter using publicly available forecasts of such indices. The final indices referenced in certain of the North American Iron Ore supply contracts are typically not published by the U.S. Department of Labor until the second quarter of the subsequent year. As a result, we record an adjustment for the difference between the fourth quarter estimate and the final price in the following year. Historically, such adjustments have not been material as they have represented less than half of 1 percent of North American Iron Ore’s revenue for each of the three preceding fiscal years ended December 31, 2008, 2007 and 2006.
In addition, certain supply agreements with one customer include provisions for supplemental revenue or refunds based on the customer’s average annual steel pricing for the year the product is consumed in the customer’s blast furnaces. The supplemental pricing is characterized as an embedded derivative, which is finalized based on a future price, and is marked to fair value as a revenue adjustment each reporting period until the pellets are consumed and the amounts are settled. The fair value of the instrument is determined using an income approach based on an estimate of the annual realized price of hot rolled steel at the steelmaker’s facilities. At December 31, 2009, we had a derivative asset of $63.2 million, representing the fair value of the pricing factors, based upon the amount of unconsumed tons and an estimated average hot band steel price related to the period in which the tons are expected to be consumed in the customer’s blast furnace at each respective steelmaking facility, subject to final pricing at a future date. This compares with a derivative asset of $76.6 million as of December 31, 2008, based upon the amount of unconsumed tons and the related estimated average hot band steel price.
74
The customer’s average annual price is not known at the time of sale and the actual price is received on a delayed basis at the end of the year, once the average annual price has been finalized. As a result, we estimate the average price and adjust the estimate to actual in the fourth quarter when the information is provided by the customer at the end of each year. Information used in developing the estimate includes such factors as production and pricing information from the customer, current spot prices, third-party analyst forecasts, publications and other industry information. The accuracy of our estimates typically increases as the year progresses based on additional information in the market becoming available and the customer’s ability to more accurately determine the average price it will realize for the year. The following represents the historical accuracy of our pricing estimates related to the derivative as well as the impact on revenue resulting from the difference between the estimated price and the actual price for each quarter during 2009, 2008 and 2007 prior to receiving final information from the customer for tons consumed during each year:
| Hot Band Steel Price - Estimate vs. Actual | ||||||||||||||||||||||||||||||
| 2009 | 2008 | 2007 | ||||||||||||||||||||||||||||
| Final Price |
Estimated Price |
Impact on Revenue (in millions) |
Final Price |
Estimated Price |
Impact on Revenue (in millions) |
Final Price |
Estimated Price |
Impact on Revenue (in millions) |
||||||||||||||||||||||
| First Quarter |
$ | 528 | $ | 523 | $ | 1.2 | $ | 763 | $ | 645 | $ | 24.9 | $ | 559 | $ | 568 | $ | (1.2 | ) | |||||||||||
| Second Quarter |
528 | 545 | (1.3 | ) | 763 | 773 | (5.4 | ) | 559 | 564 | (1.3 | ) | ||||||||||||||||||
| Third Quarter |
528 | 536 | (0.6 | ) | 763 | 794 | (17.6 | ) | 559 | 560 | (0.7 | ) | ||||||||||||||||||
| Fourth Quarter |
528 | 528 | — | 763 | 763 | — | 559 | 559 | — | |||||||||||||||||||||
We estimate that a $25 change in the average hot band steel price realized from the December 31, 2009 estimated price recorded for the unconsumed tons remaining at year-end would cause the fair value of the derivative instrument to increase or decrease by approximately $13.7 million, thereby impacting our consolidated revenues by the same amount.
Benchmark Pricing Provision
Certain supply agreements primarily with our Asia Pacific Iron Ore customers provide for revenue or refunds based on the ultimate settlement of annual international benchmark pricing for lump and fines. As a result of the derivative accounting treatment applied to these provisions, revenue reflects the estimated benchmark price until final settlement occurs. Therefore, to the extent final prices are higher or lower than what was recorded on a provisional basis, an increase or decrease to revenues is recorded each reporting period until the date of final pricing. Accordingly, in times of rising iron ore prices, our revenues benefit from higher prices received for contracts priced at the current benchmark price and also from an increase related to the final pricing of provisionally priced sales pursuant to contracts entered into in prior periods; in times of falling iron ore prices, the opposite occurs. Pricing estimates are primarily based upon reported price settlements in the industry and worldwide pressures in the market. The following represents the historical accuracy of our benchmark price estimates as well as the impact on Product revenues resulting from the difference between the estimated change in price and the actual change in price for each quarter during 2009 and 2008 prior to settlement. In 2007, benchmark prices settled prior to reporting first quarter results; therefore, no estimate was required.
| Benchmark Price - Estimate vs. Actual | ||||||||||||||||
| 2009 (1) | 2008 (2) | |||||||||||||||
| First Quarter | Second Quarter |
Third Quarter |
First Quarter | |||||||||||||
| Customer |
Final Settled Price Decrease (lump/ fines) |
Estimated Price Decrease (lump/ fines) |
Revenue Impact (3) (in millions) |
Estimated Price Decrease (lump/ fines) |
Estimated Price Decrease (lump/fines) |
Final Settled Price Increase (lump/fines) |
Estimated Price Increase (lump/fines) |
Revenue Impact (3) (in millions) | ||||||||
| Japan |
-44%/-33% | -30%/-30% | $ (1.3) | N/A | N/A | 97%/80% | 0.0% | $ — | ||||||||
| China |
-44%/-33% | -30%/-30% | (17.1) | -44%/-33% | -44%/-33% | 97%/80% | 0.0% | 65.0 | ||||||||
| $ (18.4) | $65.0 | |||||||||||||||
75
| (1) | The 2009 benchmark prices referenced in our Asia Pacific Iron Ore contracts settled with Japan in the second quarter of 2009. We agreed to final prices with our customers in China during the fourth quarter of 2009. |
| (2) | In 2008, Cliffs used 2007 prices as a proxy for 2008 prices prior to settlement. The 2008 benchmark prices referenced in our Asia Pacific Iron Ore contracts settled in the second quarter of 2008. |
| (3) | The impact on product revenue resulting from the difference between the estimated price and the actual price was recorded in the second quarter of each respective year. |
The derivative instrument was settled during the fourth quarter of 2009 upon settlement of the pricing provisions with each of our customers, which reflected pricing decreases of 44 percent and 33 percent for lump and fines, respectively. The settlement was consistent with previously reported price settlements in Japan as well as with our most recent estimates used for reporting revenue throughout the year. As a result, settlement of the pricing provisions referenced in certain of our Asia Pacific Iron Ore customer supply agreements did not have an impact on our consolidated financial statements for the year ended December 31, 2009.
Refer to NOTE 3 — DERIVATIVE INSTRUMENTS AND HEDGING ACTIVITIES, for further information.
Mineral Reserves
We regularly evaluate our economic mineral reserves and update them as required in accordance with SEC Industry Guide 7. The estimated mineral reserves could be affected by future industry conditions, geological conditions and ongoing mine planning. Maintenance of effective production capacity or the mineral reserve could require increases in capital and development expenditures. Generally as mining operations progress, haul lengths and lifts increase. Alternatively, changes in economic conditions, or the expected quality of mineral reserves could decrease capacity or mineral reserves. Technological progress could alleviate such factors, or increase capacity of mineral reserves.
We use our mineral reserve estimates combined with our estimated annual production levels, to determine the mine closure dates utilized in recording the fair value liability for asset retirement obligations. Refer to NOTE 11 — ENVIRONMENTAL AND MINE CLOSURE OBLIGATIONS, for further information. Since the liability represents the present value of the expected future obligation, a significant change in mineral reserves or mine lives would have a substantial effect on the recorded obligation. We also utilize economic mineral reserves for evaluating potential impairments of mine assets and in determining maximum useful lives utilized to calculate depreciation and amortization of long-lived mine assets. Decreases in mineral reserves or mine lives could significantly affect these items.
Asset Retirement Obligations and Environmental Remediation Costs
The accrued mine closure obligations for our active mining operations provide for contractual and legal obligations associated with the eventual closure of the mining operations. Our obligations are determined based on detailed estimates adjusted for factors that a market participant would consider (i.e., inflation, overhead and profit), which are escalated at an assumed rate of inflation to the estimated closure dates, and then discounted using the current credit-adjusted risk-free interest rate. The estimate also incorporates incremental increases in the closure cost estimates and changes in estimates of mine lives. The closure date for each location is determined based on the exhaustion date of the remaining iron ore reserves, which is dependent on our estimate of the economically recoverable mineral reserves. The estimated obligations are particularly sensitive to the impact of changes in mine lives given the difference between the inflation and discount rates. Changes in the base estimates of legal and contractual closure costs due to changes in legal or contractual requirements, available technology, inflation, overhead or profit rates would also have a significant impact on the recorded obligations.
We have a formal policy for environmental protection and restoration. Our obligations for known environmental matters at active and closed mining operations and other sites have been recognized based on estimates of the cost of investigation and remediation at each site. If the obligation can only be estimated as a
76
range of possible amounts, with no specific amount being more likely, the minimum of the range is accrued. Management reviews its environmental remediation sites quarterly to determine if additional cost adjustments or disclosures are required. The characteristics of environmental remediation obligations, where information concerning the nature and extent of clean-up activities is not immediately available, and which are subject to changes in regulatory requirements, result in a significant risk of increase to the obligations as they mature. Expected future expenditures are not discounted to present value unless the amount and timing of the cash disbursements can be reasonably estimated. Potential insurance recoveries are not recognized until realized. Refer to NOTE 11 — ENVIRONMENTAL AND MINE CLOSURE OBLIGATIONS, for further information.
Income Taxes
Our income tax expense, deferred tax assets and liabilities and reserves for unrecognized tax benefits reflect management’s best assessment of estimated future taxes to be paid. We are subject to income taxes in both the U.S. and numerous foreign jurisdictions. Significant judgments and estimates are required in determining the consolidated income tax expense.
Deferred income taxes arise from temporary differences between tax and financial statement recognition of revenue and expense. In evaluating our ability to recover our deferred tax assets we consider all available positive and negative evidence, including scheduled reversals of deferred tax liabilities, projected future taxable income, tax planning strategies and recent financial operations. In projecting future taxable income, we begin with historical results adjusted for the results of discontinued operations and changes in accounting policies and incorporate assumptions including the amount of future state, federal and foreign pretax operating income, the reversal of temporary differences, and the implementation of feasible and prudent tax planning strategies. These assumptions required significant judgment about the forecasts of future taxable income and are consistent with the plans and estimates we are using to manage the underlying businesses. In evaluating the objective evidence that historical results provide, we consider three years of cumulative operating income (loss).
At December 31, 2009, we had a valuation allowance of $89.4 million against our deferred tax assets. Our losses in certain foreign locations in recent periods represented sufficient negative evidence to require a full valuation allowance against certain of our foreign deferred tax assets. We intend to maintain a valuation allowance against our net deferred tax assets until sufficient positive evidence exists to support the realization of such assets.
Changes in tax laws and rates could also affect recorded deferred tax assets and liabilities in the future. Management is not aware of any such changes that would have a material effect on the Company’s results of operations, cash flows or financial position.
The calculation of our tax liabilities involves dealing with uncertainties in the application of complex tax laws and regulations in a multitude of jurisdictions across our global operations.
Accounting for uncertainty in income taxes recognized in the financial statements requires that a tax benefit from an uncertain tax position be recognized when it is more likely than not that the position will be sustained upon examination, including resolutions of any related appeals or litigation processes, based on technical merits.
We recognize tax liabilities in accordance with ASC 740, and we adjust these liabilities when our judgment changes as a result of evaluation of new information not previously available. Due to the complexity of some of these uncertainties, the ultimate resolution may result in payment that is materially different from our current estimate of the tax liabilities. These differences will be reflected as increases or decreases to income tax expense in the period in which they are determined.
Goodwill and Asset Impairment
In assessing the recoverability of our goodwill and other long-lived assets, significant assumptions regarding the estimated future cash flows and other factors to determine the fair value of the respective assets must be made, including among other things, estimates related to pricing, volume and reserves. The fair value of goodwill is estimated using a discounted cash flow valuation model. If these estimates or their related assumptions change in the future as a result of changes in strategy or market conditions, we may be required to record impairment charges for these assets in the period such determination was made.
77
We monitor conditions that indicate that the carrying value of an asset or asset group may be impaired. We determine impairment based on the asset’s ability to generate cash flow greater than its carrying value, utilizing an undiscounted probability-weighted analysis. If the analysis indicates the asset is impaired, the carrying value is adjusted to fair value. Fair value can be determined using a market approach, income approach or cost approach. The impairment analysis and fair value determination can result in substantially different outcomes based on critical assumptions and estimates including the quantity and quality of remaining economic ore reserves, future iron ore prices and production costs.
We evaluate goodwill for impairment in the fourth quarter each year. In addition to the annual impairment test required under U.S. GAAP, we assessed whether events or circumstances occurred that potentially indicate that the carrying amount of these assets may not be recoverable. Based on the assessment performed, we concluded that there were no such events or changes in circumstances during 2009. We determined that the fair value of the reporting units was in excess of our carrying value as of December 31, 2009, and that we did not have any reporting units that were at risk of failing the first step of the goodwill impairment test. Consequently, no goodwill impairment charges were recorded in 2009. Refer to NOTE 1 — BUSINESS SUMMARY AND SIGNIFICANT ACCOUNTING POLICIES, for further information regarding our policy on asset impairment.
Employee Retirement Benefit Obligations
We offer defined benefit pension plans, defined contribution pension plans and other postretirement benefit plans, primarily consisting of retiree healthcare benefits, to most employees in North America as part of a total compensation and benefits program. This includes employees of PinnOak, who became employees of the Company through the July 2007 acquisition. We do not have employee retirement benefit obligations at our Asia Pacific Iron Ore operations.
Following is a summary of our defined benefit pension and OPEB funding and expense for the years 2007 through 2010:
| (In Millions) | ||||||||||
| Pension | OPEB | |||||||||
| Funding | Expense | Funding | Expense | |||||||
| 2007 |
32.5 | 17.4 | 23.0 | 4.5 | ||||||
| 2008 |
24.9 | 20.3 | 19.7 | 8.6 | ||||||
| 2009 |
18.5 | 50.8 | 35.7 | 25.5 | ||||||
| 2010 (Estimated) |
45.9 | 45.4 | (1) | 35.2 | 20.0 | (1) | ||||
| (1) | Approximately $28.0 million and $11.5 million of the 2010 estimated expense for Pension and OPEB, respectively, relates to previously unrecognized losses reported in OCI. |
Assumptions used in determining the benefit obligations and the value of plan assets for defined benefit pension plans and postretirement benefit plans (primarily retiree healthcare benefits) offered by the Company are evaluated periodically by management. Critical assumptions, such as the discount rate used to measure the benefit obligations, the expected long-term rate of return on plan assets, the medical care cost trend, and the rate of compensation increase are reviewed annually. We used a discount rate in 2009 of 5.66 percent, compared with a discount rate of 6.00 percent in 2008. We assumed a compensation increase of 4.0 percent in 2009 and 2008 to determine both our pension and OPEB obligations. Additionally, on December 31, 2008, we adopted the IRS 2009 prescribed mortality tables (separate pre-retirement and postretirement) to determine the expected life of our plan participants, replacing the IRS static 2023/2015 tables. Following are sensitivities on estimated 2010 pension and OPEB expense of potential further changes in these key assumptions:
| Increase in 2010 Expense (In Millions) | ||||||
| Pension | OPEB | |||||
| Decrease discount rate .25 percent |
$ | 1.6 | $ | 0.8 | ||
| Decrease return on assets 1 percent |
4.7 | 1.5 | ||||
| Increase medical trend rate 1 percent |
N/A | 5.9 | ||||
78
Changes in actuarial assumptions, including discount rates, employee retirement rates, mortality, compensation levels, plan asset investment performance, and healthcare costs, are determined by the Company based on analyses of actual and expected factors. Changes in actuarial assumptions and/or investment performance of plan assets can have a significant impact on our financial condition due to the magnitude of our retirement obligations. Refer to NOTE 12 — PENSIONS AND OTHER POSTRETIREMENT BENEFITS in Item 8 for further information.
Forward-Looking Statements
This report contains statements that constitute “forward-looking statements” within the meaning of the Private Securities Litigation Reform Act of 1995. These forward-looking statements may be identified by the use of predictive, future-tense or forward-looking terminology, such as “believes,” “anticipates,” “expects,” “estimates,” “intends,” “may,” “will” or similar terms. These statements speak only as of the date of this report, and we undertake no ongoing obligation, other than that imposed by law, to update these statements. These statements appear in a number of places in this report and relate to, among other things, our intent, belief or current expectations of our directors or our officers with respect to: our future financial condition, results of operations or prospects, estimates of our economic iron ore and coal reserves; our business and growth strategies; and our financing plans and forecasts. You are cautioned that any such forward-looking statements are not guarantees of future performance and involve significant risks and uncertainties, and that actual results may differ materially from those contained in or implied by the forward-looking statements as a result of various factors, some of which are unknown, including, without limitation:
| • | the impact of the current global economic crisis, including downward pressure on prices; |
| • | trends affecting our financial condition, results of operations or future prospects; |
| • | the outcome of any contractual disputes with our customers; |
| • | the ability of our customers to meet their obligations to us on a timely basis or at all; |
| • | our actual economic iron ore and coal reserves; |
| • | the success of our business and growth strategies; |
| • | our ability to successfully identify and consummate any strategic investments; |
| • | adverse changes in currency values; |
| • | the outcome of any contractual disputes with our significant energy, material or service providers; |
| • | the success of our cost-savings efforts; |
| • | our ability to maintain adequate liquidity and successfully implement our financing plans; |
| • | our ability to maintain appropriate relations with unions and employees; |
| • | uncertainties associated with unanticipated geological conditions related to underground mining; |
| • | the potential existence of significant deficiencies or material weakness in our internal control over financial reporting; and |
You are cautioned that any such forward-looking statements are not guarantees of future performance and involve significant risks and uncertainties, and that actual results may differ materially from those contained in the forward-looking statements as a result of various factors, some of which are unknown. For additional factors affecting the business of Cliffs Natural Resources Inc., refer to Part I – Item 1A. Risk Factors.
You are urged to carefully consider these risk factors. All forward-looking statements attributable to us are expressly qualified in their entirety by the foregoing cautionary statements.
| Item 7A. Quantitative | and Qualitative Disclosures About Market Risk. |
Information regarding our Market Risk is presented under the caption Market Risk, which is included in Item 7 and is incorporated by reference and made a part hereof.
79
| Item 8. | Financial Statements and Supplementary Data. |
Statements of Consolidated Financial Position
Cliffs Natural Resources Inc. and Subsidiaries
| December 31, (In Millions) | ||||||
| 2009 | 2008 | |||||
| ASSETS |
||||||
| CURRENT ASSETS |
||||||
| Cash and cash equivalents |
$ | 502.7 | $ | 179.0 | ||
| Accounts receivable |
103.5 | 68.5 | ||||
| Inventories |
272.5 | 265.4 | ||||
| Supplies and other inventories |
102.7 | 101.2 | ||||
| Deferred and refundable taxes |
61.4 | 54.8 | ||||
| Derivative assets |
51.5 | 76.9 | ||||
| Other current assets |
66.9 | 115.9 | ||||
| TOTAL CURRENT ASSETS |
1,161.2 | 861.7 | ||||
| PROPERTY, PLANT AND EQUIPMENT, NET |
2,592.6 | 2,456.1 | ||||
| OTHER ASSETS |
||||||
| Marketable securities |
88.1 | 25.4 | ||||
| Investments in ventures |
315.1 | 305.3 | ||||
| Goodwill |
74.6 | 2.0 | ||||
| Intangible assets, net |
114.8 | 109.6 | ||||
| Long-term receivables |
49.8 | 33.4 | ||||
| Deferred income taxes |
151.1 | 251.2 | ||||
| Deposits and miscellaneous |
92.0 | 66.4 | ||||
| TOTAL OTHER ASSETS |
885.5 | 793.3 | ||||
| TOTAL ASSETS |
$ | 4,639.3 | $ | 4,111.1 | ||
See notes to consolidated financial statements.
80
Statements of Consolidated Financial Position
Cliffs Natural Resources Inc. and Subsidiaries
| December 31, (In Millions) |
||||||||
| 2009 | 2008 | |||||||
| LIABILITIES |
||||||||
| CURRENT LIABILITIES |
||||||||
| Accounts payable |
$ | 178.9 | $ | 201.0 | ||||
| Accrued employment costs |
78.4 | 98.9 | ||||||
| Income taxes payable |
6.1 | 99.3 | ||||||
| State and local taxes payable |
35.1 | 45.5 | ||||||
| Below-market sales contracts — current |
30.3 | 30.3 | ||||||
| Accrued expenses |
77.4 | 46.1 | ||||||
| Deferred revenue |
105.1 | 86.8 | ||||||
| Derivative liabilities |
— | 194.3 | ||||||
| Other current liabilities |
59.1 | 42.7 | ||||||
| TOTAL CURRENT LIABILITIES |
570.4 | 844.9 | ||||||
| POSTEMPLOYMENT BENEFIT LIABILITIES |
||||||||
| Pensions |
267.3 | 250.1 | ||||||
| Other postretirement benefits |
178.5 | 197.9 | ||||||
| TOTAL POSTEMPLOYMENT BENEFIT LIABILITIES |
445.8 | 448.0 | ||||||
| ENVIRONMENTAL AND MINE CLOSURE OBLIGATIONS |
124.3 | 104.9 | ||||||
| DEFERRED INCOME TAXES |
70.8 | 67.3 | ||||||
| SENIOR NOTES |
325.0 | 325.0 | ||||||
| TERM LOAN |
200.0 | 200.0 | ||||||
| BELOW-MARKET SALES CONTRACTS |
153.3 | 183.6 | ||||||
| OTHER LIABILITIES |
212.7 | 183.4 | ||||||
| TOTAL LIABILITIES |
2,102.3 | 2,357.1 | ||||||
| 3.25% REDEEMABLE CUMULATIVE CONVERTIBLE PERPETUAL PREFERRED STOCK — ISSUED 172,500 SHARES, 205 SHARES OUTSTANDING IN 2008 |
— | 0.2 | ||||||
| EQUITY |
||||||||
| CLIFFS SHAREHOLDERS’ EQUITY |
||||||||
| Preferred stock — no par value |
||||||||
| Class A — 3,000,000 shares authorized and unissued |
||||||||
| Class B — 4,000,000 shares authorized and unissued |
||||||||
| Common Shares — par value $0.125 per share |
||||||||
| Authorized — 224,000,000 shares; |
||||||||
| Issued — 134,623,528 shares (2008 — 134,623,528 shares); |
||||||||
| Outstanding — 130,971,470 shares (2008 — 113,508,990 shares) |
16.8 | 16.8 | ||||||
| Capital in excess of par value of shares |
695.4 | 442.2 | ||||||
| Retained Earnings |
1,973.1 | 1,799.9 | ||||||
| Cost of 3,652,058 common shares in treasury (2008 — 21,114,538 shares) |
(19.9 | ) | (113.8 | ) | ||||
| Accumulated other comprehensive loss |
(122.6 | ) | (394.6 | ) | ||||
| TOTAL CLIFFS SHAREHOLDERS’ EQUITY |
2,542.8 | 1,750.5 | ||||||
| NONCONTROLLING INTEREST |
(5.8 | ) | 3.3 | |||||
| TOTAL EQUITY |
2,537.0 | 1,753.8 | ||||||
| COMMITMENTS AND CONTINGENCIES |
||||||||
| TOTAL LIABILITIES AND EQUITY |
$ | 4,639.3 | $ | 4,111.1 | ||||
See notes to consolidated financial statements.
81
Statements of Consolidated Operations
Cliffs Natural Resources Inc. and Subsidiaries
| (In Millions, Except Per Share Amounts) |
||||||||||||
| Year Ended December 31, | ||||||||||||
| 2009 | 2008 | 2007 | ||||||||||
| REVENUES FROM PRODUCT SALES AND SERVICES |
||||||||||||
| Product |
$ | 2,216.2 | $ | 3,294.8 | $ | 1,997.3 | ||||||
| Freight and venture partners’ cost reimbursements |
125.8 | 314.3 | 277.9 | |||||||||
| 2,342.0 | 3,609.1 | 2,275.2 | ||||||||||
| COST OF GOODS SOLD AND OPERATING EXPENSES |
(2,033.1 | ) | (2,449.4 | ) | (1,813.2 | ) | ||||||
| SALES MARGIN |
308.9 | 1,159.7 | 462.0 | |||||||||
| OTHER OPERATING INCOME (EXPENSE) |
||||||||||||
| Royalties and management fee revenue |
4.8 | 21.7 | 14.5 | |||||||||
| Selling, general and administrative expenses |
(120.7 | ) | (188.6 | ) | (114.2 | ) | ||||||
| Terminated acquisition costs |
— | (90.1 | ) | — | ||||||||
| Gain on sale of other assets — net |
13.2 | 22.8 | 18.4 | |||||||||
| Casualty recoveries |
— | 10.5 | 3.2 | |||||||||
| Miscellaneous — net |
24.0 | 2.9 | (2.3 | ) | ||||||||
| (78.7 | ) | (220.8 | ) | (80.4 | ) | |||||||
| OPERATING INCOME |
230.2 | 938.9 | 381.6 | |||||||||
| OTHER INCOME (EXPENSE) |
||||||||||||
| Changes in fair value of foreign currency contracts, net |
85.7 | (188.2 | ) | — | ||||||||
| Interest income |
10.8 | 26.2 | 20.0 | |||||||||
| Interest expense |
(39.0 | ) | (39.8 | ) | (22.6 | ) | ||||||
| Impairment of securities |
— | (25.1 | ) | — | ||||||||
| Other non-operating income |
2.9 | 4.3 | 1.7 | |||||||||
| 60.4 | (222.6 | ) | (0.9 | ) | ||||||||
| INCOME FROM CONTINUING OPERATIONS BEFORE INCOME TAXES AND EQUITY LOSS FROM VENTURES |
290.6 | 716.3 | 380.7 | |||||||||
| INCOME TAX EXPENSE |
(20.8 | ) | (144.2 | ) | (84.1 | ) | ||||||
| EQUITY LOSS FROM VENTURES |
(65.5 | ) | (35.1 | ) | (11.2 | ) | ||||||
| INCOME FROM CONTINUING OPERATIONS |
204.3 | 537.0 | 285.4 | |||||||||
| INCOME FROM DISCONTINUED OPERATIONS (net of tax of $0.2 in 2007) |
— | — | 0.2 | |||||||||
| NET INCOME |
204.3 | 537.0 | 285.6 | |||||||||
| LESS: NET INCOME (LOSS) ATTRIBUTABLE TO NONCONTROLLING INTEREST (net of tax of $0.3, $9.1, and $4.7 in 2009, 2008 and 2007) |
(0.8 | ) | 21.2 | 15.6 | ||||||||
| NET INCOME ATTRIBUTABLE TO CLIFFS SHAREHOLDERS |
205.1 | 515.8 | 270.0 | |||||||||
| PREFERRED STOCK DIVIDENDS |
— | (1.1 | ) | (5.2 | ) | |||||||
| INCOME ATTRIBUTABLE TO CLIFFS COMMON SHAREHOLDERS |
$ | 205.1 | $ | 514.7 | $ | 264.8 | ||||||
| EARNINGS PER COMMON SHARE ATTRIBUTABLE TO CLIFFS SHAREHOLDERS — BASIC |
$ | 1.64 | $ | 5.07 | $ | 3.19 | ||||||
| EARNINGS PER COMMON SHARE ATTRIBUTABLE TO CLIFFS SHAREHOLDERS — DILUTED |
$ | 1.63 | $ | 4.76 | $ | 2.57 | ||||||
| AVERAGE NUMBER OF SHARES (IN THOUSANDS) |
||||||||||||
| Basic |
124,998 | 101,471 | 82,988 | |||||||||
| Diluted |
125,751 | 108,288 | 105,026 | |||||||||
| CASH DIVIDENDS PER SHARE |
0.26 | 0.35 | 0.25 | |||||||||
See notes to consolidated financial statements.
82
Statements of Consolidated Cash Flows
Cliffs Natural Resources Inc. and Subsidiaries
| (In Millions) | ||||||||||||
| Year Ended December 31, | ||||||||||||
| 2009 | 2008 | 2007 | ||||||||||
| CASH FLOW FROM CONTINUING OPERATIONS |
||||||||||||
| OPERATING ACTIVITIES |
||||||||||||
| Net income |
$ | 204.3 | $ | 537.0 | $ | 285.6 | ||||||
| Income from discontinued operations |
— | — | (0.2 | ) | ||||||||
| Adjustments to reconcile net income to net cash from operating activities: |
||||||||||||
| Depreciation, depletion and amortization |
236.6 | 201.1 | 107.2 | |||||||||
| Derivatives and currency hedges |
(204.5 | ) | 58.4 | (15.4 | ) | |||||||
| Foreign exchange gains |
(28.1 | ) | — | — | ||||||||
| Share-based compensation |
10.1 | 21.4 | 11.8 | |||||||||
| Equity loss in ventures (net of tax) |
65.5 | 35.1 | 11.2 | |||||||||
| Pensions and other postretirement benefits |
27.3 | (32.9 | ) | (35.4 | ) | |||||||
| Deferred income taxes |
60.8 | (88.5 | ) | (33.1 | ) | |||||||
| Changes in deferred revenue and below-market sales contracts |
(33.4 | ) | 58.0 | (34.2 | ) | |||||||
| Impairment of securities |
— | 25.1 | — | |||||||||
| Property damage recoveries |
— | (10.5 | ) | — | ||||||||
| Other |
4.6 | 6.7 | (15.0 | ) | ||||||||
| Changes in operating assets and liabilities: |
||||||||||||
| Receivables and other assets |
(24.2 | ) | (55.4 | ) | 18.0 | |||||||
| Product inventories |
7.7 | (44.6 | ) | 3.2 | ||||||||
| Payables and accrued expenses |
(141.0 | ) | 142.3 | (14.8 | ) | |||||||
| Net cash from operating activities |
185.7 | 853.2 | 288.9 | |||||||||
| INVESTING ACTIVITIES |
||||||||||||
| Purchase of PinnOak |
— | — | (343.8 | ) | ||||||||
| Purchase of noncontrolling interests |
— | (589.5 | ) | — | ||||||||
| Purchase of property, plant and equipment |
(116.3 | ) | (182.5 | ) | (199.5 | ) | ||||||
| Investments in ventures |
(81.8 | ) | (62.7 | ) | (180.6 | ) | ||||||
| Investment in marketable securities |
(14.9 | ) | (30.4 | ) | (85.3 | ) | ||||||
| Redemption of marketable securities |
5.4 | 17.8 | 40.6 | |||||||||
| Proceeds from sale of assets |
28.3 | 41.2 | 23.2 | |||||||||
| Proceeds from property damage insurance recoveries |
— | 10.5 | — | |||||||||
| Net cash used by investing activities |
(179.3 | ) | (795.6 | ) | (745.4 | ) | ||||||
| FINANCING ACTIVITIES |
||||||||||||
| Net proceeds from issuance of common shares |
347.3 | — | — | |||||||||
| Borrowings under credit facility |
279.7 | 540.0 | 1,195.0 | |||||||||
| Repayments under credit facility |
(276.4 | ) | (780.0 | ) | (755.0 | ) | ||||||
| Repayment of PinnOak debt |
— | — | (159.6 | ) | ||||||||
| Borrowings under senior notes |
— | 325.0 | — | |||||||||
| Common stock dividends |
(31.9 | ) | (36.1 | ) | (20.9 | ) | ||||||
| Preferred stock dividends |
— | (1.1 | ) | (5.5 | ) | |||||||
| Repayment of other borrowings |
(9.7 | ) | (8.4 | ) | (6.9 | ) | ||||||
| Contributions by (to) joint ventures, net |
(8.3 | ) | (10.5 | ) | 1.9 | |||||||
| Other financing activities |
3.6 | 3.5 | 1.1 | |||||||||
| Net cash from financing activities |
304.3 | 32.4 | 250.1 | |||||||||
| EFFECT OF EXCHANGE RATE CHANGES ON CASH |
13.0 | (68.1 | ) | 11.8 | ||||||||
| INCREASE (DECREASE) IN CASH AND CASH EQUIVALENTS |
323.7 | 21.9 | (194.6 | ) | ||||||||
| CASH AND CASH EQUIVALENTS AT BEGINNING OF YEAR |
179.0 | 157.1 | 351.7 | |||||||||
| CASH AND CASH EQUIVALENTS AT END OF YEAR |
$ | 502.7 | $ | 179.0 | $ | 157.1 | ||||||
See notes to consolidated financial statements.
83
Statements of Consolidated Changes in Equity
Cliffs Natural Resources Inc. and Subsidiaries
| (In Millions) | ||||||||||||||||||||||||||||
| Cliffs Shareholders | ||||||||||||||||||||||||||||
| Number of Common Shares |
Common Shares |
Capital in Excess of Par Value of Shares |
Retained Earnings |
Common Shares in Treasury |
Accumulated Other Compre- hensive Income (Loss) |
Non- Controlling Interest |
Total | |||||||||||||||||||||
| January 1, 2007 |
81.8 | $ | 16.8 | $ | 103.2 | $ | 1,078.5 | $ | (282.8 | ) | $ | (169.9 | ) | $ | 85.8 | $ | 831.6 | |||||||||||
| Comprehensive income |
||||||||||||||||||||||||||||
| Net income |
— | — | — | 270.0 | — | — | 15.6 | 285.6 | ||||||||||||||||||||
| Other comprehensive income |
||||||||||||||||||||||||||||
| Pension and OPEB liability |
— | — | — | — | — | 38.8 | 3.1 | 41.9 | ||||||||||||||||||||
| Unrealized net gain on marketable securities |
— | — | — | — | — | 0.6 | — | 0.6 | ||||||||||||||||||||
| Unrealized net gain on foreign currency translation |
— | — | — | — | — | 86.9 | 6.8 | 93.7 | ||||||||||||||||||||
| Unrealized loss on interest rate swap |
— | — | — | — | — | (0.9 | ) | — | (0.9 | ) | ||||||||||||||||||
| Unrealized gain on derivative instruments |
— | — | — | — | — | 14.2 | 3.5 | 17.7 | ||||||||||||||||||||
| Total comprehensive income |
— | — | — | — | — | — | 29.0 | 438.6 | ||||||||||||||||||||
| Effect of implementing provisions of ASC 740 related to accounting for income tax uncertainties |
— | — | — | (7.7 | ) | — | — | (1.8 | ) | (9.5 | ) | |||||||||||||||||
| Undistributed earnings to noncontrolling interest |
— | — | — | — | — | — | 4.8 | 4.8 | ||||||||||||||||||||
| Stock options exercised |
— | — | — | — | 0.2 | — | — | 0.2 | ||||||||||||||||||||
| Stock and other incentive plans |
0.4 | — | 4.1 | — | 2.5 | — | — | 6.6 | ||||||||||||||||||||
| Repurchases of common stock |
— | — | — | — | (2.2 | ) | — | — | (2.2 | ) | ||||||||||||||||||
| Conversion of preferred stock |
5.0 | — | 9.3 | 1.6 | 26.7 | — | — | 37.6 | ||||||||||||||||||||
| Preferred stock dividends |
— | — | — | (5.3 | ) | — | — | — | (5.3 | ) | ||||||||||||||||||
| Common stock dividends |
— | — | — | (20.9 | ) | — | — | — | (20.9 | ) | ||||||||||||||||||
| December 31, 2007 |
87.2 | 16.8 | 116.6 | 1,316.2 | (255.6 | ) | (30.3 | ) | 117.8 | 1,281.5 | ||||||||||||||||||
| Comprehensive income |
||||||||||||||||||||||||||||
| Net income |
— | — | — | 515.8 | — | — | 21.2 | 537.0 | ||||||||||||||||||||
| Other comprehensive income |
||||||||||||||||||||||||||||
| Pension and OPEB liability |
— | — | — | — | — | (188.5 | ) | (8.0 | ) | (196.5 | ) | |||||||||||||||||
| Unrealized net loss on marketable securities |
— | — | — | — | — | (10.3 | ) | (1.4 | ) | (11.7 | ) | |||||||||||||||||
| Unrealized net loss on foreign currency translation |
— | — | — | — | — | (165.1 | ) | (13.7 | ) | (178.8 | ) | |||||||||||||||||
| Unrealized loss on interest rate swap |
— | — | — | — | — | (0.8 | ) | — | (0.8 | ) | ||||||||||||||||||
| Unrealized gain on derivative instruments |
— | — | — | — | — | 0.4 | 0.8 | 1.2 | ||||||||||||||||||||
| Total comprehensive income |
— | — | — | — | — | — | (1.1 | ) | 150.4 | |||||||||||||||||||
| Equity purchase of noncontrolling interest |
4.3 | — | 141.8 | — | 23.2 | — | — | 165.0 | ||||||||||||||||||||
| Purchase of subsidiary shares from noncontrolling interest |
— | — | — | — | — | — | (111.2 | ) | (111.2 | ) | ||||||||||||||||||
| Undistributed losses to noncontrolling interest |
— | — | — | — | — | — | (2.9 | ) | (2.9 | ) | ||||||||||||||||||
| Capital contribution by noncontrolling interest to subsidiary |
— | — | — | — | — | — | 0.7 | 0.7 | ||||||||||||||||||||
| PinnOak settlement |
4.0 | — | 131.5 | — | 21.5 | — | — | 153.0 | ||||||||||||||||||||
| Stock and other incentive plans |
— | — | 19.2 | — | 0.8 | — | — | 20.0 | ||||||||||||||||||||
| Conversion of preferred stock |
18.0 | — | 33.1 | 5.1 | 96.3 | — | — | 134.5 | ||||||||||||||||||||
| Preferred stock dividends |
— | — | — | (1.1 | ) | — | — | — | (1.1 | ) | ||||||||||||||||||
| Common stock dividends |
— | — | — | (36.1 | ) | — | — | — | (36.1 | ) | ||||||||||||||||||
| December 31, 2008 |
113.5 | 16.8 | 442.2 | 1,799.9 | (113.8 | ) | (394.6 | ) | 3.3 | 1,753.8 | ||||||||||||||||||
84
Statements of Consolidated Changes in Equity — (Continued)
Cliffs Natural Resources Inc. and Subsidiaries
| (In Millions) | |||||||||||||||||||||||||||||
| Cliffs Shareholders | |||||||||||||||||||||||||||||
| Number of Common Shares |
Common Shares |
Capital in Excess of Par Value of Shares |
Retained Earnings |
Common Shares in Treasury |
Accumulated Other Compre- hensive Income (Loss) |
Non- Controlling Interest |
Total | ||||||||||||||||||||||
| Comprehensive income |
|||||||||||||||||||||||||||||
| Net income |
— | — | — | 205.1 | — | — | (0.8 | ) | 204.3 | ||||||||||||||||||||
| Other comprehensive income |
|||||||||||||||||||||||||||||
| Pension and OPEB liability |
— | — | — | — | — | 24.2 | (2.4 | ) | 21.8 | ||||||||||||||||||||
| Unrealized net gain on marketable securities |
— | — | — | — | — | 29.5 | — | 29.5 | |||||||||||||||||||||
| Unrealized net gain on foreign currency translation |
— | — | — | — | — | 231.7 | — | 231.7 | |||||||||||||||||||||
| Unrealized gain on interest rate swap |
— | — | — | — | — | 1.7 | — | 1.7 | |||||||||||||||||||||
| Unrealized loss on derivative instruments |
— | — | — | — | — | (15.1 | ) | — | (15.1 | ) | |||||||||||||||||||
| Total comprehensive income |
— | — | — | — | — | — | (3.2 | ) | 473.9 | ||||||||||||||||||||
| Purchase of subsidiary shares from noncontrolling interest |
— | — | — | — | — | — | 0.1 | 0.1 | |||||||||||||||||||||
| Undistributed losses to noncontrolling interest |
— | — | — | — | — | — | (6.7 | ) | (6.7 | ) | |||||||||||||||||||
| Capital contribution by noncontrolling interest to subsidiary |
— | — | — | — | — | — | 0.7 | 0.7 | |||||||||||||||||||||
| Issuance of common shares |
17.3 | — | 254.5 | — | 92.8 | — | — | 347.3 | |||||||||||||||||||||
| Purchase of additional noncontrolling interest |
— | — | (5.4 | ) | — | — | — | — | (5.4 | ) | |||||||||||||||||||
| Stock and other incentive plans |
0.2 | — | 4.1 | — | 0.9 | — | — | 5.0 | |||||||||||||||||||||
| Conversion of preferred stock |
— | — | — | — | 0.2 | — | — | 0.2 | |||||||||||||||||||||
| Common stock dividends |
— | — | — | (31.9 | ) | — | — | — | (31.9 | ) | |||||||||||||||||||
| December 31, 2009 |
131.0 | $ | 16.8 | $ | 695.4 | $ | 1,973.1 | $ | (19.9 | ) | $ | (122.6 | ) | $ | (5.8 | ) | $ | 2,537.0 | |||||||||||
See notes to consolidated financial statements.
85
Cliffs Natural Resources Inc. and Subsidiaries
Notes to Consolidated Financial Statements
NOTE 1 — BUSINESS SUMMARY AND SIGNIFICANT ACCOUNTING POLICIES
Business Summary
We are an international mining and natural resources company, the largest producer of iron ore pellets in North America, a major supplier of direct-shipping lump and fines iron ore out of Australia, and a significant producer of metallurgical coal. In North America, we operate six iron ore mines in Michigan, Minnesota and Eastern Canada, and two coking coal mining complexes located in West Virginia and Alabama. Our Asia Pacific operations are comprised of two iron ore mining complexes in Western Australia, serving the Asian iron ore markets with direct-shipping fines and lump ore, and a 45 percent economic interest in Sonoma, a coking and thermal coal mine located in Queensland, Australia. In Latin America, we have a 30 percent interest in Amapá, a Brazilian iron ore project. Our company’s operations are organized and managed according to product category and geographic location: North American Iron Ore, North American Coal, Asia Pacific Iron Ore, Asia Pacific Coal and Latin American Iron Ore.
Accounting Policies
We consider the following policies to be beneficial in understanding the judgments that are involved in the preparation of our consolidated financial statements and the uncertainties that could impact our financial condition, results of operations and cash flows. All common shares and per share amounts have been adjusted retroactively to reflect the two-for-one stock split effective May 15, 2008.
Use of Estimates
The preparation of financial statements, in conformity with GAAP, requires management to make estimates and assumptions that affect the reported amounts of assets and liabilities and disclosure of contingent assets and liabilities at the date of the financial statements and the reported amounts of revenues and expenses during the reporting period. Actual results could differ from estimates. On an ongoing basis, management reviews estimates. Changes in facts and circumstances may alter such estimates and affect results of operations and financial position in future periods.
Basis of Consolidation
The consolidated financial statements include our accounts and the accounts of our wholly-owned and majority-owned subsidiaries, including the following significant subsidiaries:
| Name |
Location |
Ownership Interest | Operation | ||||
| Northshore |
Minnesota | 100.0 | % | Iron Ore | |||
| United Taconite |
Minnesota | 100.0 | % | Iron Ore | |||
| Pinnacle |
West Virginia | 100.0 | % | Coal | |||
| Oak Grove |
Alabama | 100.0 | % | Coal | |||
| Asia Pacific Iron Ore |
Western Australia | 100.0 | % | Iron Ore | |||
| Tilden |
Michigan | 85.0 | % | Iron Ore | |||
| Empire |
Michigan | 79.0 | % | Iron Ore |
Intercompany transactions and balances are eliminated upon consolidation.
We previously adopted, effective January 1, 2009, the amended provisions of FASB ASC 810 related to noncontrolling interests in consolidated financial statements, which established accounting and reporting standards for the noncontrolling interest in a subsidiary and for the deconsolidation of a subsidiary. The amendment clarifies that a noncontrolling interest in a subsidiary is an ownership interest in the consolidated entity that should be reported as equity in the consolidated financial statements. The amended provisions are
86
Cliffs Natural Resources Inc. and Subsidiaries
Notes to Consolidated Financial Statements — (Continued)
effective for fiscal years and interim periods within those fiscal years, beginning on or after December 15, 2008 and have been applied prospectively as of January 1, 2009, except for the presentation and disclosure requirements, which have been applied retrospectively for all periods presented. The impact of adoption is reflected in our consolidated financial statements included herein for the years ended December 31, 2009, 2008 and 2007 and as of December 31, 2009 and 2008.
Our noncontrolling interests primarily relate to majority-owned subsidiaries within our North American Iron Ore business segment. The mining ventures function as captive cost companies, as they supply products only to their owners effectively on a cost basis. Accordingly, the noncontrolling interests’ revenue amounts are stated at cost of production and are offset entirely by an equal amount included in cost of goods sold and operating expenses, resulting in no sales margin reflected in noncontrolling interest participants. As a result, the adoption of the amendments to FASB ASC 810 did not have a material impact on our consolidated results of operations with respect to these subsidiaries.
Cash Equivalents
Cash and cash equivalents include cash on hand and in the bank as well as all short-term securities held for the primary purpose of general liquidity. We consider investments in highly liquid debt instruments with an original maturity of three months or less from the date of acquisition to be cash equivalents. We routinely monitor and evaluate counterparty credit risk related to the financial institutions by which our short-term investment securities are held.
Inventories
The following table presents the detail of our Inventories on the Statements of Consolidated Financial Position at December 31, 2009 and 2008:
| (In Millions) | ||||||||||||||||||
| 2009 | 2008 | |||||||||||||||||
| Segment |
Finished Goods |
Work-in Process |
Total Inventory |
Finished Goods |
Work-in Process |
Total Inventory | ||||||||||||
| North American Iron Ore |
$ | 172.7 | $ | 18.4 | $ | 191.1 | $ | 135.3 | $ | 13.5 | $ | 148.8 | ||||||
| North American Coal |
14.9 | 1.4 | 16.3 | 15.0 | 6.7 | 21.7 | ||||||||||||
| Asia Pacific Iron Ore |
28.6 | 31.7 | 60.3 | 30.6 | 55.1 | 85.7 | ||||||||||||
| Other |
1.6 | 3.2 | 4.8 | 6.6 | 2.6 | 9.2 | ||||||||||||
| Total |
$ | 217.8 | $ | 54.7 | $ | 272.5 | $ | 187.5 | $ | 77.9 | $ | 265.4 | ||||||
North American Iron Ore
North American Iron Ore product inventories are stated at the lower of cost or market. Cost of iron ore inventories is determined using the LIFO method. The excess of current cost over LIFO cost of iron ore inventories was $81.4 million and $84.5 million at December 31, 2009 and 2008, respectively. As of December 31, 2009 and 2008, the product inventory balance for North American Iron Ore increased to $172.7 million and $135.3 million, respectively, resulting in an additional LIFO layer being added in each year.
We had approximately 1.2 million tons and 0.4 million tons of finished goods stored at ports on the lower Great Lakes to service customers at December 31, 2009 and 2008, respectively. We maintain ownership of the inventories until title has transferred to the customer, usually when payment is made. Maintaining ownership of the iron ore products at ports on the lower Great Lakes reduces risk of non-payment by customers, as we retain title to the product until payment is received from the customer. We track the movement of the inventory and verify the quantities on hand.
87
Cliffs Natural Resources Inc. and Subsidiaries
Notes to Consolidated Financial Statements — (Continued)
North American Coal
North American Coal product inventories are stated at the lower of cost or market. Cost of coal inventories includes labor, supplies and operating overhead and related costs and is calculated using the average production cost. We maintain ownership until coal is loaded into rail cars at the mine for domestic sales and until loaded in the vessels at the terminal for export sales.
Asia Pacific Iron Ore
Asia Pacific Iron Ore product inventories are stated at the lower of cost or market. Costs, including an appropriate portion of fixed and variable overhead expenses, are assigned to the inventory on hand by the method most appropriate to each particular class of inventory, with the majority being valued on a weighted average basis. We maintain ownership of the inventories until title has transferred to the customer at the F.O.B. point, which is generally when the product is loaded into the vessel.
Derivative Financial Instruments
We are exposed to certain risks related to the ongoing operations of our business, including those caused by changes in the market value of equity investments, changes in commodity prices, interest rates and foreign currency exchange rates. We have established policies and procedures, including the use of certain derivative instruments, to manage such risks. Refer to NOTE 3 – DERIVATIVE INSTRUMENTS AND HEDGING ACTIVITIES for further information.
Property, Plant and Equipment
North American Iron Ore
North American Iron Ore properties are stated at cost. Depreciation of plant and equipment is computed principally by the straight-line method based on estimated useful lives, not to exceed the estimated economic iron ore reserves. Northshore, United Taconite and our mines in Michigan use the double declining balance method of depreciation for certain mining equipment. Depreciation is provided over the following estimated useful lives:
| Asset Class |
Basis |
Life | ||
| Buildings |
Straight line | 45 Years | ||
| Mining equipment |
Straight line | 10 to 20 Years | ||
| Processing equipment |
Straight line | 15 to 45 Years | ||
| Information technology |
Straight line | 2 to 7 Years |
Depreciation is not curtailed when operations are temporarily idled.
North American Coal
North American Coal properties are stated at cost. Depreciation is provided over the estimated useful lives, not to exceed the mine lives and is calculated by the straight-line method. Depreciation is provided over the following estimated useful lives:
| Asset Class |
Basis |
Life | ||
| Buildings |
Straight line | 30 Years | ||
| Mining equipment |
Straight line | 2 to 22 Years | ||
| Processing equipment |
Straight line | 2 to 30 Years | ||
| Information technology |
Straight line | 2 to 3 Years |
88
Cliffs Natural Resources Inc. and Subsidiaries
Notes to Consolidated Financial Statements — (Continued)
Asia Pacific Iron Ore
Our Asia Pacific Iron Ore properties are stated at cost. Depreciation is calculated by the straight-line method or production output basis provided over the following estimated useful lives:
| Asset Class |
Basis |
Life | ||
| Plant and equipment |
Straight line | 5 - 10 Years | ||
| Plant and equipment and mine assets |
Production output | 10 Years | ||
| Motor vehicles, furniture & equipment |
Straight line | 3 - 5 Years |
The following table indicates the value of each of the major classes of our consolidated depreciable assets as of December 31, 2009 and 2008:
| (In Millions) | ||||||||
| December 31, | ||||||||
| 2009 | 2008 | |||||||
| Land rights and mineral rights |
$ | 1,877.3 | $ | 1,731.0 | ||||
| Office and information technology |
53.7 | 37.8 | ||||||
| Buildings |
77.3 | 65.3 | ||||||
| Mining equipment |
381.0 | 248.5 | ||||||
| Processing equipment |
499.5 | 421.6 | ||||||
| Railroad equipment |
92.2 | 70.9 | ||||||
| Electric power facilities |
60.0 | 57.1 | ||||||
| Port facilities |
52.5 | 87.5 | ||||||
| Interest capitalized during construction |
18.9 | 19.7 | ||||||
| Land improvements |
22.4 | 20.4 | ||||||
| Other |
41.6 | 25.4 | ||||||
| Construction in progress |
81.7 | 120.0 | ||||||
| 3,258.1 | 2,905.2 | |||||||
| Allowance for depreciation and depletion |
(665.5 | ) | (449.1 | ) | ||||
| $ | 2,592.6 | $ | 2,456.1 | |||||
We recorded depreciation expense of $120.6 million, $113.5 million and $69.3 million on the Statements of Consolidated Operations for the years ended December 31, 2009, 2008 and 2007, respectively.
The costs capitalized and classified as Land rights and mineral rights represent lands where we own the surface and/or mineral rights. The value of the land rights is split between surface only, surface and minerals, and minerals only.
Our North American Coal operation leases coal mining rights from a third party through lease agreements that extend through the earlier of July 1, 2023 or until all merchantable and mineable coal has been extracted. Our interest in coal reserves and resources was valued using a discounted cash flow method. The fair value was estimated based upon the present value of the expected future cash flows from coal operations over the life of the reserves.
Our Asia Pacific Iron Ore operation’s interest in iron ore reserves and resources was valued using a discounted cash flow method. The fair value was estimated based upon the present value of the expected future cash flows from iron ore operations over the economic lives of the mines.
89
Cliffs Natural Resources Inc. and Subsidiaries
Notes to Consolidated Financial Statements — (Continued)
The net book value of the land rights and mineral rights as of December 31, 2009 and 2008 is as follows:
| (In Millions) | ||||||
| December 31, | ||||||
| 2009 | 2008 | |||||
| Land rights |
$ | 29.0 | $ | 29.0 | ||
| Mineral rights: |
||||||
| Cost |
$ | 1,848.3 | $ | 1,702.0 | ||
| Less depletion |
243.8 | 139.3 | ||||
| Net mineral rights |
$ | 1,604.5 | $ | 1,562.7 | ||
Accumulated depletion relating to mineral rights, which was recorded using the unit-of-production method, is included in Allowances for depreciation and depletion. We recorded depletion expense of $68.1 million, $66.6 million and $37.9 million on the Statements of Consolidated Operations for the years ended December 31, 2009, 2008 and 2007, respectively.
We review iron ore and coal reserves based on current expectations of revenues and costs, which are subject to change. Iron ore and coal reserves include only proven and probable quantities which can be economically and legally mined and processed utilizing existing technology.
Capitalized Stripping Costs
Stripping costs during the development of a mine, before production begins, are capitalized as a part of the depreciable cost of building, developing and constructing a mine. These capitalized costs are amortized over the productive life of the mine using the units of production method. The productive phase of a mine is deemed to have begun when saleable minerals are extracted (produced) from an ore body, regardless of the level of production. The production phase does not commence with the removal of de minimus saleable mineral material that occurs in conjunction with the removal of overburden or waste material for purposes of obtaining access to an ore body. The stripping costs incurred in the production phase of a mine are variable production costs included in the costs of the inventory produced (extracted) during the period that the stripping costs are incurred.
Stripping costs related to expansion of a mining asset of proven and probable reserves are variable production costs that are included in the costs of the inventory produced during the period that the stripping costs are incurred.
Marketable Securities
Our marketable securities consist of debt and equity instruments and are classified as either held-to-maturity or available-for-sale. Securities investments that we have the intent and ability to hold to maturity are classified as held-to-maturity and recorded at amortized cost. Investments in marketable equity securities that are being held for an indefinite period are classified as available-for-sale. We determine the appropriate classification of debt and equity securities at the time of purchase and re-evaluate such designation as of each balance sheet date. In addition, we review our investments on an ongoing basis for indications of possible impairment. Once identified, the determination of whether the impairment is temporary or other-than-temporary requires significant judgment. The primary factors that we consider in classifying the impairment include the extent and time the fair value of each investment has been below cost, and the existence of a credit loss in relation to our debt securities. If a decline in fair value is judged other than temporary, the basis of the individual security is written down to fair value as a new cost basis, and the amount of the write-down is included as a realized loss. For our held-to-maturity debt securities, if the fair value is less than cost, and we do not expect to recover the entire amortized cost basis of the security, the other-than-temporary impairment is separated into the amount representing the credit loss, which is recognized in earnings, and the amount representing all other factors, which is recognized in other comprehensive income. Refer to NOTE 4 — MARKETABLE SECURITIES for additional information.
90
Cliffs Natural Resources Inc. and Subsidiaries
Notes to Consolidated Financial Statements — (Continued)
Investments in Ventures
The following table presents the detail of our investments in unconsolidated ventures and where those investments are classified on the Statements of Consolidated Financial Position. Parentheses indicate a net liability. Refer to NOTE 6 — FINANCIAL INFORMATION OF EQUITY AFFILIATES for additional information.
| Investment |
Classification | Interest Percentage |
(In Millions) | |||||||||
| December 31, 2009 |
December 31, 2008 |
|||||||||||
| Amapá |
Investments in ventures | 30 | $ | 272.4 | $ | 266.3 | ||||||
| AusQuest |
Investments in ventures | 30 | 22.7 | 19.2 | ||||||||
| Cockatoo (1) |
Investments in ventures | 50 | 9.1 | (13.5 | ) | |||||||
| Wabush (2)(3) |
Other liabilities | 27 | (11.4 | ) | 12.1 | |||||||
| Hibbing |
Other liabilities | 23 | (11.6 | ) | (22.1 | ) | ||||||
| Other |
Investments in ventures | 10.9 | 7.7 | |||||||||
| $ | 292.1 | $ | 269.7 | |||||||||
| (1) | Recorded as Other liabilities at December 31, 2008. |
| (2) | Recorded as Investments in ventures at December 31, 2008. |
| (3) | On October 12, 2009, we exercised our right of first refusal to acquire U.S. Steel Canada’s 44.6 percent interest and ArcelorMittal Dofasco’s 28.6 percent interest in Wabush, thereby increasing our ownership stake in Wabush Mines to 100 percent. Ownership transfer to Cliffs was completed on February 1, 2010. Refer to NOTE 5 — ACQUISTIONS & OTHER INVESTMENTS for further information. |
Amapá
Our 30 percent ownership interest in Amapá, in which we do not have control but have the ability to exercise significant influence over operating and financial policies, is accounted for under the equity method. Accordingly, our share of the results from Amapá is reflected as Equity loss from ventures on the Statements of Consolidated Operations. The financial information of Amapá included in our financial statements is as of and for the periods ended November 30, 2009 and 2008. The earlier cut-off is to allow for sufficient time needed by Amapá to properly close and prepare complete financial information, including consolidating and eliminating entries, conversion to U.S. GAAP and review by the Company. There were no intervening transactions or events which materially affect Amapá’s financial position or results of operations that were not reflected in our year-end financial statements.
AusQuest
On September 11, 2008, we announced a strategic alliance and subscription and option agreement with AusQuest, a diversified Australian exploration company. Under the agreement, we acquired a 30 percent fully diluted interest in AusQuest through a staged issuance of shares and options. Our 30 percent ownership interest in AusQuest, in which we do not have control but have the ability to exercise significant influence over operating and financial policies, is accounted for under the equity method. Accordingly, our share of the results from AusQuest is reflected as Equity loss from ventures on the Statements of Consolidated Operations. The financial information of AusQuest included in our financial statements is as of and for the periods ended November 30, 2009 and 2008 since the date of acquisition. The earlier cut-off is to allow for sufficient time needed by AusQuest to properly close and prepare complete financial information, including consolidating and eliminating entries, conversion to U.S. GAAP and review and approval by the Company. There were no intervening transactions or events which materially affect AusQuest’s financial position or results of operations that were not reflected in our year-end financial statements.
91
Cliffs Natural Resources Inc. and Subsidiaries
Notes to Consolidated Financial Statements — (Continued)
Hibbing, Wabush and Cockatoo
Investments in certain joint ventures (Wabush, Cockatoo Island, Hibbing) in which our ownership is 50 percent or less, or in which we do not have control but have the ability to exercise significant influence over operating and financial policies, are accounted for under the equity method. Our share of equity income (loss) is eliminated against consolidated product inventory upon production, and against cost of goods sold and operating expenses when sold. This effectively reduces our cost for our share of the mining venture’s production to its cost, reflecting the cost-based nature of our participation in unconsolidated ventures. Refer to NOTE 5 — ACQUISITIONS AND OTHER INVESTMENTS, for further information regarding the exercise of our right of first refusal in October 2009 to acquire the remaining interest in Wabush.
Sonoma
Through various interrelated arrangements, we achieve a 45 percent economic interest in the collective operations of Sonoma, despite the ownership percentages of the individual components of Sonoma. We own 100 percent of CAWO, 8.33 percent of the exploration permits and applications for mining leases for the real estate that is involved in Sonoma (“Mining Assets”) and 45 percent of the infrastructure, including the construction of a rail loop and related equipment (“Non-Mining Assets”). The following substantive legal entities exist within the Sonoma structure:
| • | CAC, a wholly owned Cliffs subsidiary, is the conduit for Cliffs’ investment in Sonoma. |
| • | CAWO, a wholly owned subsidiary of CAC, owns the Washplant and receives 40 percent of Sonoma coal production in exchange for providing coal washing services to the remaining Sonoma participants. |
| • | SMM is the appointed operator of the mine assets, non-mine assets, and the Washplant. We own a 45 percent interest in SMM. |
| • | Sonoma Sales, a wholly owned subsidiary of QCoal, is the sales agent for the participants of the coal extracted and processed in the Sonoma Project. |
The objective of Sonoma is to mine and process coking and thermal coal for the benefit of the participants. Pursuant to the terms of the agreements that comprise the Sonoma Project, at the time of investment in 2007, Cliffs through CAC paid $34.9 million for an 8.33 percent undivided interest in the Mining Assets and a 45 percent undivided interest in the Non-Mining Assets and other expenditures, and paid $85.2 million to construct the Washplant. In 2009 and 2008, we invested an additional $8.6 million and $12.8 million, respectively, in the project, for a total investment of approximately $141.5 million.
While the individual components of our investment are disproportionate to the overall economics of the investment, the total investment is the same as if we had acquired a 45 percent interest in the Mining Assets and had committed to funding 45 percent of the cost of developing the Non-Mining Assets and the Washplant. In particular, the terms of the interrelated agreements under which we obtain our 45 percent interest provide that, we, through a wholly owned subsidiary, constructed and hold title to the Washplant. We wash all of the coal produced by the Sonoma Project for a fee based upon a cost to wash plus an arrangement such that we only bear 45 percent of the cost of owning and operating the Washplant. In addition, we have committed to purchasing certain amounts of coal from the other participants such that we take title to 45 percent of the coal mined. In addition, several agreements were entered into which provide for the allocation of mine and Washplant reclamation obligations such that we are responsible for 45 percent of the reclamation costs. Lastly, management agreements were entered into that allocate the costs of operating the mine to each participant based upon their respective ownership interests in SMM, 45 percent in our case. Once the coal is washed, each participant then engages Sonoma Sales to sell their coal to third parties for which Sonoma Sales earns a fee under an agreement with fixed and variable elements.
92
Cliffs Natural Resources Inc. and Subsidiaries
Notes to Consolidated Financial Statements — (Continued)
The legal entities were each evaluated under the guidelines for consolidation of a VIE as follows:
CAWO — CAC owns 100 percent of the legal equity in CAWO; however, CAC is limited in its ability to make significant decisions about CAWO because the significant decisions are made by, or subject to approval of, the Operating Committee of the Sonoma Project, of which CAC is only entitled to 45 percent of the vote. As a result, we determined that CAWO is a VIE and that CAC should consolidate CAWO as the primary beneficiary because it absorbs greater than 50 percent of the residual returns and expected losses.
Sonoma Sales — We, including our related parties, do not have voting rights with respect to Sonoma Sales and are not party to any contracts that represent significant variable interests in Sonoma Sales. Therefore, even if Sonoma Sales were a VIE, it has been determined that we are not the primary beneficiary and therefore would not consolidate Sonoma Sales.
SMM — SMM does not have sufficient equity at risk and is therefore a VIE. Through CAC, we have a 45 percent voting interest in SMM and a contractual requirement to reimburse SMM for 45 percent of the costs that it incurs in connection with managing the Sonoma Project. However, we, along with our related parties, do not have any contracts that would cause us to absorb greater than 50 percent of SMM’s expected losses, and therefore, we are not considered to be the primary beneficiary of SMM. Thus, we account for our investment in SMM in accordance with the equity method rather than consolidate the entity. The effect of SMM on our financial statements is determined to be minimal.
Mining and Non-Mining Assets — Since we have an undivided interest in these assets and Sonoma is in an extractive industry, we have pro rata consolidated our share of these assets and costs.
Goodwill
Goodwill represents the excess purchase price paid over the fair value of the net assets of acquired companies. We had goodwill of $74.6 million and $2.0 million recorded on the Statements of Consolidated Financial Position at December 31, 2009 and 2008, respectively. In accordance with the provisions of ASC 350, we compare the fair value of the respective reporting unit to its carrying value on an annual basis to determine if there is potential goodwill impairment. If the fair value of the reporting unit is less than its carrying value, an impairment loss is recorded to the extent that the fair value of the goodwill within the reporting unit is less than the carrying value of its goodwill.
For purposes of our goodwill impairment testing, we define a reporting unit as an operating segment. We evaluate goodwill for impairment in the fourth quarter each year. In addition to the annual impairment test required under U.S. GAAP, we assess whether events or circumstances occurred that potentially indicate that the carrying amount of these assets may not be recoverable. Based on the assessment performed, we concluded that there were no such events or changes in circumstances during 2009. We determined that the fair value of the reporting units was in excess of our carrying value as of December 31, 2009, and that we did not have any reporting units that were at risk of failing the first step of the goodwill impairment test. Consequently, no goodwill impairment charges were recorded in 2009.
Asset Impairment
Long-Lived Assets and Intangible Assets
We monitor conditions that may affect the carrying value of our long-lived and intangible assets when events and circumstances indicate that the carrying value of the assets may be impaired. We determine impairment based on the asset’s ability to generate cash flow greater than the carrying value of the asset, using an undiscounted probability-weighted analysis. If projected undiscounted cash flows are less than the carrying value of the asset, the asset is adjusted to its fair value. We did not record any such impairment charges in 2009, 2008 or 2007.
93
Cliffs Natural Resources Inc. and Subsidiaries
Notes to Consolidated Financial Statements — (Continued)
Equity Investments
We evaluate the loss in value of our equity method investments each reporting period to determine whether the loss is other than temporary. The primary factors that we consider in evaluating the impairment include the extent and time the fair value of each investment has been below cost, the financial condition and near-term prospects of the investment, and our intent and ability to hold the investment to recovery. If a decline in fair value is judged other than temporary, the basis of the investment is written down to fair value as a new cost basis, and the amount of the write-down is included as a realized loss.
Our investment in Amapá resulted in an equity loss of $62.2 million in 2009 compared with a loss of $35.1 million in 2008. Based upon the increase in equity losses resulting from start-up costs and production delays, which continued into 2009, we determined that indicators of impairment may exist relative to our investment in Amapá. Accordingly, we performed a quarterly assessment of the potential impairment of our investment, most recently in the fourth quarter of 2009, using a discounted cash flow model to determine the fair value of our investment in relation to its carrying value at each reporting period. Based upon the analyses performed, we have determined that our investment is not impaired as of December 31, 2009. In assessing the recoverability of our investment in Amapá, significant assumptions regarding the estimated future cash flows and other factors to determine the fair value of the investment must be made, including among other things, estimates related to pricing, volume and resources. If these estimates or their related assumptions change in the future as a result of changes in strategy or market conditions, we may be required to record impairment charges for our investment in the period such determination is made. We will continue to evaluate the results of our investment on a quarterly basis while monitoring the potential impact on our business as a result of the recent economic downturn in the industry.
Fair Value Measurements
Valuation Hierarchy
ASC 820 establishes a three-level valuation hierarchy for classification of fair value measurements. The valuation hierarchy is based upon the transparency of inputs to the valuation of an asset or liability as of the measurement date. Inputs refer broadly to the assumptions that market participants would use in pricing an asset or liability. Inputs may be observable or unobservable. Observable inputs are inputs that reflect the assumptions market participants would use in pricing the asset or liability developed based on market data obtained from independent sources. Unobservable inputs are inputs that reflect our own assumptions about the assumptions market participants would use in pricing the asset or liability developed based on the best information available in the circumstances. The three-tier hierarchy of inputs is summarized below:
| • | Level 1 – Valuation is based upon quoted prices (unadjusted) for identical assets or liabilities in active markets. |
| • | Level 2 – Valuation is based upon quoted prices for similar assets and liabilities in active markets, or other inputs that are observable for the asset or liability, either directly or indirectly, for substantially the full term of the financial instrument. |
| • | Level 3 – Valuation is based upon other unobservable inputs that are significant to the fair value measurement. |
The classification of assets and liabilities within the valuation hierarchy is based upon the lowest level of input that is significant to the fair value measurement in its entirety. Valuation methodologies used for assets and liabilities measured at fair value are as follows:
Cash Equivalents
Where quoted prices are available in an active market, cash equivalents are classified within Level 1 of the valuation hierarchy. Cash equivalents classified in Level 1 at December 31, 2009 and 2008 include money
94
Cliffs Natural Resources Inc. and Subsidiaries
Notes to Consolidated Financial Statements — (Continued)
market funds. The valuation of these instruments is determined using a market approach and is based upon unadjusted quoted prices for identical assets in active markets. If quoted market prices are not available, then fair values are estimated by using pricing models, quoted prices of securities with similar characteristics, or discounted cash flows. In these instances, the valuation is based upon quoted prices for similar assets and liabilities in active markets, or other inputs that are observable for substantially the full term of the financial instrument, and the related financial instrument is therefore classified within Level 2 of the valuation hierarchy. Level 2 securities include short-term investments for which the value of each investment is a function of the purchase price, purchase yield, and maturity date.
Marketable Securities
Where quoted prices are available in an active market, marketable securities are classified within Level 1 of the valuation hierarchy. Marketable securities classified in Level 1 at December 31, 2009 and 2008 include available-for-sale securities. The valuation of these instruments is determined using a market approach and is based upon unadjusted quoted prices for identical assets in active markets.
Derivative Financial Instruments
Derivative financial instruments valued using financial models that use as their basis readily observable market parameters are classified within Level 2 of the valuation hierarchy. Such derivative financial instruments include substantially all of our foreign currency exchange contracts and interest rate swap agreements. Derivative financial instruments that are valued based upon models with significant unobservable market parameters, and that are normally traded less actively, are classified within Level 3 of the valuation hierarchy.
Non-Financial Assets and Liabilities
We adopted the provisions of ASC 820 effective January 1, 2009 with respect to our non-financial assets and liabilities. The initial measurement provisions of ASC 820 have been applied to our asset retirement obligations, guarantees, assets and liabilities acquired through business combinations, and certain other items, and are reflected as such in our consolidated financial statements. Effective January 1, 2009, we also adopted the fair value provision with respect to our pension and other postretirement benefit plan assets. No transition adjustment was necessary upon adoption.
Refer to NOTE 8 — FAIR VALUE OF FINANCIAL INSTRUMENTS and NOTE 12 — PENSIONS AND OTHER POSTRETIREMENT BENEFITS for further information.
Pensions and Other Postretirement Benefits
We offer defined benefit pension plans, defined contribution pension plans and other postretirement benefit plans, primarily consisting of retiree healthcare benefits, to most employees in North America as part of a total compensation and benefits program. This includes employees of PinnOak, who became employees of the Company through the July 2007 acquisition. We do not have employee retirement benefit obligations at our Asia Pacific Iron Ore operations.
We recognize the funded status of our postretirement benefit obligations on our December 31, 2009 and 2008 Statements of Consolidated Financial Position based on the market value of plan assets and the actuarial present value of our retirement obligations on that date. For each plan, we determine if the plan assets exceed the benefit obligations or vice-versa. If the plan assets exceed the retirement obligations, the amount of the surplus is recorded as an asset; if the retirement obligations exceed the plan assets, the amount of the underfunded obligations are recorded as a liability. Year-end balance sheet adjustments to postretirement assets and obligations are charged to other comprehensive income.
95
Cliffs Natural Resources Inc. and Subsidiaries
Notes to Consolidated Financial Statements — (Continued)
The market value of plan assets is measured at the year-end balance sheet date. The PBO is determined based upon an actuarial estimate of the present value of pension benefits to be paid to current employees and retirees. The APBO represents an actuarial estimate of the present value of OPEB benefits to be paid to current employees and retirees.
The actuarial estimates of the PBO and APBO retirement obligations incorporate various assumptions including the discount rates, the rates of increases in compensation, healthcare cost trend rates, mortality, retirement timing and employee turnover. The discount rate is determined based on the prevailing year-end rates for high-grade corporate bonds with a duration matching the expected cash flow timing of the benefit payments from the various plans. The remaining assumptions are based on our estimates of future events incorporating historical trends and future expectations. The amount of net periodic cost that is recorded in the Consolidated Statements of Operations consists of several components including service cost, interest cost, expected return on plan assets, and amortization of previously unrecognized amounts. Service cost represents the value of the benefits earned in the current year by the participants. Interest cost represents the cost associated with the passage of time. In addition, the net periodic cost is affected by the anticipated income from the return on invested assets, as well as the income or expense resulting from the recognition of previously deferred items. Certain items, such as plan amendments, gains and/or losses resulting from differences between actual and assumed results for demographic and economic factors affecting the obligations and assets of the plans, and changes in plan assumptions are subject to deferred recognition for income and expense purposes. The expected return on plan assets is determined utilizing the weighted average of expected returns for plan asset investments in various asset categories based on historical performance, adjusted for current trends. See NOTE 12 — PENSIONS AND OTHER POSTRETIREMENT BENEFITS for further information.
Asset Retirement Obligations
Asset retirement obligations are recognized when incurred and recorded as liabilities at fair value. The fair value of the liability is determined as the discounted value of the expected future cash flow. The asset retirement obligation is accreted over time through periodic charges to earnings. In addition, the asset retirement cost is capitalized as part of the asset’s carrying value and amortized over the life of the related asset. Reclamation costs are periodically adjusted to reflect changes in the estimated present value resulting from the passage of time and revisions to the estimates of either the timing or amount of the reclamation costs. We review, on an annual basis, unless otherwise deemed necessary, the asset retirement obligation at each mine site in accordance with the provisions of ASC 410. We perform an in-depth evaluation of the liability every three years in addition to routine annual assessments.
Future remediation costs for inactive mines are accrued based on management’s best estimate at the end of each period of the costs expected to be incurred at a site. Such cost estimates include, where applicable, ongoing maintenance and monitoring costs. Changes in estimates at inactive mines are reflected in earnings in the period an estimate is revised. See NOTE 11 — ENVIRONMENTAL AND MINE CLOSURE OBLIGATIONS for further information.
Environmental Remediation Costs
We have a formal policy for environmental protection and restoration. Our mining and exploration activities are subject to various laws and regulations governing protection of the environment. We conduct our operations to protect the public health and environment and believe our operations are in compliance with applicable laws and regulations in all material respects. Our environmental liabilities, including obligations for known environmental remediation exposures at active and closed mining operations and other sites, have been recognized based on the estimated cost of investigation and remediation at each site. If the cost can only be estimated as a range of possible amounts with no specific amount being more likely, the minimum of the range is accrued. Future expenditures are not discounted unless the amount and timing of the cash disbursements can be
96
Cliffs Natural Resources Inc. and Subsidiaries
Notes to Consolidated Financial Statements — (Continued)
reasonably estimated. It is possible that additional environmental obligations could be incurred, the extent of which cannot be assessed. Potential insurance recoveries have not been reflected in the determination of the liabilities. See NOTE 11 — ENVIRONMENTAL AND MINE CLOSURE OBLIGATIONS for further information.
Revenue Recognition and Cost of Goods Sold and Operating Expenses
North American Iron Ore
Revenue is recognized on the sale of products when title to the product has transferred to the customer in accordance with the specified provisions of each term supply agreement and all applicable criteria for revenue recognition have been satisfied. Most of our North American Iron Ore term supply agreements provide that title and risk of loss transfer to the customer when payment is received. This is a practice utilized to reduce our financial risk due to customer insolvency but is not believed to be widely used throughout the industry.
We recognize revenue based on the gross amount billed to a customer as we earn revenue from the sale of the goods or services. Revenue from product sales also includes reimbursement for freight charges paid on behalf of customers in Freight and Venture Partners’ Cost Reimbursements separate from product revenue.
Costs of goods sold and operating expenses represents all direct and indirect costs and expenses applicable to the sales and revenues of our mining operations. Operating expenses within this line item primarily represent the portion of the mining venture costs for which we do not own; that is, the costs attributable to the share of the mine’s production owned by the other joint venture partners. The mining ventures function as captive cost companies; they supply product only to their owners effectively on a cost basis. Accordingly, the noncontrolling interests’ revenue amounts are stated at cost of production and are offset in entirety by an equal amount included in cost of goods sold and operating expenses resulting in no sales margin reflected in noncontrolling interest participants. As we are responsible for product fulfillment, we retain the risks and rewards of a principal in the transaction and accordingly record revenue under these arrangements on a gross basis.
The following table is a summary of reimbursements in our North American Iron Ore operations for the years ended December 31, 2009, 2008 and 2007:
| (In Millions) | |||||||||
| Year Ended December 31, | |||||||||
| 2009 | 2008 | 2007 | |||||||
| Reimbursements for: |
|||||||||
| Freight |
$ | 22.4 | $ | 98.5 | $ | 78.3 | |||
| Venture partners’ cost |
71.3 | 170.8 | 197.3 | ||||||
| Total reimbursements |
$ | 93.7 | $ | 269.3 | $ | 275.6 | |||
Under certain term supply agreements, we ship the product to ports on the lower Great Lakes or to the customer’s facilities prior to the transfer of title. Our rationale for shipping iron ore products to certain customers and retaining title until payment is received for these products is to minimize credit risk exposure. In addition, certain supply agreements with one customer include provisions for supplemental revenue or refunds based on the customer’s annual steel pricing for the year the product is consumed in the customer’s blast furnaces. We account for this provision as a derivative instrument at the time of sale and record this provision at fair value until the year the product is consumed and the amounts are settled as an adjustment to revenue.
Where we are joint venture participants in the ownership of a mine, our contracts entitle us to receive royalties and/or management fees, which we earn as the pellets are produced. Revenue is recognized on the sale of services when the services are performed.
97
Cliffs Natural Resources Inc. and Subsidiaries
Notes to Consolidated Financial Statements — (Continued)
North American Coal
We recognize revenue when title passes to the customer. For domestic coal sales, this generally occurs when coal is loaded into rail cars at the mine. For export coal sales, this generally occurs when coal is loaded into the vessels at the terminal. Revenue from product sales in 2009, 2008 and 2007 included reimbursement for freight charges paid on behalf of customers of $32.1 million, $45.0 million and $2.3 million, respectively. Amounts reported for 2007 are for the five months ended December 31, 2007 since the July 31, 2007 date of acquisition.
Asia Pacific Iron Ore
Sales revenue is recognized at the F.O.B. point, which is generally when the product is loaded into the vessel.
Deferred Revenue
The terms of one of our North American Iron Ore pellet supply agreements require supplemental payments to be paid by the customer during the period 2009 through 2013, with the option to defer a portion of the 2009 monthly amount in exchange for interest payments until the deferred amount is repaid in 2013. Installment amounts received under this arrangement in excess of sales are classified as Deferred revenue on the Statement of Consolidated Financial Position upon receipt of payment. Revenue is recognized over the life of the supply agreement upon shipment of the pellets. As of December 31, 2009, installment amounts received in excess of sales totaled $23.2 million, which was recorded as Deferred revenue on the Statement of Consolidated Financial Position.
In 2009 and 2008, certain customers purchased and paid for 0.9 million tons and 1.2 million tons of pellets, respectively, in order to meet minimum contractual purchase requirements for each year under the terms of take-or-pay contracts. The inventory was stored at our facilities in upper lakes stockpiles. At the request of the customers, the ore was not shipped. We considered whether revenue should be recognized on these sales under the “bill and hold” guidance provided by the SEC Staff; however, based upon the assessment performed, revenue recognition on these transactions totaling $81.9 million and $82.9 million, respectively, was deferred on the December 31, 2009 and 2008 Statements of Consolidated Financial Position. As of December 31, 2009, all of the 1.2 million tons that were deferred at the end of 2008 were delivered, resulting in the related revenue being recognized in 2009 upon shipment. Furthermore, the supply agreement with one of our customers requires the customer to pay for any tons remaining under its 2009 nomination in addition to certain stockpile payments by December 31, 2009. There were approximately 1.7 million unshipped tons remaining under the customer’s 2009 nomination and 0.8 million tons related to December 2009 shipments, for which payment of $147.5 million was due on December 31, 2009 per the terms of the contract. The customer did not remit payment of this amount until January 4, 2010. As a result, such amounts are not reflected in our 2009 consolidated financial statements.
Repairs and Maintenance
Repairs, maintenance and replacement of components are expensed as incurred. The cost of major power plant overhauls is capitalized and depreciated over the estimated useful life, which is the period until the next scheduled overhaul, generally five years. All other planned and unplanned repairs and maintenance costs are expensed when incurred.
Share-Based Compensation
We adopted the fair value recognition provisions of ASC 718 effective January 1, 2006 using the modified prospective transition method. Under existing restricted stock plans awarded prior to January 1, 2006, we continue to recognize compensation cost for awards to retiree-eligible employees without substantive forfeiture risk over the nominal vesting period. This recognition method differs from the requirements for immediate recognition for awards granted with similar provisions after the January 1, 2006 adoption.
98
Cliffs Natural Resources Inc. and Subsidiaries
Notes to Consolidated Financial Statements — (Continued)
The fair value of each grant is estimated on the date of grant using a Monte Carlo simulation to forecast relative TSR performance. Consistent with the guidelines of ASC 718, a correlation matrix of historic and projected stock prices was developed for both the Company and its predetermined peer group of mining and metals companies. The fair value assumes that performance goals will be achieved. If such goals are not met, no compensation cost is recognized and any recognized compensation cost is reversed.
The expected term of the grant represents the time from the grant date to the end of the service period for each of the three plan year agreements. We estimated the volatility of our common stock and that of the peer group of mining and metals companies using daily price intervals for all companies. The risk-free interest rate is the rate at the grant date on zero-coupon government bonds, with a term commensurate with the remaining life of the performance plans.
Cash flows resulting from the tax benefits for tax deductions in excess of the compensation expense are classified as financing cash flows. Refer to NOTE 13 — STOCK COMPENSATION PLANS for additional information.
Income Taxes
Income taxes are based on income for financial reporting purposes calculated using tax rates by jurisdiction and reflect a current tax liability or asset for the estimated taxes payable or recoverable on the current year tax return and expected annual changes in deferred taxes. Any interest or penalties on income tax are recognized as a component of income tax expense.
We account for income taxes under the asset and liability method, which requires the recognition of deferred tax assets and liabilities for the expected future tax consequences of events that have been included in the financial statements. Under this method, deferred tax assets and liabilities are determined based on the differences between the financial statements and tax basis of assets and liabilities using enacted tax rates in effect for the year in which the differences are expected to reverse. The effect of a change in tax rates on deferred tax assets and liabilities is recognized in income in the period that includes the enactment date.
We record net deferred tax assets to the extent we believe these assets will more likely than not be realized. In making such determination, we consider all available positive and negative evidence, including scheduled reversals of deferred tax liabilities, projected future taxable income, tax planning strategies and recent financial results of operations. In the event we were to determine that we would be able to realize our deferred income tax assets in the future in excess of their net recorded amount, we would make an adjustment to the valuation allowance which would reduce the provision for income taxes.
Accounting for uncertainty in income taxes recognized in the financial statements requires that a tax benefit from an uncertain tax position be recognized when it is more likely than not that the position will be sustained upon examination, including resolutions of any related appeals or litigation processes, based on technical merits. See NOTE 14 — INCOME TAXES for further information.
Earnings Per Share
We present both basic and diluted EPS amounts. Basic EPS are calculated by dividing income attributable to Cliffs common shareholders by the weighted average number of common shares outstanding during the period presented. Diluted EPS are calculated by dividing net income attributable to Cliffs shareholders by the weighted average number of common shares, common share equivalents and convertible preferred stock outstanding during the period, utilizing the treasury share method for employee stock plans. Common share equivalents are excluded from EPS computations in the periods in which they have an anti-dilutive effect. See NOTE 17 — EARNINGS PER SHARE for further information.
99
Cliffs Natural Resources Inc. and Subsidiaries
Notes to Consolidated Financial Statements — (Continued)
Foreign Currency Translation
The financial statements of international subsidiaries are translated into U.S. dollars using the exchange rate at each balance sheet date for assets and liabilities and a weighted average exchange rate for each period for revenues, expenses, gains and losses. Where the local currency is the functional currency, translation adjustments are recorded as Accumulated other comprehensive loss. Where the U.S. dollar is the functional currency, translation adjustments are recorded in the Statements of Consolidated Operations. Income taxes are generally not provided for foreign currency translation adjustments.
Recent Accounting Pronouncements
Effective July 1, 2009, we adopted the FASB Accounting Standards Codification™ (“Codification”). The Codification is the source of authoritative U.S. GAAP recognized by the FASB to be applied by nongovernmental entities. The content of the Codification carries the same level of authority, thereby modifying the previous GAAP hierarchy to include only two levels of GAAP: authoritative and nonauthoritative. The Codification is effective for financial statements issued for interim and annual periods ending after September 15, 2009. Adoption of the Codification did not result in a change in current accounting practice.
Effective January 1, 2009, we adopted the amendments to FASB ASC 815 regarding disclosures about derivative instruments and hedging activities, which revised and expanded the disclosure requirements to provide users of financial statements with an enhanced understanding of how and why an entity uses derivative instruments, how derivative instruments and related hedged items are accounted for under U.S. GAAP, and how derivative instruments and related hedged items affect an entity’s financial position, financial performance and cash flows. The new requirements apply to derivative instruments and non-derivative instruments that are designated and qualify as hedging instruments and related hedged items accounted for under FASB ASC 815 and are effective for fiscal years and interim periods beginning after November 15, 2008. Refer to NOTE 3 — DERIVATIVE INSTRUMENTS AND HEDGING ACTIVITIES for further information.
We previously adopted, effective January 1, 2009, the amended provisions of FASB ASC 810 related to noncontrolling interests in consolidated financial statements, which established accounting and reporting standards for the noncontrolling interest in a subsidiary and for the deconsolidation of a subsidiary. The amendment clarifies that a noncontrolling interest in a subsidiary is an ownership interest in the consolidated entity that should be reported as equity in the consolidated financial statements. The amended provisions are effective for fiscal years and interim periods within those fiscal years, beginning on or after December 15, 2008 and have been applied prospectively as of January 1, 2009, except for the presentation and disclosure requirements, which have been applied retrospectively for all periods presented.
As of the adoption date, our noncontrolling interests are primarily comprised of majority-owned subsidiaries within our North American Iron Ore business segment. The mining ventures function as captive cost companies, as they supply products only to their owners effectively on a cost basis. Accordingly, the noncontrolling interests’ revenue amounts are stated at cost of production and are offset entirely by an equal amount included in cost of goods sold and operating expenses, resulting in no sales margin reflected in noncontrolling interest participants. As a result, the adoption of the amendments to FASB ASC 810 did not have a material impact on our consolidated results of operations with respect to these subsidiaries.
We adopted the revised provisions of FASB ASC 805 related to business combinations effective January 1, 2009. The amended guidance establishes principles and requirements for how the acquirer in a business combination recognizes and measures in its financial statements the identifiable assets acquired, the liabilities assumed and any noncontrolling interest in the acquiree at the acquisition date fair value. Information is required to be disclosed to enable users of the financial statements to evaluate the nature and financial effects of the business combination. The amendment applies prospectively to business combinations for which the acquisition date is on or after the beginning of the first annual reporting period beginning on or after December 15, 2008. The adoption of this amendment did not have a material impact on our consolidated financial statements.
100
Cliffs Natural Resources Inc. and Subsidiaries
Notes to Consolidated Financial Statements — (Continued)
In April 2009, the FASB issued an update to ASC 805 to amend and clarify the initial recognition and measurement, subsequent measurement and accounting, and related disclosures arising from contingencies in a business combination. Under the new guidance, assets acquired and liabilities assumed in a business combination that arise from contingencies should be recognized at fair value on the acquisition date if fair value can be determined during the measurement period. If fair value can not be determined, companies should typically account for the acquired contingencies using existing guidance. The guidance is effective for business combinations whose acquisition date is on or after the beginning of the first annual reporting period beginning on or after December 15, 2008. We adopted the revised provisions of FASB ASC 805 effective January 1, 2009. The adoption of this amendment did not have a material impact on our consolidated financial statements.
Effective January 1, 2009, we adopted the updated provisions of FASB ASC 808 related to accounting for collaborative arrangements. The guidance defines collaborative arrangements and establishes reporting requirements for transactions between participants in a collaborative arrangement and between participants in the arrangement and third parties. The updated guidance is effective for fiscal years beginning after December 15, 2008 and interim periods within those fiscal years. The adoption of this amendment did not have a material impact on our consolidated financial statements.
Effective January 1, 2009, we adopted the updated provisions of FASB ASC 260 related to the determination of whether instruments granted in share-based payment transactions are participating securities. This guidance was issued in order to address whether instruments granted in share-based payment transactions are considered participating securities prior to vesting and, therefore, need to be included in the earnings allocation in computing earnings per share under the two-class method. The updated guidance is effective for fiscal years beginning after December 15, 2008 and for interim periods within such years. The adoption of this amendment did not have a material impact on our consolidated financial statements.
In November 2008, the FASB updated ASC 323 to address certain matters associated with the accounting for equity method investments including initial recognition and measurement and subsequent measurement considerations. The guidance indicates, among other things, that transaction costs for an investment should be included in the cost of the equity method investment, and shares subsequently issued by the equity method investee that reduce the investor’s ownership percentage should be accounted for as if the investor had sold a proportionate share of its investment, with gains or losses recorded through earnings. The amendments are effective, on a prospective basis, for fiscal years beginning after December 15, 2008 and interim periods within those fiscal years. The implementation of this guidance did not have a material impact on our consolidated results of operations or financial condition.
In April 2009, the FASB updated ASC 820 to provide additional guidance for estimating fair value when the volume and level of activity for an asset or liability have significantly decreased, including guidance on identifying circumstances that indicate a transaction is not orderly. The updated guidance emphasizes that the objective of a fair value measurement remains the same even if there has been a significant decrease in the volume and level of activity for the asset or liability and amends certain reporting requirements for interim and annual periods related to disclosure of major security types and the inputs and valuation techniques used in determining fair value. The amendment is effective for interim and annual reporting periods ending after June 15, 2009, with early adoption permitted for periods ending after March 15, 2009. We adopted and applied the updated provisions of FASB ASC 820 prospectively upon the effective date beginning with the interim period ending June 30, 2009. The adoption of this amendment did not have a material impact on our consolidated financial statements. Refer to NOTE 8 — FAIR VALUE OF FINANCIAL INSTRUMENTS for further information.
In August 2009, the FASB issued ASU No. 2009-05 which amends ASC 820-10-35 to provide further guidance concerning the measurement of a liability at fair value when there is a lack of observable market information, particularly in relation to a liability whose transfer is contractually restricted. The amendment provides additional guidance on the use of an appropriate valuation technique that reflects the quoted price of an
101
Cliffs Natural Resources Inc. and Subsidiaries
Notes to Consolidated Financial Statements — (Continued)
identical or similar liability when traded as an asset and clarifies the circumstances under which adjustments to such price may be required in estimating the fair value of the liability. The guidance provided in this update is effective for the first reporting period beginning after issuance, with early application permitted. The amendment was adopted for the annual reporting period ended December 31, 2009; however, it did not have a material impact on our consolidated financial statements.
In April 2009, the FASB issued ASU No. 2009-02 which updated ASC 320 to amend the existing other-than-temporary impairment guidance for debt securities to make the guidance more operational and to improve the presentation and disclosure of other-than-temporary impairments on debt and equity securities in the financial statements. The new guidance does not amend existing recognition and measurement guidance related to other-than-temporary impairments of equity securities. The amendment shifts the focus from an entity’s intent to hold a debt security until recovery to its intent to sell and changes the amount of an other-than-temporary impairment loss recognized in earnings when the impairment is recorded because of a credit loss. It also expands disclosure requirements related to the types of securities held, the reasons that a portion of an other-than-temporary impairment of a debt security was not recognized in earnings, and the methodology and significant inputs used to calculate the portion of the total other-than-temporary impairment that was recognized in earnings. The updated guidance is effective for interim and annual reporting periods ending after June 15, 2009, with early adoption permitted for periods ending after March 15, 2009. We adopted this amendment beginning with the interim period ending June 30, 2009. Refer to NOTE 4 — MARKETABLE SECURITIES for further information.
In April 2009, the FASB issued an update to ASC 825, which requires disclosures about fair value of financial instruments for interim reporting periods of publicly traded companies as well as in annual financial statements, including significant assumptions used to estimate the fair value of financial instruments and changes in methods and significant assumptions, if any, during the period. The new guidance is effective for interim reporting periods ending after June 15, 2009, with early adoption permitted for periods ending after March 15, 2009. We adopted this amendment upon its effective date beginning with the interim period ending June 30, 2009.
In May 2009, the FASB issued ASC 855 related to subsequent events, which establishes general standards of accounting for and disclosure of events that occur after the balance sheet date but before financial statements are issued or are available to be issued. Although there is new terminology, the guidance is based on the same principles as those that currently exist in the auditing standards. The standard, which includes a new required disclosure of the date through which an entity has evaluated subsequent events, is effective for interim or annual periods ending after June 15, 2009. We adopted the provisions of ASC 855 beginning with the interim period ending June 30, 2009. Refer to NOTE 21 — SUBSEQUENT EVENTS for further information.
In June 2009, the FASB amended the guidance on transfers of financial assets in order to address practice issues highlighted most recently by events related to the economic downturn. The amendments include: (1) eliminating the qualifying special-purpose entity concept, (2) a new unit of account definition that must be met for transfers of portions of financial assets to be eligible for sale accounting, (3) clarifications and changes to the derecognition criteria for a transfer to be accounted for as a sale, (4) a change to the amount of recognized gain or loss on a transfer of financial assets accounted for as a sale when beneficial interests are received by the transferor, and (5) extensive new disclosures. The new guidance will be effective January 1, 2010 for calendar year-end companies. We do not expect the adoption of this amendment to have a material impact on our consolidated financial statements.
In June 2009, the FASB amended the consolidation guidance for variable-interest entities. The amendment was issued in response to perceived shortcomings in the consolidation model that were highlighted by recent market events, including concerns about the ability to structure transactions under the current guidance to avoid consolidation, balanced with the need for more relevant, timely, and reliable information about an enterprise’s involvement in a variable-interest entity. The amendments include: (1) the elimination of the exemption for qualifying special purpose entities, (2) a new approach for determining who should consolidate a variable-
102
Cliffs Natural Resources Inc. and Subsidiaries
Notes to Consolidated Financial Statements — (Continued)
interest entity, and (3) changes to when it is necessary to reassess who should consolidate a variable-interest entity. The new guidance will be effective January 1, 2010 for calendar year-end companies. We do not expect the adoption of this amendment to have a material impact on our consolidated financial statements.
In December 2008, the FASB issued an update to ASC 715 regarding employers’ disclosures about postretirement benefit plan assets. The amended guidance requires disclosure of additional information about investment allocation, fair values of major categories of assets, the development of fair value measurements, and concentrations of risk. The amendment is effective for fiscal years ending after December 15, 2009; however, earlier application is permitted. We adopted the amendment upon its effective date and have reported the required disclosures for our fiscal year ending December 31, 2009. Refer to NOTE 12 — PENSIONS AND OTHER POSTRETIREMENT BENEFITS for further information.
On September 30, 2009 the FASB issued ASU 2009-12 to provide guidance on measuring the fair value of certain alternative investments. The ASU amends ASC 820 to offer investors a practical expedient for measuring the fair value of investments in certain entities that calculate net asset value per share (NAV). The ASU is effective for the first reporting period ending after December 15, 2009; however, early adoption is permitted. We adopted this amendment for the annual reporting period ended December 31, 2009 in relation to the valuation of our postretirement benefit plan assets; however, the disclosure requirements of this amendment do not apply to employers’ postretirement benefit plan assets for which disclosures are required by other GAAP.
In January 2010, the FASB issued ASU 2010-06, which amends the guidance on fair value to add new requirements for disclosures about transfers into and out of Levels 1 and 2 and separate disclosures about purchases, sales, issuances, and settlements relating to Level 3 measurements. It also clarifies existing fair value disclosures about the level of disaggregation and about inputs and valuation techniques used to measure fair value. The ASU also amends guidance on employers’ disclosures about postretirement benefit plan assets to require that disclosures be provided by classes of assets instead of by major categories of assets. The new guidance is effective for the first reporting period beginning after December 15, 2009, except for the requirement to provide the Level 3 activity of purchases, sales, issuances, and settlements on a gross basis, which will be effective for fiscal years beginning after December 15, 2010, and for interim periods within those fiscal years. We will adopt this amendment upon its effective date and will report the required disclosures beginning with the interim period ended March 31, 2010.
NOTE 2 — SEGMENT REPORTING
Our company’s operations are organized and managed according to product category and geographic location: North American Iron Ore, North American Coal, Asia Pacific Iron Ore, Asia Pacific Coal and Latin American Iron Ore. The North American Iron Ore segment is comprised of our interests in six North American mines that provide iron ore to the integrated steel industry. The North American Coal segment is comprised of our two North American coking coal mining complexes that provide metallurgical coal primarily to the integrated steel industry. The Asia Pacific Iron Ore segment is located in Western Australia and provides iron ore to steel producers in China and Japan. There are no intersegment revenues.
The Asia Pacific Coal operating segment is comprised of our 45 percent economic interest in Sonoma, located in Queensland, Australia. The Latin American Iron Ore operating segment is comprised of our 30 percent Amapá interest in Brazil, which is in the early stages of production. The Asia Pacific Coal and Latin American Iron Ore operating segments do not meet reportable segment disclosure requirements and therefore are not separately reported.
We evaluate segment performance based on sales margin, defined as revenues less cost of goods sold and operating expenses identifiable to each segment. This measure of operating performance is an effective measurement as we focus on reducing production costs throughout the Company.
103
Cliffs Natural Resources Inc. and Subsidiaries
Notes to Consolidated Financial Statements — (Continued)
The following table presents a summary of our reportable segments for the years ended December 31, 2009, 2008 and 2007, including a reconciliation of segment sales margin to income from continuing operations before income taxes and equity loss from ventures:
| (In Millions) | |||||||||||||||||||||
| 2009 | 2008 | 2007 | |||||||||||||||||||
| Revenues from product sales and services: |
|||||||||||||||||||||
| North American Iron Ore |
$ | 1,447.8 | 62 | % | $ | 2,369.6 | 66 | % | $ | 1,745.4 | 77 | % | |||||||||
| North American Coal |
207.2 | 9 | % | 346.3 | 10 | % | 85.2 | 4 | % | ||||||||||||
| Asia Pacific Iron Ore |
542.1 | 23 | % | 769.8 | 21 | % | 444.6 | 19 | % | ||||||||||||
| Other |
144.9 | 6 | % | 123.4 | 3 | % | — | 0 | % | ||||||||||||
| Total revenues from product sales and services for reportable segments |
$ | 2,342.0 | 100 | % | $ | 3,609.1 | 100 | % | $ | 2,275.2 | 100 | % | |||||||||
| Sales margin: |
|||||||||||||||||||||
| North American Iron Ore |
$ | 275.5 | $ | 804.3 | $ | 397.9 | |||||||||||||||
| North American Coal |
(71.9 | ) | (46.4 | ) | (31.7 | ) | |||||||||||||||
| Asia Pacific Iron Ore |
87.2 | 348.6 | 95.8 | ||||||||||||||||||
| Other |
18.1 | 53.2 | — | ||||||||||||||||||
| Sales margin |
308.9 | 1,159.7 | 462.0 | ||||||||||||||||||
| Other operating expense |
(78.7 | ) | (220.8 | ) | (80.4 | ) | |||||||||||||||
| Other income (expense) |
60.4 | (222.6 | ) | (0.9 | ) | ||||||||||||||||
| Income from continuing operations before income taxes and equity loss from ventures |
$ | 290.6 | $ | 716.3 | $ | 380.7 | |||||||||||||||
| Depreciation, depletion and amortization: |
|||||||||||||||||||||
| North American Iron Ore |
$ | 74.3 | $ | 66.0 | $ | 40.7 | |||||||||||||||
| North American Coal |
38.2 | 51.5 | 17.9 | ||||||||||||||||||
| Asia Pacific Iron Ore |
110.6 | 73.7 | 48.6 | ||||||||||||||||||
| Other |
13.5 | 9.9 | — | ||||||||||||||||||
| Total depreciation, depletion and amortization |
$ | 236.6 | $ | 201.1 | $ | 107.2 | |||||||||||||||
| Capital additions (1): |
|||||||||||||||||||||
| North American Iron Ore |
$ | 42.6 | $ | 53.3 | $ | 64.4 | |||||||||||||||
| North American Coal |
20.8 | 96.6 | 11.1 | ||||||||||||||||||
| Asia Pacific Iron Ore |
96.2 | 67.8 | 39.3 | ||||||||||||||||||
| Other |
8.6 | 14.9 | 120.3 | ||||||||||||||||||
| Total capital additions |
$ | 168.2 | $ | 232.6 | $ | 235.1 | |||||||||||||||
| Assets (2): |
|||||||||||||||||||||
| North American Iron Ore |
$ | 1,478.9 | $ | 1,409.8 | |||||||||||||||||
| North American Coal |
765.0 | 773.7 | |||||||||||||||||||
| Asia Pacific Iron Ore |
1,388.2 | 1,210.9 | |||||||||||||||||||
| Other |
300.0 | 308.0 | |||||||||||||||||||
| Total segment assets |
3,932.1 | 3,702.4 | |||||||||||||||||||
| Corporate |
707.2 | 408.7 | |||||||||||||||||||
| Total assets |
$ | 4,639.3 | $ | 4,111.1 | |||||||||||||||||
| (1) | Includes capital lease additions. |
| (2) | We have corrected the classification of certain Corporate assets that were previously included within North American Iron Ore assets in 2008. |
104
Cliffs Natural Resources Inc. and Subsidiaries
Notes to Consolidated Financial Statements — (Continued)
Included in the consolidated financial statements are the following amounts relating to geographic locations:
| (In Millions) | |||||||||
| 2009 | 2008 | 2007 | |||||||
| Revenue (1) |
|||||||||
| United States |
$ | 1,049.5 | $ | 1,617.0 | $ | 1,271.1 | |||
| China |
711.5 | 774.2 | 419.9 | ||||||
| Canada |
236.6 | 573.6 | 382.0 | ||||||
| Japan |
157.4 | 263.4 | 135.7 | ||||||
| Other countries |
187.0 | 380.9 | 66.5 | ||||||
| Total revenue |
$ | 2,342.0 | $ | 3,609.1 | $ | 2,275.2 | |||
| Long-lived assets |
|||||||||
| Australia |
$ | 906.4 | $ | 763.5 | |||||
| United States |
1,686.2 | 1,692.6 | |||||||
| Total long-lived assets |
$ | 2,592.6 | $ | 2,456.1 | |||||
| (1) | Revenue is attributed to countries based on the location of the customer and includes both Product sales and services. The 2007 amounts previously included Royalties and management fees of $14.5 million. |
Concentrations in Revenue
We have two customers which individually account for more than 10 percent of our consolidated product revenue in 2009. Total revenue from these customers represents approximately $0.8 billion, $1.6 billion, and $1.1 billion of our total consolidated product revenue in 2009, 2008 and 2007, respectively, and is attributable to our North American Iron Ore and North American Coal business segments.
The following table represents the percentage of our total revenue contributed by each category of products and services in 2009, 2008 and 2007:
| 2009 | 2008 | 2007 | |||||||
| Revenue Category |
|||||||||
| Iron ore |
81 | % | 79 | % | 84 | % | |||
| Coal |
14 | 12 | 4 | ||||||
| Freight and venture partners’ cost reimbursements |
5 | 9 | 12 | ||||||
| Total revenue |
100 | % | 100 | % | 100 | % | |||
105
Cliffs Natural Resources Inc. and Subsidiaries
Notes to Consolidated Financial Statements — (Continued)
NOTE 3 — DERIVATIVE INSTRUMENTS AND HEDGING ACTIVITIES
The following table presents the fair value of our derivative instruments and the classification of each on the Statements of Consolidated Financial Position as of December 31, 2009 and 2008:
| (In Millions) | ||||||||||||||||||||
| Derivative Assets | Derivative Liabilities | |||||||||||||||||||
| December 31, 2009 | December 31, 2008 | December 31, 2009 | December 31, 2008 | |||||||||||||||||
| Derivative Instrument |
Balance Sheet Location |
Fair Value |
Balance Sheet Location |
Fair Value |
Balance Sheet Location |
Fair Value |
Balance Sheet Location |
Fair Value | ||||||||||||
| Derivatives designated as hedging instruments under ASC 815: |
||||||||||||||||||||
| Interest Rate Swap |
$ | — | $ | — | Derivative liabilities (current) |
$ | — | Derivative liabilities (current) |
$ | 2.6 | ||||||||||
| Total derivatives designated as hedging instruments under ASC 815 |
$ | — | $ | — | $ | — | $ | 2.6 | ||||||||||||
| Derivatives not designated as hedging instruments under ASC 815: |
||||||||||||||||||||
| Foreign Exchange Contracts |
Derivative assets (current) |
$ | 4.2 | Derivative assets (current) |
$ | 0.3 | Derivative liabilities (current) |
$ | — | Derivative liabilities (current) |
$ | 77.5 | ||||||||
| Deposits and miscellaneous |
— | Deposits and miscellaneous |
0.6 | Derivative liabilities (long-term) |
— | Derivative liabilities (long-term) |
34.3 | |||||||||||||
| Customer Supply Agreements |
Derivative assets (current) |
47.3 | Derivative assets (current) |
76.6 | — | — | ||||||||||||||
| Deposits and miscellaneous |
15.9 | Deposits and miscellaneous |
— | — | — | |||||||||||||||
| Benchmark Pricing Provision |
— | — | Derivative liabilities (current) |
— | Derivative liabilities (current) |
7.7 | ||||||||||||||
| United Taconite Purchase Provision |
— | — | Derivative liabilities (current) |
— | Derivative liabilities (current) |
106.5 | ||||||||||||||
| Total derivatives not designated as hedging instruments under ASC 815 |
$ | 67.4 | $ | 77.5 | $ | — | $ | 226.0 | ||||||||||||
| Total derivatives |
$ | 67.4 | $ | 77.5 | $ | — | $ | 228.6 | ||||||||||||
Derivatives Designated as Hedging Instruments
Cash Flow Hedges
Effective October 19, 2007, we entered into a $100 million fixed interest rate swap to convert a portion of our floating rate debt to fixed rate debt. Interest on borrowings under our credit facility is based on a floating rate, dependent in part on the LIBOR rate, exposing us to the effects of interest rate changes. The objective of the hedge was to eliminate the variability of cash flows in interest payments for forecasted floating rate debt, attributable to changes in benchmark LIBOR interest rates. With the swap agreement, we paid a fixed three-month LIBOR rate for $100 million of our floating rate borrowings. The changes in the cash flows of the interest rate swap were expected to offset the changes in the cash flows attributable to fluctuations in benchmark LIBOR interest rates for forecasted floating rate debt. The interest rate swap terminated in October 2009 and qualified as a cash flow hedge. Based on the current interest rate environment and the mix of fixed and variable interest rates that apply to our outstanding debt, we have no plans at this time to replace the interest rate swap.
To support hedge accounting, we designated floating-to-fixed interest rate swaps as cash flow hedges of the variability of future cash flows at the inception of the swap contract. The fair value of our outstanding hedges was recorded as an asset or liability on the consolidated statement of financial position. Ineffectiveness was measured
106
Cliffs Natural Resources Inc. and Subsidiaries
Notes to Consolidated Financial Statements — (Continued)
quarterly based on the “hypothetical derivative” method. Accordingly, the calculation of ineffectiveness involved a comparison of the fair value of the interest rate swap and the fair value of a hypothetical swap, which has terms that are identical to the hedged item. The effective portion of the cash flow hedge was recorded in Other comprehensive income, and any ineffectiveness was recognized immediately in income. The amount charged to Other comprehensive income for 2009, 2008 and 2007 was $1.6 million, $(1.2) million and $(0.9) million, respectively. Derivative liabilities of $2.6 million were recorded on the Statements of Consolidated Financial Position as of December 31, 2008. There was no ineffectiveness recorded for the interest rate swap during 2009, 2008 or 2007.
The following summarizes the effect of our derivatives designated as hedging instruments on Other comprehensive income and the Statements of Consolidated Operations for the years ended December 31, 2009, 2008 and 2007:
| (In Millions) | ||||||||||||||||||||||||||||||||||||
| Derivatives in Cash Flow |
Amount of Gain/(Loss) Recognized in OCI on Derivative (Effective Portion) |
Location of Gain/(Loss) Reclassified from Accumulated OCI into Income (Effective Portion) |
Amount of Gain/(Loss) Reclassified from Accumulated OCI into Income (Effective Portion) |
Location of Gain/(Loss) Recognized in Income on Derivative (Ineffective Portion) |
Amount of Gain/(Loss) Recognized in Income on Derivative (Ineffective Portion) |
|||||||||||||||||||||||||||||||
| Year ended December 31, |
Year ended December 31, |
Year ended December 31, |
||||||||||||||||||||||||||||||||||
| 2009 | 2008 | 2007 | 2009 | 2008 | 2007 | 2009 | 2008 | 2007 | ||||||||||||||||||||||||||||
| Interest Rate Swap |
$ | 1.0 | $ | (0.8 | ) | $ | (0.9 | ) | Interest Income/(Expense) |
$ | (0.7 | ) | $ | — | $ | — | Non-Operating Income/(Expense) |
$ | — | $ | — | $ | — | |||||||||||||
| Foreign Exchange Contracts (prior to de-designation) |
— | 32.1 | 34.4 | Product Revenue | 15.1 | 35.5 | 16.1 | Miscellaneous - net | — | (8.6 | ) | (17.0 | ) | |||||||||||||||||||||||
| Total |
$ | 1.0 | $ | 31.3 | $ | 33.5 | $ | 14.4 | $ | 35.5 | $ | 16.1 | $ | — | $ | (8.6 | ) | $ | (17.0 | ) | ||||||||||||||||
Derivatives Not Designated as Hedging Instruments
Foreign Exchange Contracts
We are subject to changes in foreign currency exchange rates as a result of our operations in Australia. Foreign exchange risk arises from our exposure to fluctuations in foreign currency exchange rates because our reporting currency is the United States dollar. Our Asia Pacific operations receive funds in United States currency for their iron ore and coal sales. We use forward exchange contracts, call options, collar options and convertible collar options to hedge our foreign currency exposure for a portion of our sales receipts. United States currency is converted to Australian dollars at the currency exchange rate in effect at the time of the transaction. The primary objective for the use of these instruments is to reduce exposure to changes in Australian and United States currency exchange rates and to protect against undue adverse movement in these exchange rates. Effective July 1, 2008, we discontinued hedge accounting for these derivatives, but continue to hold these instruments as economic hedges to manage currency risk.
During 2009, we sold approximately $270 million of the outstanding contracts and recognized a net realized loss of $3.3 million in Product revenues on the Statements of Consolidated Operations for the year ended December 31, 2009 based upon the difference between the contract rates and the spot rates on the date each contract was sold. At December 31, 2009, we had outstanding exchange rate contracts with a notional amount of $108.5 million in the form of call options, collar options, and convertible collar options with varying maturity dates ranging from January 2010 to October 2010. This compares with outstanding exchange rate contracts with a notional amount of $869.0 as of December 31, 2008.
As a result of discontinuing hedge accounting, the instruments are prospectively marked to fair value each reporting period through Changes in fair value of foreign currency contracts, net on the Statements of Consolidated Operations. For the year ended December 31, 2009, the mark-to-market adjustments resulted in a
107
Cliffs Natural Resources Inc. and Subsidiaries
Notes to Consolidated Financial Statements — (Continued)
net unrealized gain of $85.7 million, respectively, based on the Australian to U.S. dollar spot rate of 0.90 at December 31, 2009. For the year ended December 31, 2008, the mark-to-market adjustments resulted in a net unrealized loss of $188.2 million, based on the Australian to U.S. dollar spot rate of 0.69 at December 31, 2008. The amounts that were previously recorded as a component of Other comprehensive income are reclassified to earnings and a corresponding realized gain or loss is recognized upon settlement of the related contracts. For the year ended December 31, 2009, we reclassified gains of $15.1 million from Accumulated other comprehensive loss related to contracts that settled during the year, and recorded the amounts as Product revenues on the Statements of Consolidated Operations. In 2008, gains of $25.0 million were reclassified to earnings since the July 1, 2008 date of de-designation. For the years ended December 31, 2008 and 2007, ineffectiveness resulted in a loss of $8.6 million and $17.0 million, respectively, which was recorded as Miscellaneous — net on the Statements of Consolidated Operations. As of December 31, 2009, approximately $3.9 million of gains remains in Accumulated other comprehensive loss related to the effective cash flow hedge contracts prior to de-designation. Of this amount, we estimate $3.6 million will be reclassified to Product revenues in the next 12 months upon settlement of the related contracts.
Customer Supply Agreements
Most of our North American Iron Ore long-term supply agreements are comprised of a base price with annual price adjustment factors, some of which are subject to annual price collars in order to limit the percentage increase or decrease in prices for our iron ore pellets during any given year. The price adjustment factors vary based on the agreement but typically include adjustments based upon changes in international pellet prices, changes in specified Producers Price Indices including those for all commodities, industrial commodities, energy and steel. The adjustments generally operate in the same manner, with each factor typically comprising a portion of the price adjustment, although the weighting of each factor varies based upon the specific terms of each agreement. The price adjustment factors have been evaluated to determine if they contain embedded derivatives. The price adjustment factors share the same economic characteristics and risks as the host contract and are integral to the host contract as inflation adjustments; accordingly, they have not been separately valued as derivative instruments.
Certain supply agreements with one North American Iron Ore customer provide for supplemental revenue or refunds based on the customer’s average annual steel pricing at the time the product is consumed in the customer’s blast furnace. The supplemental pricing is characterized as an embedded derivative and is required to be accounted for separately from the base contract price. The embedded derivative instrument, which is finalized based on a future price, is marked to fair value as a revenue adjustment each reporting period until the pellets are consumed and the amounts are settled. We recognized $22.2 million, $225.5 million and $98.3 million as Product revenues on the Statements of Consolidated Operations for the years ended December 31, 2009, 2008 and 2007, respectively, related to the supplemental payments. Derivative assets, representing the fair value of the pricing factors, were $63.2 million and $76.6 million, respectively, on the December 31, 2009 and 2008 Statements of Consolidated Financial Position.
Benchmark Pricing Provision
Certain supply agreements primarily with our Asia Pacific Iron Ore customers provide for revenue or refunds based on the ultimate settlement of annual international benchmark pricing. The pricing provisions are characterized as freestanding derivatives and are required to be accounted for separately once iron ore is shipped. The derivative instrument, which is settled and billed once the annual international benchmark price is settled, is marked to fair value as a revenue adjustment each reporting period based upon the estimated forward settlement until the benchmark is actually settled. We recognized approximately $26.4 million as a reduction to Product revenues on the Statement of Consolidated Operations for the year ended December 31, 2009 under these pricing provisions, compared with Product revenues of $160.6 million for the year ended December 31, 2008. The
108
Cliffs Natural Resources Inc. and Subsidiaries
Notes to Consolidated Financial Statements — (Continued)
derivative instrument was settled in the fourth quarter of 2009 upon settlement of the pricing provisions with each of our customers, and is therefore not reflected on the Statement of Consolidated Financial Position at December 31, 2009.
In 2008, the derivative instrument was settled during the second quarter of 2008 upon settlement of annual benchmark prices. However, in the fourth quarter of 2008, we negotiated additional sales with certain of our Asia Pacific Iron Ore customers who had previously fulfilled their purchase commitments under 2008 contracts and required additional tonnage. In response to the economic downturn and its impact on the global steel industry, we agreed that the provisional pricing for these shipments would be at a discount to 2008 benchmark prices to reflect the decline in steel demand and prices, with final pricing being based upon 2009 benchmark prices once they were settled. The discount pricing provisions were characterized as freestanding derivatives and were required to be accounted for separately once the iron ore is shipped. The derivative instrument, which was settled and billed once the 2009 international benchmark price settled, was marked to fair value as a revenue adjustment each reporting period based upon the estimated forward settlement until the benchmark actually settled. We recognized a reduction of approximately $7.7 million in Product revenues on the Statement of Consolidated Operations for the year ended December 31, 2008, related to the shipment of approximately 0.4 million tonnes under these pricing provisions. As of December 31, 2008, the 2009 international benchmark prices had not yet settled. Therefore, we had recorded approximately $7.7 million as current Derivative liabilities on the Statement of Consolidated Financial Position at December 31, 2008. The derivative instrument was settled in the fourth quarter of 2009 upon settlement of the pricing provisions with each of our customers, and is therefore not reflected on the Statement of Consolidated Financial Position at December 31, 2009.
United Taconite Purchase Provision
The purchase agreement for the acquisition of the remaining 30 percent interest in United Taconite in 2008 contained a penalty provision in the event the 1.2 million tons of pellets included as part of the purchase consideration were not delivered by December 31, 2009. The penalty provision, which was not a fixed amount or a fixed amount per unit, was a net settlement feature in this arrangement, and therefore required the obligation to be accounted for as a derivative instrument, which was based on the future Eastern Canadian pellet price. The instrument was marked to fair value each reporting period until the pellets were delivered and the amounts were settled. A derivative liability of $106.5 million, representing the fair value of the pellets that had not yet been delivered, was recorded as current Derivative liabilities on the Statement of Consolidated Financial Position as of December 31, 2008. As of December 31, 2009 the entire 1.2 million tons of pellets have been delivered, thereby resulting in settlement of the derivative liability.
The following summarizes the effect of our derivatives that are not designated as hedging instruments, on the Statements of Consolidated Operations for the years ended December 31, 2009, 2008 and 2007:
| (In Millions) |
||||||||||||||
| Derivative Not Designated as
Hedging |
Location of Gain/(Loss) Recognized in Income on Derivative |
Amount of Gain/(Loss) Recognized in Income on Derivative |
||||||||||||
| Year ended December 31, | ||||||||||||||
| 2009 | 2008 | 2007 | ||||||||||||
| Foreign Exchange Contracts |
Product Revenues | $ | 5.4 | $ | 32.6 | $ | 23.0 | |||||||
| Foreign Exchange Contracts |
Other Income (Expense) | 85.7 | (188.2 | ) | — | |||||||||
| Foreign Exchange Contracts |
Miscellaneous - net | — | (8.6 | ) | (17.0 | ) | ||||||||
| Customer Supply Agreements |
Product Revenues | 22.2 | 225.5 | 98.3 | ||||||||||
| Benchmark Pricing Provision |
Product Revenues | (28.2 | ) | (7.7 | ) | — | ||||||||
| United Taconite Purchase Provision |
Product Revenues | 106.5 | 74.8 | — | ||||||||||
| Total |
$ | 191.6 | $ | 128.4 | $ | 104.3 | ||||||||
109
Cliffs Natural Resources Inc. and Subsidiaries
Notes to Consolidated Financial Statements — (Continued)
In the normal course of business, we enter into forward contracts designated as normal purchases, for the purchase of commodities, primarily natural gas and diesel fuel, which are used in our North American Iron Ore operations. Such contracts are in quantities expected to be delivered and used in the production process and are not intended for resale or speculative purposes.
NOTE 4 — MARKETABLE SECURITIES
At December 31, 2009 and 2008, we had $99.3 million and $30.2 million, respectively, of marketable securities as follows:
| (In Millions) | ||||||
| December 31, | ||||||
| 2009 | 2008 | |||||
| Held to maturity — current |
$ | 11.2 | $ | 4.8 | ||
| Held to maturity — non-current |
7.1 | 14.2 | ||||
| 18.3 | 19.0 | |||||
| Available for sale — non-current |
81.0 | 11.2 | ||||
| Total |
$ | 99.3 | $ | 30.2 | ||
Marketable securities classified as held-to-maturity are measured and stated at amortized cost. The amortized cost, gross unrealized gains and losses and fair value of investment securities held-to-maturity at December 31, 2009 and 2008 are summarized as follows:
| December 31, 2009 (In Millions) | |||||||||||||
| Amortized Cost |
Gross Unrealized | Fair Value | |||||||||||
| Gains | Losses | ||||||||||||
| Asset backed securities |
$ | 2.7 | $ | — | $ | (1.2 | ) | $ | 1.5 | ||||
| Floating rate notes |
15.6 | — | (0.2 | ) | 15.4 | ||||||||
| Total |
$ | 18.3 | $ | — | $ | (1.4 | ) | $ | 16.9 | ||||
| December 31, 2008 (In Millions) | |||||||||||||
| Amortized Cost |
Gross Unrealized | Fair Value | |||||||||||
| Gains | Losses | ||||||||||||
| Asset backed securities |
$ | 2.1 | $ | — | $ | (0.6 | ) | $ | 1.5 | ||||
| Floating rate notes |
16.9 | — | (1.1 | ) | 15.8 | ||||||||
| Total |
$ | 19.0 | $ | — | $ | (1.7 | ) | $ | 17.3 | ||||
110
Cliffs Natural Resources Inc. and Subsidiaries
Notes to Consolidated Financial Statements — (Continued)
Investment securities held-to-maturity at December 31, 2009 and 2008 have contractual maturities as follows:
| (In Millions) | ||||||
| December 31, | ||||||
| 2009 | 2008 | |||||
| Asset backed securities: |
||||||
| Within 1 year |
$ | — | $ | — | ||
| 1 to 5 years |
2.7 | 2.1 | ||||
| $ | 2.7 | $ | 2.1 | |||
| Floating rate notes: |
||||||
| Within 1 year |
$ | 11.2 | $ | 4.8 | ||
| 1 to 5 years |
4.4 | 12.1 | ||||
| $ | 15.6 | $ | 16.9 | |||
The following table shows our gross unrealized losses and fair value of securities classified as held-to-maturity, aggregated by investment category and length of time that individual securities have been in a continuous unrealized loss position, at December 31, 2009 and 2008:
| Less than 12 months (In Millions) | |||||||||||||
| December 31, 2009 | December 31, 2008 | ||||||||||||
| Unrealized Losses |
Fair Value |
Unrealized Losses |
Fair Value | ||||||||||
| Asset backed securities |
$ | — | $ | — | $ | — | $ | — | |||||
| Floating rate notes |
— | — | (0.1 | ) | 1.7 | ||||||||
| $ | — | $ | — | $ | (0.1 | ) | $ | 1.7 | |||||
| 12 months or longer (In Millions) | ||||||||||||||
| December 31, 2009 | December 31, 2008 | |||||||||||||
| Unrealized Losses |
Fair Value |
Unrealized Losses |
Fair Value | |||||||||||
| Asset backed securities |
$ | (1.2 | ) | $ | 1.5 | $ | (0.6 | ) | $ | 1.5 | ||||
| Floating rate notes |
(0.2 | ) | 13.2 | (1.0 | ) | 14.1 | ||||||||
| $ | (1.4 | ) | $ | 14.7 | $ | (1.6 | ) | $ | 15.6 | |||||
We believe that the unrealized losses on the held-to-maturity portfolio at December 31, 2009 are temporary and are related to market interest rate fluctuations and not to deterioration in the creditworthiness of the issuers. We expect to recover the entire amortized cost basis of the held-to-maturity debt securities, and we intend to hold these investments until maturity.
111
Cliffs Natural Resources Inc. and Subsidiaries
Notes to Consolidated Financial Statements — (Continued)
Marketable securities classified as available-for-sale are stated at fair value, with unrealized holding gains and losses included in Other comprehensive income. The cost, gross unrealized gains and losses and fair value of securities classified as available-for-sale at December 31, 2009 and 2008 are summarized as follows:
| (In Millions) | |||||||||||||
| December 31, 2009 | |||||||||||||
| Cost | Gross Unrealized | Fair Value | |||||||||||
| Gains | Losses | ||||||||||||
| Equity securities (without contractual maturity) |
$ | 35.6 | $ | 46.1 | $ | (0.7 | ) | $ | 81.0 | ||||
| (In Millions) | |||||||||||||
| December 31, 2008 | |||||||||||||
| Cost | Gross Unrealized | Fair Value | |||||||||||
| Gains | Losses | ||||||||||||
| Equity securities (without contractual maturity) |
$ | 12.0 | $ | — | $ | (0.8 | ) | $ | 11.2 | ||||
Freewest
During 2009, we acquired 29 million shares of Freewest, a Canadian-based mineral exploration company focused on acquiring, exploring and developing high-quality chromite, gold and base-metal properties in Eastern Canada. The investment is consistent with our mineral diversification strategy. Our ownership in Freewest represented approximately 12.4 percent of its outstanding shares at December 31, 2009. We did not exercise significant influence over Freewest as of the reporting date, and the investment is classified as an available-for-sale security. Accordingly, we record unrealized mark-to-market changes in the fair value of the investment through Other comprehensive income each reporting period, unless the loss is deemed to be other than temporary. On November 23, 2009, we entered into a definitive arrangement to acquire the remaining interest in Freewest. The transaction closed on January 27, 2010. Refer to NOTE 5 — ACQUISITIONS AND OTHER INVESTMENTS for further information.
Pluton Resources
In October 2009, Asia Pacific Iron Ore completed the sale of its 50 percent interest in the Irvine Island iron ore project to its joint venture partner, Pluton Resources. The consideration received consisted of a cash payment of approximately $5 million and the issuance of 19.4 million shares in Pluton Resources, all of which resulted in recognition of a gain on sale amounting to $12.1 million. Our interest in Pluton Resources is approximately 12.5 percent at December 31, 2009. We do not exercise significant influence over Pluton as of the reporting date, and the investment is classified as an available-for-sale security. Accordingly, we record unrealized mark-to-market changes in the fair value of the investment through Other comprehensive income each reporting period, unless the loss is deemed to be other than temporary.
PolyMet
We own 9.2 million shares of PolyMet common stock, representing 6.7 percent of issued shares as a result of the sale of certain land, crushing and concentrating and other ancillary facilities located at our Cliffs Erie site (formerly owned by LTVSMC) to PolyMet. We have the right to participate in up to 6.7 percent of any future financing, and PolyMet has the first right to acquire or place our shares should we choose to sell. We classify the shares as available-for-sale and record unrealized mark-to-market changes in the fair value of the shares through Other comprehensive income each reporting period, unless the loss is deemed to be other than temporary.
112
Cliffs Natural Resources Inc. and Subsidiaries
Notes to Consolidated Financial Statements — (Continued)
Golden West
During 2008, we acquired 24.3 million shares of Golden West, a Western Australia iron ore exploration company. Golden West owns the Wiluna West exploration ore project in Western Australia, containing a resource of 126 million metric tons of ore. The investment provides Asia Pacific Iron Ore a strategic interest in Golden West and Wiluna West. Our ownership in Golden West represents approximately 17 percent of its outstanding shares at December 31, 2009 and 2008. Acquisition of the shares represented an original investment of approximately $22 million. We do not exercise significant influence, and at December 31, 2009 and 2008, the investment is classified as an available-for-sale security. Accordingly, we record unrealized mark-to-market changes in the fair value of the investment through Other comprehensive income each reporting period, unless the loss is deemed to be other than temporary.
NOTE 5 — ACQUISITIONS AND OTHER INVESTMENTS
Acquisitions
We allocate the cost of acquisitions to the assets acquired and liabilities assumed based on their estimated fair values. Any excess of cost over the fair value of the net assets acquired is recorded as goodwill. There were no new acquisitions that closed in 2009; however, as discussed in further detail below, we finalized the purchase price allocation for two prior year acquisitions during the current year and announced two new acquisitions that closed in 2010.
United Taconite
Effective July 1, 2008, we acquired the remaining 30 percent interest in United Taconite. Upon consummation of the purchase, our ownership interest increased from 70 percent to 100 percent. The acquisition of the remaining noncontrolling interest was completed in order to strengthen our core North American Iron Ore business.
The aggregate acquisition price for the remaining interest in United Taconite was approximately $450.7 million, which included cash in the amount of $104.4 million, approximately $165 million of our common shares, and approximately 1.2 million tons of iron ore pellets, valued at $181.3 million, to be provided throughout 2008 and 2009. The value of the iron ore pellets was determined based on estimated iron unit content of 65 percent at the 2008 Eastern Canadian pellet price of approximately $2.33 per iron unit on July 10, 2008.
The Statements of Consolidated Financial Position as of December 31, 2009 and 2008 reflect the acquisition of the remaining interest in United Taconite, effective July 1, 2008, under the purchase method of accounting. The transaction constituted a step acquisition of a noncontrolling interest. As of the date of the step acquisition of the noncontrolling interest, the then historical cost basis of the noncontrolling interest balance was eliminated, and the increased ownership obtained was accounted for by increasing United Taconite’s basis from historical cost to fair value for the portion of the assets acquired and liabilities assumed based on the 30 percent additional ownership acquired.
113
Cliffs Natural Resources Inc. and Subsidiaries
Notes to Consolidated Financial Statements — (Continued)
We finalized the purchase price allocation in the second quarter of 2009 as follows:
| (In Millions) | ||||
| Carrying value of net assets acquired |
$ | 25.3 | ||
| Fair value adjustments: |
||||
| ASSETS |
||||
| Land |
7.6 | |||
| Plant and equipment |
90.8 | |||
| Mineral reserves |
480.6 | |||
| Intangible assets |
75.4 | |||
| LIABILITIES |
||||
| Below market sales contracts |
(229.0 | ) | ||
| Fair value of net assets acquired |
$ | 450.7 | ||
| Purchase price |
$ | 450.7 | ||
There were no significant changes to the purchase price allocation from the initial allocation performed in 2008.
Portman Share Repurchase and Buyout
In 2008, we acquired the remaining noncontrolling interest in Asia Pacific Iron Ore (formerly known as Portman Limited) through a series of step acquisitions. In the second quarter of 2008, our ownership interest increased from 80.4 percent to 85.2 percent as a result of a share repurchase in which we did not participate. In the fourth quarter of 2008, we completed a second step acquisition to acquire the remaining noncontrolling interest in Asia Pacific Iron Ore. We have accounted for the acquisition of the noncontrolling interest under the purchase method. We finalized the purchase price allocation in 2009 for both the share repurchase and the buyout. A comparison of the initial allocation and final purchase price allocation is as follows:
| (In Millions) | ||||||||||
| Finalized Allocation |
Initial Allocation |
Change | ||||||||
| Carrying value of net assets acquired |
$ | 85.6 | $ | 85.6 | $ | — | ||||
| Fair value adjustments: |
||||||||||
| Inventory |
79.6 | 59.1 | 20.5 | |||||||
| Plant and equipment |
17.3 | 18.6 | (1.3 | ) | ||||||
| Mineral reserves |
173.2 | 238.2 | (65.0 | ) | ||||||
| Intangible assets |
42.1 | 40.1 | 2.0 | |||||||
| Deferred taxes |
27.6 | 58.3 | (30.7 | ) | ||||||
| Fair value of net assets acquired |
425.4 | 499.9 | (74.5 | ) | ||||||
| Goodwill |
68.3 | — | 68.3 | |||||||
| Purchase price |
$ | 493.7 | $ | 499.9 | $ | (6.2 | ) | |||
The adjustment to the purchase price reflects changes to direct acquisition costs resulting from adjustments to the stamp duty assessment. Changes to the fair value adjustments for acquired tangible and intangible assets resulted from the finalization of certain assumptions used in the valuation models utilized to determine their fair values. Changes to the fair value adjustments for mineral reserves resulted primarily from the finalization of pricing assumptions and do not reflect changes in the quality of the related ore body. Changes to the fair value adjustments for deferred taxes resulted from the finalization of our step-up in tax base of Asia Pacific Iron Ore’s
114
Cliffs Natural Resources Inc. and Subsidiaries
Notes to Consolidated Financial Statements — (Continued)
net assets triggered by our ownership of 100 percent of the entity. Goodwill reflects the residual value of the purchase price, less the fair value of the net assets acquired, based on exchange rates in effect at the time of the share repurchase, buyout and final allocation.
Pending Transactions
Wabush
On October 9, 2009, Consolidated Thompson Iron Mines Ltd. (“Consolidated Thompson”) announced an agreement with Wabush’s other joint venture partners to acquire their ownership interests for approximately $88 million, subject to certain working capital adjustments. Under the terms of the Wabush partnership agreement, we had a right of first refusal to acquire each of U.S. Steel Canada’s and ArcelorMittal Dofasco’s interest. By exercising our right of first refusal, we were entitled to receive the same terms and conditions contained in the agreement with Consolidated Thompson and thus increase our ownership stake in Wabush to 100 percent. On October 12, 2009, we exercised our right of first refusal to acquire U.S. Steel Canada’s 44.6 percent interest and ArcelorMittal Dofasco’s 28.6 percent interest in Wabush. With Wabush’s 5.5 million tons of rated capacity, acquisition of the remaining interest will increase our North American Iron Ore rated equity production capacity by approximately 4.0 million tons. Ownership transfer to Cliffs was completed on February 1, 2010. Refer to NOTE 21 — SUBSEQUENT EVENTS for further information. We are in the process of conducting a valuation of the assets acquired and liabilities assumed related to the acquisition, most notably, inventory, mineral rights, and property, plant and equipment. Accordingly, the initial accounting for the transaction, including allocation of the purchase price has not yet been completed.
Freewest
During 2009, we acquired 29 million shares, or 12.4 percent, of Freewest, a Canadian-based mineral exploration company focused on acquiring, exploring and developing high-quality chromite, gold and base-metal properties in Eastern Canada. On November 23, 2009, we entered into a definitive arrangement to acquire the remaining interest in Freewest, including its interests in the Ring of Fire properties, which comprise three premier chromite deposits. The acquisition is consistent with our strategy to broaden our mineral diversification and will allow us to apply our expertise in open-pit mining and mineral processing to a chromite ore resource base which would form the foundation of North America’s only ferrochrome production operation. The planned mine is expected to produce 1 to 2 million tonnes of high-grade chromite ore annually, which will be further processed into 400 to 800 thousand tonnes of ferrochrome.
On January 25, 2010, we obtained shareholder approval to acquire all of the outstanding shares of Freewest for C$1.00 per share, court approval was received on January 26, 2010, and the transaction closed on January 27, 2010. We issued 0.0201 of our common shares for each Freewest share, a total of 4.2 million common shares, representing total purchase consideration of approximately $174 million. We are in the process of conducting a valuation of the assets acquired and liabilities assumed related to the acquisition, most notably, inventory, mineral rights, and property, plant and equipment. Accordingly, the initial accounting for the transaction, including allocation of the purchase price has not yet been completed. Refer to NOTE 21 — SUBSEQUENT EVENTS for additional information.
115
Cliffs Natural Resources Inc. and Subsidiaries
Notes to Consolidated Financial Statements — (Continued)
NOTE 6 — FINANCIAL INFORMATION OF EQUITY AFFILIATES
For the year ended December 31, 2009, our investment in Amapá qualifies as a significant equity method investment as defined under Regulation S-X. Summarized financial information for Amapá and our other equity method investments as of December 31, 2009 and 2008 and for the years ended December 31, 2009, 2008 and 2007 is as follows:
| Amapá (1) | ||||||||||||||||||||||
| (In Millions) |
(In Millions) | |||||||||||||||||||||
| December 31, |
Year Ended December 31, | |||||||||||||||||||||
| Balance Sheet Information |
2009 |
2008 |
Income Statement Information |
2009 | 2008 | 2007 | ||||||||||||||||
| Current assets |
$ | 124.5 | $ | 75.6 | Revenues | $ | 123.0 | $ | 52.2 | $ | 1.3 | |||||||||||
| Non-current assets |
616.6 | 565.5 | Sales margin | (46.8 | ) | (46.0 | ) | (26.6 | ) | |||||||||||||
| Current liabilities |
(632.8 | ) | (276.1 | ) | Loss from continuing |
(195.2 | ) | (111.0 | ) | (34.4 | ) | |||||||||||
| Non-current liabilities |
(4.8 | ) | (289.9 | ) | Net loss | (195.2 | ) | (111.0 | ) | (34.4 | ) | |||||||||||
| (1) | The financial information of Amapá is recorded one month in arrears and is presented in accordance with U.S. GAAP. The information presented in the table represents 100% of Amapá’s results. |
| Other Equity Method Investments (2) | ||||||||||||||||||||
| (In Millions) |
(In Millions) | |||||||||||||||||||
| December 31, |
Year Ended December 31, (3) | |||||||||||||||||||
| Balance Sheet Information |
2009 |
2008 |
Income Statement Information |
2009 | 2008 | 2007 | ||||||||||||||
| Current assets |
$ | 133.0 | $ | 175.6 | Revenues | $ | 450.7 | $ | 810.3 | $ | 714.9 | |||||||||
| Non-current assets |
1,006.3 | 944.7 | Sales margin | (0.1 | ) | 43.0 | 41.8 | |||||||||||||
| Current liabilities |
(130.0 | ) | (125.3 | ) | Income (Loss) from |
(15.0 | ) | 35.2 | 41.1 | |||||||||||
| Non-current liabilities |
(275.3 | ) | (285.5 | ) | Net income (loss) | (15.0 | ) | 35.2 | 41.1 | |||||||||||
| (2) | Other equity method investments include Wabush, Hibbing, Cockatoo, AusQuest (acquired in November 2008) and KWG (acquired in April 2009). The financial information of each equity method investment is presented in accordance with U.S. GAAP. The information presented in the table represents 100% of the investees’ results on an aggregated basis. |
| (3) | Wabush and Hibbing function as a captive cost companies, as they supply products only to their owners effectively on a cost basis. Accordingly, revenue amounts are stated at cost of production and are offset entirely by an equal amount included in cost of goods sold, resulting in no sales margin. Refer to NOTE 1 — BUSINESS SUMMARY AND SIGNIFICANT ACCOUNTING POLICIES for additional information. |
116
Cliffs Natural Resources Inc. and Subsidiaries
Notes to Consolidated Financial Statements — (Continued)
NOTE 7 — GOODWILL AND OTHER INTANGIBLE ASSETS AND LIABILITIES
Goodwill
The following table summarizes changes in the carrying amount of goodwill allocated by reporting unit during 2009 and 2008:
| (In Millions) | ||||||||||||
| December 31, 2009 | December 31, 2008 | |||||||||||
| North American Iron Ore |
Asia Pacific Iron Ore |
Total | North American Iron Ore | |||||||||
| Beginning Balance — January 1 |
$ | 2.0 | $ | — | $ | 2.0 | $ | 2.0 | ||||
| Arising in business combinations |
— | 68.3 | 68.3 | — | ||||||||
| Impact of foreign currency translation |
— | 4.3 | 4.3 | — | ||||||||
| Ending Balance — December 31 |
$ | 2.0 | $ | 72.6 | $ | 74.6 | $ | 2.0 | ||||
We had goodwill of $2.0 million as of December 31, 2008 related to our North American Iron Ore segment, which was previously reported as a non-current asset within Deposits and miscellaneous on the Statements of Consolidated Financial Position. Goodwill increased in 2009 based on finalization of the purchase price allocation related to the Asia Pacific Iron Ore share repurchase and buyout. The balance of $74.6 million and $2.0 million at December 31, 2009 and 2008, respectively, is presented as Goodwill on the Statements of Consolidated Financial Position. Refer to NOTE 5 — ACQUISITIONS AND OTHER INVESTMENTS for additional information.
Goodwill is not subject to amortization and is tested for impairment annually or when events or circumstances indicate that impairment may have occurred.
Other Intangible Assets and Liabilities
Following is a summary of intangible assets and liabilities at December 31, 2009 and 2008:
| (In Millions) | ||||||||||||||||||||
| December 31, 2009 | December 31, 2008 | |||||||||||||||||||
| Classification | Gross Carrying Amount |
Accumulated Amortization |
Net Carrying Amount |
Gross Carrying Amount |
Accumulated Amortization |
Net Carrying Amount | ||||||||||||||
| Definite lived intangible assets: |
||||||||||||||||||||
| Permits |
Intangible assets | $ | 120.3 | $ | (8.2) | $ | 112.1 | $ | 109.3 | $ | (1.8) | $ | 107.5 | |||||||
| Leases |
Intangible assets | 3.1 | (2.8) | 0.3 | 3.1 | (1.0) | 2.1 | |||||||||||||
| Unpatented technology |
Intangible assets | 4.0 | (1.6) | 2.4 | — | — | — | |||||||||||||
| Total intangible assets |
$ | 127.4 | $ | (12.6) | $ | 114.8 | $ | 112.4 | $ | (2.8) | $ | 109.6 | ||||||||
| Below-market sales contracts |
Current liabilities | $ | (30.3) | $ | — | $ | (30.3) | $ | (30.3) | $ | — | $ | (30.3) | |||||||
| Below-market sales contracts |
Long-term liabilities | (198.7) | 45.4 | (153.3) | (198.7) | 15.1 | (183.6) | |||||||||||||
| Total below-market sales contracts |
$ | (229.0) | $ | 45.4 | $ | (183.6) | $ | (229.0) | $ | 15.1 | $ | (213.9) | ||||||||
117
Cliffs Natural Resources Inc. and Subsidiaries
Notes to Consolidated Financial Statements — (Continued)
The intangible assets are subject to periodic amortization on a straight-line basis over their estimated useful lives as follows:
| Intangible Asset |
Useful Life (years) | |
| Permits |
15 - 28 | |
| Leases |
1.5 - 4.5 | |
| Unpatented technology |
5 |
Amortization expense relating to intangible assets was $9.8 million and $2.8 million, respectively, for the years ended December 31, 2009 and 2008, and is recognized in Cost of goods sold and operating expenses on the Statements of Consolidated Operations. The estimated amortization expense relating to intangible assets for each of the five succeeding fiscal years is as follows:
| (In Millions) | |||
| Amount | |||
| Year Ending December 31 |
|||
| 2010 |
$ | 6.6 | |
| 2011 |
6.6 | ||
| 2012 |
6.6 | ||
| 2013 |
5.7 | ||
| 2014 |
5.7 | ||
| Total |
$ | 31.2 | |
The below-market sales contracts are classified as a liability and recognized over the terms of the underlying contracts, which range from 3.5 to 8.5 years. For the years ended December 31, 2009 and 2008, we recognized $30.3 million and $15.1 million, respectively, in Product revenues related to the below-market sales contracts. The following amounts will be recognized in earnings for each of the five succeeding fiscal years:
| (In Millions) | |||
| Amount | |||
| Year Ending December 31 |
|||
| 2010 |
$ | 30.3 | |
| 2011 |
30.3 | ||
| 2012 |
27.0 | ||
| 2013 |
27.0 | ||
| 2014 |
23.0 | ||
| Total |
$ | 137.6 | |
118
Cliffs Natural Resources Inc. and Subsidiaries
Notes to Consolidated Financial Statements — (Continued)
NOTE 8 — FAIR VALUE OF FINANCIAL INSTRUMENTS
The following represents the assets and liabilities of the Company measured at fair value at December 31, 2009 and 2008:
| (In Millions) | ||||||||||||
| December 31, 2009 | ||||||||||||
| Description |
Quoted Prices in Active Markets for Identical Assets/Liabilities (Level 1) |
Significant Other Observable Inputs (Level 2) |
Significant Unobservable Inputs (Level 3) |
Total | ||||||||
| Assets: |
||||||||||||
| Cash equivalents |
$ | 376.0 | $ | — | $ | — | $ | 376.0 | ||||
| Derivative assets |
— | — | 63.2 | 63.2 | ||||||||
| Marketable securities |
81.0 | — | — | 81.0 | ||||||||
| Foreign exchange contracts |
— | 4.2 | — | 4.2 | ||||||||
| Total |
$ | 457.0 | $ | 4.2 | $ | 63.2 | $ | 524.4 | ||||
We had no financial instruments measured at fair value that were in a liability position at December 31, 2009.
| (In Millions) | ||||||||||||
| December 31, 2008 | ||||||||||||
| Description |
Quoted Prices in Active Markets for Identical Assets/Liabilities (Level 1) |
Significant Other Observable Inputs (Level 2) |
Significant Unobservable Inputs (Level 3) |
Total | ||||||||
| Assets: |
||||||||||||
| Cash equivalents |
$ | 40.4 | $ | — | $ | — | $ | 40.4 | ||||
| Derivative assets |
— | — | 76.6 | 76.6 | ||||||||
| Marketable securities |
10.9 | 0.3 | — | 11.2 | ||||||||
| Foreign exchange contracts |
— | 0.9 | — | 0.9 | ||||||||
| Total |
$ | 51.3 | $ | 1.2 | $ | 76.6 | $ | 129.1 | ||||
| Liabilities: |
||||||||||||
| Interest rate swap |
$ | — | $ | 2.6 | $ | — | $ | 2.6 | ||||
| Foreign exchange contracts |
— | 111.8 | — | 111.8 | ||||||||
| Derivative liabilities |
— | — | 114.2 | 114.2 | ||||||||
| Total |
$ | — | $ | 114.4 | $ | 114.2 | $ | 228.6 | ||||
Financial assets classified in Level 1 at December 31, 2009 and 2008 include money market funds and available-for-sale marketable securities. The valuation of these instruments is determined using a market approach, taking into account current interest rates, creditworthiness, and liquidity risks in relation to current market conditions, and is based upon unadjusted quoted prices for identical assets in active markets.
The valuation of financial assets and liabilities classified in Level 2 is determined using a market approach based upon quoted prices for similar assets and liabilities in active markets, or other inputs that are observable for substantially the full term of the financial instrument. Level 2 securities primarily include derivative financial instruments valued using financial models that use as their basis readily observable market parameters. At December 31, 2009 and 2008, such derivative financial instruments include substantially all of our foreign exchange hedge contracts. As of December 31, 2008, such derivative instruments also included our interest rate swap agreement, which terminated in October 2009. The fair value of the interest rate swap and foreign exchange
119
Cliffs Natural Resources Inc. and Subsidiaries
Notes to Consolidated Financial Statements — (Continued)
hedge contracts is based on a forward LIBOR curve and forward market prices, respectively, and represents the estimated amount we would receive or pay to terminate these agreements at the reporting date, taking into account current interest rates, creditworthiness, nonperformance risk, and liquidity risks associated with current market conditions.
The derivative financial asset classified within Level 3 is an embedded derivative instrument included in certain supply agreements with one of our customers. The agreements include provisions for supplemental revenue or refunds based on the customer’s annual steel pricing at the time the product is consumed in the customer’s blast furnaces. We account for this provision as a derivative instrument at the time of sale and record this provision at fair value, based on an income approach when the product is consumed and the amounts are settled, as an adjustment to revenue. The fair value of the instrument is determined using an income approach based on an estimate of the annual realized price of hot rolled steel at the steelmaker’s facilities, and takes into consideration current market conditions and nonperformance risk.
The derivative liabilities classified within Level 3 at December 31, 2008 were comprised of two instruments. One of the instruments was a derivative included in the purchase agreement for the acquisition of the remaining 30 percent interest in United Taconite in 2008. The agreement contained a penalty provision in the event the 1.2 million tons of pellets included as part of the purchase consideration were not delivered by December 31, 2009. The penalty provision, which was not a fixed amount or a fixed amount per unit, was a net settlement feature in this arrangement, and therefore required the obligation to be accounted for as a derivative instrument, which was based on the future Eastern Canadian pellet price. The instrument was marked to fair value each reporting period until the pellets were delivered and the amounts were settled. A derivative liability of $106.5 million, representing the fair value of the pellets that had not yet been delivered, was recorded as current Derivative liabilities on the Statement of Consolidated Financial Position as of December 31, 2008. As of December 31, 2009 the entire 1.2 million tons of pellets have been delivered, thereby resulting in settlement of the derivative liability.
The Level 3 derivative liabilities at December 31, 2008 also consisted of freestanding derivatives related to certain supply agreements primarily with our Asia Pacific customers that provided for discounts on December 2008 shipments based on the ultimate settlement of the 2009 international benchmark pricing provisions. The discount provisions were characterized as freestanding derivatives and were required to be accounted for separately once the iron ore was shipped. The derivative instrument, which was settled and billed once the annual international benchmark price was settled, was marked to fair value as a revenue adjustment each reporting period based upon the estimated forward settlement until the benchmark was actually settled. The fair value of the instrument was determined based on the forward price expectation of the 2009 annual international benchmark price and took into account current market conditions and other risks, including nonperformance risk. As of December 31, 2008, the 2009 international benchmark prices had not yet settled. Therefore, we had recorded approximately $7.7 million as current Derivative liabilities on the Statement of Consolidated Financial Position at December 31, 2008. The derivative instrument was settled in the fourth quarter of 2009 upon settlement of the pricing provisions with each of our customers, and is therefore not reflected on the Statement of Consolidated Financial Position at December 31, 2009.
Substantially all of the financial assets and liabilities are carried at fair value or contracted amounts that approximate fair value. We had no financial assets and liabilities measured at fair value on a non-recurring basis at December 31, 2009 and 2008.
120
Cliffs Natural Resources Inc. and Subsidiaries
Notes to Consolidated Financial Statements — (Continued)
The following represents a reconciliation of the changes in fair value of financial instruments measured at fair value on a recurring basis using significant unobservable inputs (Level 3) for the years ended December 31, 2009 and 2008.
| (In Millions) | ||||||||||||||||
| Derivative Assets | Derivative Liabilities | |||||||||||||||
| Year Ended December 31, |
Year Ended December 31, |
|||||||||||||||
| 2009 | 2008 | 2009 | 2008 | |||||||||||||
| Beginning balance—January 1 |
$ | 76.6 | $ | 53.8 | $ | (114.2 | ) | $ | — | |||||||
| Total gains (losses) |
||||||||||||||||
| Included in earnings |
22.2 | 386.0 | 78.3 | 50.6 | ||||||||||||
| Included in other comprehensive income |
— | — | — | — | ||||||||||||
| Settlements |
(35.6 | ) | (363.2 | ) | 35.9 | 24.2 | ||||||||||
| Transfers in to Level 3 |
— | — | — | (189.0 | ) | |||||||||||
| Ending balance—December 31 |
$ | 63.2 | $ | 76.6 | $ | — | $ | (114.2 | ) | |||||||
| Total gains (losses) for the period included in earnings attributable to the change in unrealized gains or losses on assets and liabilities still held at the reporting date |
$ | 22.2 | $ | 225.5 | $ | — | $ | 50.6 | ||||||||
Gains and losses included in earnings are reported in Product revenue on the Statements of Consolidated Operations for the years ended December 31, 2009 and 2008.
The carrying amount and fair value of our long-term receivables and long-term debt at December 31, 2009 and 2008 were as follows:
| (In Millions) | ||||||||||||
| December 31, 2009 | December 31, 2008 | |||||||||||
| Carrying Value |
Fair Value |
Carrying Value |
Fair Value | |||||||||
| Long-term receivables: |
||||||||||||
| Customer supplemental payments |
$ | 21.4 | $ | 17.5 | $ | — | $ | — | ||||
| ArcelorMittal USA—Ispat receivable |
38.3 | 45.7 | 43.2 | 46.1 | ||||||||
| Asia Pacific rail credit receivable |
— | — | 0.2 | 0.2 | ||||||||
| Total long-term receivables (1) |
$ | 59.7 | $ | 63.2 | $ | 43.4 | $ | 46.3 | ||||
| Long-term debt: |
||||||||||||
| Senior notes |
$ | 325.0 | $ | 332.9 | $ | 325.0 | $ | 277.9 | ||||
| Term loan |
200.0 | 200.0 | 200.0 | 200.0 | ||||||||
| Customer borrowings |
4.6 | 4.6 | 5.4 | 5.2 | ||||||||
| Total long-term debt |
$ | 529.6 | $ | 537.5 | $ | 530.4 | $ | 483.1 | ||||
| (1) | Includes current portion. |
The terms of one of our North American Iron Ore pellet supply agreements require supplemental payments to be paid by the customer during the period 2009 through 2013, with the option to defer a portion of the 2009 monthly amount up to $22.3 million in exchange for interest payments until the deferred amount is repaid in 2013. Interest is payable by the customer quarterly beginning in September 2009 at the higher of 9 percent or the prime rate plus 350 basis points. As of December 31, 2009, we have a receivable of $21.4 million recorded in Long-term receivables on the Statement of Consolidated Financial Position reflecting the terms of this deferred
121
Cliffs Natural Resources Inc. and Subsidiaries
Notes to Consolidated Financial Statements — (Continued)
payment arrangement. The fair value of the receivable of $17.5 million at December 31, 2009 is based on a discount rate of 6.2 percent, which represents the estimated credit-adjusted risk-free interest rate for the period the receivable is outstanding.
In 2002, we entered into an agreement with Ispat that restructured the ownership of the Empire mine and increased our ownership from 46.7 percent to 79 percent in exchange for the assumption of all mine liabilities. Under the terms of the agreement, we indemnified Ispat from obligations of Empire in exchange for certain future payments to Empire and to us by Ispat of $120 million, recorded at a present value of $38.3 million and $43.2 million at December 31, 2009 and 2008, respectively. The fair value of the receivable of $45.7 million and $46.1 million at December 31, 2009 and 2008, respectively, is based on a discount rate of 5.0 percent, which represents the estimated credit-adjusted risk-free interest rate for the period the receivable is outstanding.
The fair value of long-term debt was determined using quoted market prices or discounted cash flows based upon current borrowing rates. The term loan and revolving loan are variable rate interest and approximate fair value. See NOTE 9 — DEBT AND CREDIT FACILITIES for further information.
NOTE 9 — DEBT AND CREDIT FACILITIES
The following represents a summary of our long-term debt as of December 31, 2009 and 2008:
| ($ in Millions) | ||||||||||||||
| December 31, 2009 | ||||||||||||||
| Debt Instrument |
Type | Average Annual Interest Rate |
Final Maturity |
Total Borrowing Capacity |
Total Principal Outstanding |
|||||||||
| Private Placement Senior Notes: |
||||||||||||||
| Series 2008A — Tranche A |
Fixed | 6.31 | % | 2013 | $ | 270.0 | $ | (270.0 | ) | |||||
| Series 2008A — Tranche B |
Fixed | 6.59 | % | 2015 | 55.0 | (55.0 | ) | |||||||
| Credit Facility: |
||||||||||||||
| Term loan |
Variable | 1.43 | %(1) | 2012 | 200.0 | (200.0 | ) | |||||||
| Revolving loan |
Variable | — | %(1) | 2012 | 600.0 | — | (2) | |||||||
| Total |
$ | 1,125.0 | $ | (525.0 | ) | |||||||||
| December 31, 2008 | ||||||||||||||
| Debt Instrument |
Type | Average Annual Interest Rate |
Final Maturity |
Total Borrowing Capacity |
Total Principal Outstanding |
|||||||||
| Private Placement Senior Notes: |
||||||||||||||
| Series 2008A — Tranche A |
Fixed | 6.31 | % | 2013 | $ | 270.0 | $ | (270.0 | ) | |||||
| Series 2008A — Tranche B |
Fixed | 6.59 | % | 2015 | 55.0 | (55.0 | ) | |||||||
| Credit Facility: |
||||||||||||||
| Term loan |
Variable | 5.02 | %(1) | 2012 | 200.0 | (200.0 | ) | |||||||
| Revolving loan |
Variable | — | %(1) | 2012 | 600.0 | — | (2) | |||||||
| Total |
$ | 1,125.0 | $ | (525.0 | ) | |||||||||
| (1) | After the effect of interest rate hedging, the average annual borrowing rate for outstanding revolving and term loans was 1.43% and 5.10% as of December 31, 2009 and 2008, respectively. |
| (2) | As of December 31, 2009 and 2008, no revolving loans were drawn under the credit facility; however, the principal amount of letter of credit obligations totaled $31.4 million and $21.5 million, respectively, reducing available borrowing capacity to $568.6 million and $578.5 million, respectively. |
122
Cliffs Natural Resources Inc. and Subsidiaries
Notes to Consolidated Financial Statements — (Continued)
Private Placement Senior Notes
On June 25, 2008, we entered into a $325 million private placement consisting of $270 million of 6.31 percent Five-Year Senior Notes due June 15, 2013, and $55 million of 6.59 percent Seven-Year Senior Notes due June 15, 2015. Interest is paid on the notes for both tranches on June 15 and December 15 until their respective maturities. The notes are unsecured obligations with interest and principal amounts guaranteed by certain of our domestic subsidiaries. The notes and guarantees were not required to be registered under the Securities Act of 1933, as amended, and were placed with qualified institutional investors. We used the proceeds to repay senior unsecured indebtedness and for general corporate purposes.
The terms of the private placement senior notes contain customary covenants that require compliance with certain financial covenants based on: (1) debt to earnings ratio (Total Funded Debt to Consolidated EBITDA, as those terms are defined in the agreement, for the preceding four quarters cannot exceed 3.25 to 1.0 on the last day of any fiscal quarter) and (2) interest coverage ratio (Consolidated EBITDA to Interest Expense, as those terms are defined in the agreement, for the preceding four quarters must not be less than 2.5 to 1.0 on the last day of any fiscal quarter). As of December 31, 2009 and 2008, we were in compliance with the financial covenants in the note purchase agreement.
Credit Facility
On August 17, 2007, we entered into a five-year unsecured credit facility with a syndicate of 13 financial institutions. The facility provides $800 million in borrowing capacity, comprised of $200 million in term loans and $600 million in revolving loans, swing loans and letters of credit. Effective October 29, 2009, we amended the terms of our $800 million credit facility. The amendment resulted in, among other things, an increase in the sub-limit for letters of credit from $50 million to $150 million, the addition of multi-currency letters of credit, and more liberally defined financial covenants and debt restrictions. An increase of 50 basis points to the annual LIBOR margin resulted from this amendment.
Loans are drawn with a choice of interest rates and maturities, subject to the terms of the agreement. Pursuant to the amendment described above, interest rates are either (1) a range from LIBOR plus 0.95 percent to LIBOR plus 1.625 percent based on debt and earnings levels, or (2) the highest of the Federal Funds Rate plus 0.50 percent, the prime rate plus a range of 0 to 0.625 percent, or the one-month LIBOR rate plus 1.0 percent based on debt and earnings levels.
The credit facility has two financial covenants based on: (1) debt to earnings ratio (Total Funded Debt to Consolidated EBITDA, as those terms are defined in the agreement, for the preceding four quarters cannot exceed 3.25 to 1.0 on the last day of any fiscal quarter) and (2) interest coverage ratio (Consolidated EBITDA to Interest Expense, as those terms are defined in the agreement, for the preceding four quarters must not be less than 2.5 to 1.0 on the last day of any fiscal quarter). Prior to the October 29, 2009 credit facility amendment the interest coverage ratio was calculated based on Consolidated EBIT to Interest Expense for the preceding four quarters and could not be less than 3.0 to 1.0 on the last day of any fiscal quarter. The amendment provides more liberally defined financial covenants. As of December 31, 2009 and 2008, we were in compliance with the financial covenants in the credit agreement.
Short-term Facilities
On February 9, 2009, Asia Pacific Iron Ore amended its A$40 million ($35.7 million) multi-option facility to include an additional A$80 million ($71.4 million) cash facility, which expired on August 31, 2009. The remaining A$40 million multi-option facility provides credit for contingent instruments, such as performance bonds, and expires on February 28, 2010. The outstanding bank commitments on the multi-option facility totaled A$20.4 million ($18.2 million) and A$27.2 million ($18.8 million) in performance bonds, reducing borrowing capacity to A$19.6 million ($17.5 million) and A$12.8 million ($8.8 million) at December 31, 2009 and 2008,
123
Cliffs Natural Resources Inc. and Subsidiaries
Notes to Consolidated Financial Statements — (Continued)
respectively. The facility agreement contains financial covenants as follows: (1) debt to earnings ratio and (2) interest coverage ratio. As of December 31, 2009 and 2008, we were in compliance with the financial covenants of the credit facility agreement. We have provided a guarantee of the facility, along with certain of our Australian subsidiaries.
Latin America
At December 31, 2009 and 2008, Amapá had total project debt outstanding of approximately $530 million and $493 million, respectively, for which we have provided a several guarantee on our 30 percent share. Our estimate of the aggregate fair value of the outstanding guarantee is $6.7 million as of December 31, 2009 and 2008, which is reflected in Other Liabilities on the Statements of Consolidated Financial Position. The fair value was estimated using a discounted cash flow model based upon the spread between guaranteed and non-guaranteed debt over the period the debt is expected to be outstanding. On October 1, 2009, $20.9 million of short-term debt was repaid. An additional $180.5 million of short-term debt was due and repaid on February 17, 2010.
Amapá is currently in violation of certain operating and financial loan covenants contained in the debt agreements. However, Amapá and its lenders have agreed to waive these covenants through May 31, 2010 related to the remaining debt outstanding. If Amapá is unable to either renegotiate the terms of the debt agreements or obtain further extension of the compliance waivers, violation of the operating and financial loan covenants may result in the lenders calling the debt, thereby requiring us to recognize and repay our share of the debt in accordance with the provisions of the guarantee arrangement.
Debt Maturities
Maturities of debt instruments based on the principal amounts outstanding at December 31, 2009, total $5 million in 2010, $0 million in 2011, $200 million in 2012, $270 million in 2013, $0 million in 2014 and $55 million thereafter.
Refer to NOTE 8 — FAIR VALUE OF FINANCIAL INSTRUMENTS for further information.
NOTE 10 — LEASE OBLIGATIONS
We lease certain mining, production and other equipment under operating and capital leases. The leases are for varying lengths, generally at market interest rates and contain purchase and/or renewal options at the end of the terms. Our operating lease expense was $25.5 million, $20.8 million and $14.7 million in 2009, 2008 and 2007, respectively. Capital lease assets were $167.1 million and $73.9 million at December 31, 2009 and 2008, respectively. Corresponding accumulated amortization of capital leases included in respective allowances for depreciation were $41.5 million and $18.3 million at December 31, 2009 and 2008, respectively.
In January 2009, Asia Pacific Iron Ore entered into a sale-leaseback arrangement. Under the arrangement, we sold 420 rail cars and leased them back for a period of 10 years. The leaseback has been accounted for as a capital lease. We recorded assets and liabilities under the capital lease of $42.7 million, reflecting the lower of the present value of the minimum lease payments or the fair value of the asset. No material gain or loss was realized as a result of the transaction.
124
Cliffs Natural Resources Inc. and Subsidiaries
Notes to Consolidated Financial Statements — (Continued)
Future minimum payments under capital leases and non-cancellable operating leases at December 31, 2009 are as follows:
| (In Millions) | |||||||
| Capital Leases |
Operating Leases | ||||||
| 2010 |
$ | 24.3 | $ | 22.4 | |||
| 2011 |
23.8 | 18.6 | |||||
| 2012 |
23.4 | 14.7 | |||||
| 2013 |
22.1 | 15.4 | |||||
| 2014 |
21.6 | 11.0 | |||||
| 2015 and thereafter |
68.0 | 12.2 | |||||
| Total minimum lease payments |
183.2 | $ | 94.3 | ||||
| Amounts representing interest |
49.7 | ||||||
| Present value of net minimum lease payments |
$ | 133.5 | (1) | ||||
| (1) | The total is comprised of $14.2 million and $119.3 million classified as Other current liabilities and Other liabilities, respectively, on the Statements of Consolidated Financial Position at December 31, 2009. |
Total minimum capital lease payments of $183.2 million include $16.3 million and $166.9 million, for our North American Iron Ore segment and Asia Pacific Iron Ore segment, respectively. Total minimum operating lease payments of $94.3 million include $84.4 million for our North American Iron Ore segment, $6.1 million for our Asia Pacific Iron Ore segment, and $3.8 million for our North American Coal segment.
NOTE 11 — ENVIRONMENTAL AND MINE CLOSURE OBLIGATIONS
We had environmental and mine closure liabilities of $132.3 million and $117.1 million at December 31, 2009 and 2008, respectively. Payments in 2009 were $1.6 million compared with $6.2 million in 2008. The following is a summary of the obligations at December 31, 2009 and 2008:
| (In Millions) | ||||||
| December 31, | ||||||
| 2009 | 2008 | |||||
| Environmental |
$ | 14.5 | $ | 16.4 | ||
| Mine closure |
||||||
| LTVSMC |
13.9 | 13.9 | ||||
| Operating mines: |
||||||
| North American Iron Ore |
56.9 | 44.1 | ||||
| North American Coal |
30.3 | 31.1 | ||||
| Asia Pacific Iron Ore |
11.4 | 7.8 | ||||
| Other |
5.3 | 3.8 | ||||
| Total mine closure |
117.8 | 100.7 | ||||
| Total environmental and mine closure obligations |
132.3 | 117.1 | ||||
| Less current portion |
8.0 | 12.2 | ||||
| Long term environmental and mine closure obligations |
$ | 124.3 | $ | 104.9 | ||
Environmental
Our mining and exploration activities are subject to various laws and regulations governing the protection of the environment. We conduct our operations to protect the public health and environment and believe our
125
Cliffs Natural Resources Inc. and Subsidiaries
Notes to Consolidated Financial Statements — (Continued)
operations are in compliance with applicable laws and regulations in all material respects. Our environmental liabilities of $14.5 million and $16.4 million at December 31, 2009 and 2008, respectively, including obligations for known environmental remediation exposures at various active and closed mining operations and other sites, have been recognized based on the estimated cost of investigation and remediation at each site. If the cost can only be estimated as a range of possible amounts with no specific amount being more likely, the minimum of the range is accrued. Future expenditures are not discounted unless the amount and timing of the cash disbursements are readily known. Potential insurance recoveries have not been reflected. Additional environmental obligations could be incurred, the extent of which cannot be assessed.
As discussed in further detail below, the environmental liability recorded at December 31, 2009 and 2008 is primarily comprised of remediation obligations related to the Rio Tinto mine site in Nevada where we are named as a PRP.
The Rio Tinto Mine Site
The Rio Tinto Mine Site is a historic underground copper mine located near Mountain City, Nevada, where tailings were placed in Mill Creek, a tributary to the Owyhee River. Site investigation and remediation work is being conducted in accordance with a Consent Order between the Nevada DEP and the RTWG composed of Cliffs, Atlantic Richfield Company, Teck Cominco American Incorporated, and E. I. du Pont de Nemours and Company. The Consent Order provides for technical review by the U.S. Department of the Interior Bureau of Indian Affairs, the U.S. Fish & Wildlife Service, U.S. Department of Agriculture Forest Service, the NDEP and the Shoshone-Paiute Tribes of the Duck Valley Reservation (collectively, “Rio Tinto Trustees”). The Consent Order is currently projected to continue with the objective of supporting the selection of the final remedy for the site. Costs are shared pursuant to the terms of a Participation Agreement between the parties of the RTWG, who have reserved the right to renegotiate any future participation or cost sharing following the completion of the Consent Order.
The Rio Tinto Trustees have made available for public comment their plans for the assessment of NRD. The RTWG commented on the plans and also are in discussions with the Rio Tinto Trustees informally about those plans. The notice of plan availability is a step in the damage assessment process. The studies presented in the plan may lead to a NRD claim under CERCLA. There is no monetized NRD claim at this time.
The focus of the RTWG has been on development of alternatives for remediation of the mine site. A draft of the alternative studies was reviewed with NDEP, the EPA and the Rio Tinto Trustees, and such alternatives have been reduced to the following: (1) tailings stabilization and long-term water treatment; and (2) removal of the tailings. As of December 31, 2009, the estimated costs of the available remediation alternatives currently range from approximately $10.0 million to $30.5 million in total for all potentially responsible parties. In recognition of the potential for an NRD claim, the parties are actively pursuing a global settlement that would include the EPA and encompass both the remedial action and the NRD issues.
On May 29, 2009, the RTWG entered into a Rio Tinto Mine Site Work and Cost Allocation Agreement (the “Allocation Agreement”) to resolve differences over the allocation of any negotiated remedy. The Allocation Agreement contemplates that the RTWG will enter into an insured fixed-price cleanup or IFC, pursuant to which a contractor would assume responsibility for the implementation and funding of the remedy in exchange for a fixed price. We are obligated to fund 32.5 percent of the IFC. In the event an IFC is not implemented, the RTWG has agreed on allocation percentages in the Allocation Agreement, with Cliffs being committed to fund 32.5 percent of any remedy. We have an environmental liability of $9.5 million and $10.7 million on the Statements of Consolidated Financial Position as of December 31, 2009 and 2008, respectively, related to this issue. We believe our current reserve is adequate to fund our anticipated portion of the IFC. While a global settlement with the EPA has not been finalized, we expect an agreement will be reached in 2010.
126
Cliffs Natural Resources Inc. and Subsidiaries
Notes to Consolidated Financial Statements — (Continued)
Mine Closure
Our mine closure obligation of $117.8 million and $100.7 million at December 31, 2009 and 2008, respectively, includes our four consolidated North American operating iron ore mines, our two operating North American coal mining complexes, our Asia Pacific operating iron ore mines, the coal mine at Sonoma and a closed operation formerly known as LTVSMC.
Management periodically performs an assessment of the obligation to determine the adequacy of the liability in relation to the closure activities still required at the LTVSMC site. The LTVSMC closure liability was $13.9 million at December 31, 2009 and 2008.
The accrued closure obligation for our active mining operations provides for contractual and legal obligations associated with the eventual closure of the mining operations. We performed a detailed assessment of our asset retirement obligations related to our active mining locations most recently in 2008 in accordance with our Company’s accounting policy, which requires us to perform an in-depth evaluation of the liability every three years in addition to routine annual assessments. We determined the obligations based on detailed estimates adjusted for factors that a market participant would consider (i.e., inflation, overhead and profit), escalated at an assumed 3.5 percent rate of inflation to the estimated closure dates, and then discounted using the current credit- adjusted risk-free interest rate based on the corresponding life of mine. The estimate also incorporates incremental increases in the closure cost estimates and changes in estimates of mine lives. The closure date for each location was determined based on the exhaustion date of the remaining iron ore reserves. The accretion of the liability and amortization of the related asset is recognized over the estimated mine lives for each location. The following represents a rollforward of our asset retirement obligation liability related to our active mining locations for the years ended December 31, 2009 and 2008:
| (In Millions) | |||||||
| December 31, | |||||||
| 2009 | 2008 | ||||||
| Asset retirement obligation at beginning of period |
$ | 86.8 | $ | 96.0 | |||
| Accretion expense |
6.8 | 7.3 | |||||
| Reclassification adjustments |
— | 1.0 | |||||
| Exchange rate changes |
3.6 | (3.1 | ) | ||||
| Revision in estimated cash flows |
6.7 | (14.4 | ) | ||||
| Asset retirement obligation at end of period |
$ | 103.9 | $ | 86.8 | |||
NOTE 12 — PENSIONS AND OTHER POSTRETIREMENT BENEFITS
We offer defined benefit pension plans, defined contribution pension plans and other postretirement benefit plans, primarily consisting of retiree healthcare benefits, to most employees in North America as part of a total compensation and benefits program. This includes employees of PinnOak, who became employees of the Company through the July 2007 acquisition. We do not have employee retirement benefit obligations at our Asia Pacific Iron Ore operations. The defined benefit pension plans are largely noncontributory and benefits are generally based on employees’ years of service and average earnings for a defined period prior to retirement or a minimum formula.
On October 6, 2008, the USW ratified a four-year labor contract, which replaced the labor agreement that expired on September 1, 2008. The agreement covers approximately 2,300 USW-represented workers at our Empire and Tilden mines in Michigan, and our United Taconite and Hibbing mines in Minnesota. The changes enhanced the minimum pension formula by increasing the benefit dollar multipliers and renewed the lump sum special payments for certain employees retiring in the near future. The changes also included renewal of payments to surviving spouses of certain retirees.
127
Cliffs Natural Resources Inc. and Subsidiaries
Notes to Consolidated Financial Statements — (Continued)
In addition, we currently provide various levels of retirement health care and OPEB to most full-time employees who meet certain length of service and age requirements (a portion of which are pursuant to collective bargaining agreements). Most plans require retiree contributions and have deductibles, co-pay requirements, and benefit limits. Most bargaining unit plans require retiree contributions and co-pays for major medical and prescription drug coverage. There is an annual limit on our cost for medical coverage under the U.S. salaried plans. The annual limit applies to each covered participant and equals $7,000 for coverage prior to age 65 and $3,000 for coverage after age 65, with the retiree’s participation adjusted based on the age at which retiree’s benefits commence. For participants at our Northshore operation, the annual limit ranges from $4,020 to $4,500 for coverage prior to age 65, and equals $2,000 for coverage after age 65. Covered participants pay an amount for coverage equal to the excess of (i) the average cost of coverage for all covered participants, over (ii) the participant’s individual limit, but in no event will the participant’s cost be less than 15 percent of the average cost of coverage for all covered participants. For Northshore participants, the minimum participant cost is a fixed dollar amount. We do not provide OPEB for most U.S. salaried employees hired after January 1, 1993. OPEB are provided through programs administered by insurance companies whose charges are based on benefits paid.
Our North American Coal segment is required under an agreement with the UMWA to pay amounts into the UMWA pension trusts based principally on hours worked by UMWA-represented employees. These multi- employer pension trusts provide benefits to eligible retirees through a defined benefit plan. The UMWA 1993 Benefit Plan is a defined contribution plan that was created as the result of negotiations for the NBCWA of 1993. The Plan provides healthcare insurance to orphan UMWA retirees who are not eligible to participate in the Combined Fund or the 1992 Benefit Fund or whose last employer signed the 1993 or later NBCWA and who subsequently goes out of business. Contributions to the Trust are at a rate of $5.27 per hour worked in 2009 and 2008 and amounted to $6.1 million in 2009 and $9.8 million in 2008.
Pursuant to the four-year labor agreements reached with the USW for U.S. employees, effective January 1, 2009, negotiated plan changes removed the cap on our share of future bargaining unit retirees’ healthcare premiums and provided a maximum on the amount retirees will contribute for health care benefits during the term of the agreement. The agreements also provide that we and our partners fund an estimated $90 million into bargaining unit pension plans and VEBAs during the term of the contracts.
In December 2003, The Medicare Prescription Drug, Improvement, and Modernization Act of 2003 was enacted. This act introduced a prescription drug benefit under Medicare Part D as well as a federal subsidy to sponsors of retiree healthcare benefit plans that provide a benefit that is at least actuarially equivalent to Medicare Part D. Our measures of the accumulated postretirement benefit obligation and net periodic postretirement benefit cost as of December 31, 2004, and for periods thereafter reflect amounts associated with the subsidy. As a result, OPEB expense for 2009, 2008 and 2007 reflect estimated cost reductions of $3.8 million, $2.8 million and $2.5 million, respectively. We elected to adopt the retroactive transition method for recognizing the OPEB cost reduction in 2004. The following table summarizes the annual costs related to the retirement plans for 2009, 2008 and 2007:
| (In Millions) | |||||||||
| 2009 | 2008 | 2007 | |||||||
| Defined benefit pension plans |
$ | 50.8 | $ | 20.3 | $ | 17.4 | |||
| Defined contribution pension plans |
2.1 | 7.2 | 5.1 | ||||||
| Other postretirement benefits |
25.5 | 8.6 | 4.4 | ||||||
| Total |
$ | 78.4 | $ | 36.1 | $ | 26.9 | |||
The following tables and information provide additional disclosures for our consolidated plans.
128
Cliffs Natural Resources Inc. and Subsidiaries
Notes to Consolidated Financial Statements — (Continued)
Obligations and Funded Status
The following tables and information provide additional disclosures for the years ended December 31, 2009 and 2008:
| (In Millions) | ||||||||||||||||
| Pension Benefits | Other Benefits | |||||||||||||||
| Change in benefit obligations: |
2009 | 2008 | 2009 | 2008 | ||||||||||||
| Benefit obligations — beginning of year |
$ | 706.6 | $ | 680.8 | $ | 307.4 | $ | 252.7 | ||||||||
| Service cost (excluding expenses) |
14.3 | 12.6 | 5.4 | 3.4 | ||||||||||||
| Interest cost |
42.6 | 41.4 | 18.9 | 16.3 | ||||||||||||
| Plan amendments |
3.0 | 6.7 | — | 33.7 | ||||||||||||
| Actuarial loss (gain) |
38.6 | 11.7 | 19.5 | 16.2 | ||||||||||||
| Benefits paid |
(54.3 | ) | (46.6 | ) | (22.8 | ) | (19.7 | ) | ||||||||
| Participant contributions |
— | — | 3.7 | 3.6 | ||||||||||||
| Federal subsidy on benefits paid |
— | — | 0.9 | 1.2 | ||||||||||||
| Benefit obligations — end of year |
$ | 750.8 | $ | 706.6 | $ | 333.0 | $ | 307.4 | ||||||||
| Change in plan assets: |
||||||||||||||||
| Fair value of plan assets — beginning of year |
$ | 456.0 | $ | 596.3 | $ | 91.6 | $ | 126.7 | ||||||||
| Actual return on plan assets |
63.0 | (118.2 | ) | 27.8 | (39.8 | ) | ||||||||||
| Employer contributions |
18.5 | 24.9 | 17.4 | 4.8 | ||||||||||||
| Asset transfers |
0.2 | (0.4 | ) | — | — | |||||||||||
| Benefits paid |
(54.3 | ) | (46.6 | ) | (0.1 | ) | (0.1 | ) | ||||||||
| Fair value of plan assets — end of year |
$ | 483.4 | $ | 456.0 | $ | 136.7 | $ | 91.6 | ||||||||
| Funded status at December 31: |
||||||||||||||||
| Fair value of plan assets |
$ | 483.4 | $ | 456.0 | $ | 136.7 | $ | 91.6 | ||||||||
| Benefit obligations |
(750.8 | ) | (706.6 | ) | (333.0 | ) | (307.4 | ) | ||||||||
| Funded status (plan assets less benefit obligations) |
$ | (267.4 | ) | $ | (250.6 | ) | $ | (196.3 | ) | $ | (215.8 | ) | ||||
| Amount recognized at December 31 |
$ | (267.4 | ) | $ | (250.6 | ) | $ | (196.3 | ) | $ | (215.8 | ) | ||||
| Amounts recognized in Statements of Financial Position: |
||||||||||||||||
| Current liabilities |
$ | (0.1 | ) | $ | (0.5 | ) | $ | (17.8 | ) | $ | (17.9 | ) | ||||
| Noncurrent liabilities |
(267.3 | ) | (250.1 | ) | (178.5 | ) | (197.9 | ) | ||||||||
| Net amount recognized |
$ | (267.4 | ) | $ | (250.6 | ) | $ | (196.3 | ) | $ | (215.8 | ) | ||||
| Amounts recognized in accumulated other comprehensive income: |
||||||||||||||||
| Net actuarial loss |
$ | 313.7 | $ | 327.8 | $ | 120.9 | $ | 131.3 | ||||||||
| Prior service (credit) cost |
23.9 | 25.2 | 13.5 | 15.3 | ||||||||||||
| Transition asset |
— | — | (9.1 | ) | (12.1 | ) | ||||||||||
| Net amount recognized |
$ | 337.6 | $ | 353.0 | $ | 125.3 | $ | 134.5 | ||||||||
| The estimated amounts that will be amortized from accumulated other |
||||||||||||||||
| Net actuarial loss |
$ | 23.8 | $ | 9.7 | ||||||||||||
| Prior service cost |
4.2 | 1.7 | ||||||||||||||
| Transition asset |
— | (3.0 | ) | |||||||||||||
| Net amount recognized |
$ | 28.0 | $ | 8.4 | ||||||||||||
129
Cliffs Natural Resources Inc. and Subsidiaries
Notes to Consolidated Financial Statements — (Continued)
| (In Millions) | ||||||||||||||||||||||||||||||||
| 2009 | ||||||||||||||||||||||||||||||||
| Pension Plans | Other Benefits | |||||||||||||||||||||||||||||||
| Salaried | Hourly | Mining | SERP | Total | Salaried | Hourly | Total | |||||||||||||||||||||||||
| Fair value of plan assets |
$ | 177.4 | $ | 305.0 | $ | 1.0 | $ | — | $ | 483.4 | $ | — | $ | 136.7 | $ | 136.7 | ||||||||||||||||
| Benefit obligation |
(261.3 | ) | (480.1 | ) | (3.6 | ) | (5.8 | ) | (750.8 | ) | (50.4 | ) | (282.6 | ) | (333.0 | ) | ||||||||||||||||
| Funded status |
$ | (83.9 | ) | $ | (175.1 | ) | $ | (2.6 | ) | $ | (5.8 | ) | $ | (267.4 | ) | $ | (50.4 | ) | $ | (145.9 | ) | $ | (196.3 | ) | ||||||||
| 2008 | ||||||||||||||||||||||||||||||||
| Pension Plans | Other Benefits | |||||||||||||||||||||||||||||||
| Salaried | Hourly | Mining | SERP | Total | Salaried | Hourly | Total | |||||||||||||||||||||||||
| Fair value of plan assets |
$ | 178.2 | $ | 277.6 | $ | 0.2 | $ | — | $ | 456.0 | $ | — | $ | 91.6 | $ | 91.6 | ||||||||||||||||
| Benefit obligation |
(250.4 | ) | (449.2 | ) | (2.0 | ) | (5.0 | ) | (706.6 | ) | (52.4 | ) | (255.0 | ) | (307.4 | ) | ||||||||||||||||
| Funded status |
$ | (72.2 | ) | $ | (171.6 | ) | $ | (1.8 | ) | $ | (5.0 | ) | $ | (250.6 | ) | $ | (52.4 | ) | $ | (163.4 | ) | $ | (215.8 | ) | ||||||||
The accumulated benefit obligation for all defined benefit pension plans was $733.1 million and $693.2 million at December 31, 2009 and 2008, respectively.
Components of Net Periodic Benefit Cost
| (In Millions) | ||||||||||||||||||||||||
| Pension Benefits | Other Benefits | |||||||||||||||||||||||
| 2009 | 2008 | 2007 | 2009 | 2008 | 2007 | |||||||||||||||||||
| Service cost |
$ | 14.3 | $ | 12.6 | $ | 11.4 | $ | 5.4 | $ | 3.4 | $ | 2.1 | ||||||||||||
| Interest cost |
42.6 | 41.4 | 38.9 | 18.9 | 16.3 | 14.5 | ||||||||||||||||||
| Expected return on plan assets |
(37.1 | ) | (48.3 | ) | (47.1 | ) | (9.1 | ) | (10.4 | ) | (10.1 | ) | ||||||||||||
| Amortization: |
||||||||||||||||||||||||
| Net asset |
— | — | — | (3.0 | ) | (3.0 | ) | (3.0 | ) | |||||||||||||||
| Prior service costs (credits) |
4.2 | 4.0 | 3.8 | 1.8 | (3.8 | ) | (5.6 | ) | ||||||||||||||||
| Net actuarial loss |
26.8 | 10.6 | 10.4 | 11.5 | 6.1 | 6.5 | ||||||||||||||||||
| Net periodic benefit cost |
$ | 50.8 | $ | 20.3 | $ | 17.4 | $ | 25.5 | $ | 8.6 | $ | 4.4 | ||||||||||||
| Current year actuarial (gain)/loss |
12.1 | 178.2 | (24.0 | ) | 2.2 | 66.6 | (24.5 | ) | ||||||||||||||||
| Amortization of net loss |
(26.8 | ) | (10.6 | ) | (10.4 | ) | (11.5 | ) | (6.1 | ) | (6.5 | ) | ||||||||||||
| Current year prior service cost |
3.0 | 6.7 | — | — | 33.7 | — | ||||||||||||||||||
| Amortization of prior service (cost) credit |
(4.2 | ) | (4.0 | ) | (3.8 | ) | (1.8 | ) | 3.8 | 5.6 | ||||||||||||||
| Amortization of transition asset |
— | — | — | 3.0 | 3.0 | 3.0 | ||||||||||||||||||
| Total recognized in other comprehensive income |
$ | (15.9 | ) | $ | 170.3 | $ | (38.2 | ) | $ | (8.1 | ) | $ | 101.0 | $ | (22.4 | ) | ||||||||
| Total recognized in net periodic cost and other comprehensive income |
$ | 34.9 | $ | 190.6 | $ | (20.8 | ) | $ | 17.4 | $ | 109.6 | $ | (18.0 | ) | ||||||||||
Additional Information
| (In Millions) | ||||||||||||||||||||
| Pension Benefits | Other Benefits | |||||||||||||||||||
| 2009 | 2008 | 2007 | 2009 | 2008 | 2007 | |||||||||||||||
| Effect of change in mine ownership & noncontrolling interest |
$ | 50.9 | $ | 50.4 | $ | 45.8 | $ | 10.1 | $ | 8.6 | $ | 5.4 | ||||||||
| Actual return on plan assets |
63.0 | (118.2 | ) | 41.5 | 27.8 | (39.8 | ) | 6.6 | ||||||||||||
130
Cliffs Natural Resources Inc. and Subsidiaries
Notes to Consolidated Financial Statements — (Continued)
Assumptions
We used a discount rate in 2009 of 5.66 percent, compared with a discount rate of 6.00 percent in 2008. The U.S. discount rates are determined by matching the projected cash flows used to determine the PBO and APBO to a projected yield curve of over 400 Aa graded bonds in the 10th to 90th percentiles. These bonds are either noncallable or callable with make-whole provisions. The duration matching produced rates ranging from 5.49 percent to 5.80 percent for our plans. Based upon these results, we selected a December 31, 2009 discount rate of 5.66 percent for our plans.
Weighted-average assumptions used to determine benefit obligations at December 31 were:
| Pension Benefits | Other Benefits | |||||||||||
| 2009 | 2008 | 2009 | 2008 | |||||||||
| Discount rate |
5.66 | % | 6.00 | % | 5.66 | % | 6.00 | % | ||||
| Rate of compensation increase |
4.00 | 4.00 | 4.00 | 4.00 | ||||||||
Weighted-average assumptions used to determine net benefit cost for the years 2009, 2008 and 2007 were:
| Pension Benefits | Other Benefits | |||||||||||||||||
| 2009 | 2008 | 2007 | 2009 | 2008 | 2007 | |||||||||||||
| Discount rate |
6.00 | % | 6.00/7.00 | % | 5.75 | % | 6.00 | % | 6.00 | % | 5.75 | % | ||||||
| Expected return on plan assets |
8.50 | 8.50 | 8.50 | 8.50 | 8.50 | 8.50 | ||||||||||||
| Rate of compensation increase |
4.00 | 4.13 | 4.16 | 4.00 | 4.50 | 4.50 | ||||||||||||
Assumed health care cost trend rates at December 31 were:
| 2009 | 2008 | |||||
| Health care cost trend rate assumed for next year |
8.00 | % | 6.50 | % | ||
| Ultimate health care cost trend rate |
5.00 | 5.00 | ||||
| Year that the ultimate rate is reached |
2016 | 2012 |
Assumed health care cost trend rates have a significant effect on the amounts reported for the health care plans. A change of one percentage point in assumed health care cost trend rates would have the following effects:
| (In Millions) | |||||||
| Increase | Decrease | ||||||
| Effect on total of service and interest cost |
$ | 3.4 | $ | (2.7 | ) | ||
| Effect on postretirement benefit obligation |
35.0 | (28.9 | ) | ||||
Plan Assets
The Company’s financial objectives with respect to our pension and VEBA plan assets are to fully fund the actuarial accrued liability for each of the plans, to maximize investment returns within reasonable and prudent levels of risk, and to maintain sufficient liquidity to meet benefit obligations on a timely basis.
Our investment objective is to outperform the expected Return on Asset (“ROA”) assumption used in the plans’ actuarial reports over a full market cycle, which is considered a period during which the U.S. economy experiences the effects of both an upturn and a downturn in the level of economic activity. In general, these periods tend to last between three and five years. The expected ROA takes into account historical returns and estimated future long-term returns based on capital market assumptions applied to the asset allocation strategy.
The asset allocation strategy is determined through a detailed analysis of assets and liabilities by plan which defines the overall risk that is acceptable with regard to the expected level and variability of portfolio returns, surplus (assets compared to liabilities), contributions, and pension expense.
131
Cliffs Natural Resources Inc. and Subsidiaries
Notes to Consolidated Financial Statements — (Continued)
The asset allocation process involves simulating the effect of financial market performance for various asset allocation scenarios and factoring in the current funded status and likely future funded status levels by taking into account expected growth or decline in the contributions over time. The modeling is then adjusted by simulating unexpected changes in inflation and interest rates. The process also includes quantifying the effect of investment performance and simulated changes to future levels of contributions, determining the appropriate asset mix with the highest likelihood of meeting financial objectives, and regularly reviewing our asset allocation strategy.
The asset allocation strategy varies by plan. The following table reflects the actual asset allocations for pension and VEBA plan assets as of December 31, 2009 and 2008, as well as the 2010 weighted average target asset allocations as of December 31, 2009. Equity investments include securities in large-cap, mid-cap and small-cap companies located in the U.S. and worldwide. Fixed income investments primarily include corporate bonds and government debt securities. Alternative investments include hedge funds, private equity, structured credit and real estate.
| Pension Assets | VEBA Assets | |||||||||||||||||
| Asset Category | 2010 Target Allocation |
Percentage of Plan Assets at December 31, |
2010 Target Allocation |
Percentage of Plan Assets at December 31, |
||||||||||||||
| 2009 | 2008 | 2009 | 2008 | |||||||||||||||
| Equity Securities |
37.0 | % | 37.5 | % | 35.8 | % | 42.0 | % | 46.4 | % | 41.8 | % | ||||||
| Fixed Income |
30.0 | 29.9 | 32.8 | 35.0 | 38.3 | 36.6 | ||||||||||||
| Hedge Funds |
15.0 | 14.8 | 15.2 | 15.0 | 10.7 | 14.8 | ||||||||||||
| Private Equity |
9.0 | 6.6 | 7.4 | 8.0 | 4.4 | 6.6 | ||||||||||||
| Structured Credit |
5.0 | 8.1 | 3.5 | — | — | — | ||||||||||||
| Real Estate |
4.0 | 3.0 | 5.2 | — | — | — | ||||||||||||
| Cash |
— | 0.1 | 0.1 | — | 0.2 | 0.2 | ||||||||||||
| Total |
100.0 | % | 100.0 | % | 100.0 | % | 100.0 | % | 100.0 | % | 100.0 | % | ||||||
Pension
The fair values of our pension plan assets at December 31, 2009 by asset category are as follows:
| (In Millions) | ||||||||||||
| December 31, 2009 | ||||||||||||
| Asset Category |
Quoted Prices in Active Markets for Identical Assets/Liabilities (Level 1) |
Significant Other Observable Inputs (Level 2) |
Significant Unobservable Inputs (Level 3) |
Total | ||||||||
| Equity securities: |
||||||||||||
| U.S. large-cap |
$ | 88.1 | $ | — | $ | — | $ | 88.1 | ||||
| U.S. small/mid-cap |
35.1 | — | — | 35.1 | ||||||||
| International |
57.8 | — | — | 57.8 | ||||||||
| Fixed income |
144.8 | — | — | 144.8 | ||||||||
| Hedge funds |
— | — | 71.4 | 71.4 | ||||||||
| Private equity |
13.6 | 18.2 | 31.8 | |||||||||
| Structured credit |
— | — | 39.1 | 39.1 | ||||||||
| Real estate |
— | — | 14.4 | 14.4 | ||||||||
| Cash |
0.9 | — | — | 0.9 | ||||||||
| Total |
$ | 340.3 | $ | — | $ | 143.1 | $ | 483.4 | ||||
Following is a description of the inputs and valuation methodologies used to measure the fair value of our plan assets.
132
Cliffs Natural Resources Inc. and Subsidiaries
Notes to Consolidated Financial Statements — (Continued)
Equity Securities
Equity securities classified as Level 1 investments include U.S. large, small and mid-cap investments and international equity. These investments are comprised of securities listed on an exchange, market or automated quotation system for which quotations are readily available. The valuation of these securities is determined using a market approach, and is based upon unadjusted quoted prices for identical assets in active markets.
Fixed Income
Fixed income securities classified as Level 1 investments include bonds and government debt securities. These investments are comprised of securities listed on an exchange, market or automated quotation system for which quotations are readily available. The valuation of these securities is determined using a market approach, and is based upon unadjusted quoted prices for identical assets in active markets.
Hedge Funds
Hedge funds are alternative investments comprised of direct or indirect investment in offshore hedge funds of funds with an investment objective to achieve an attractive risk-adjusted return with moderate volatility and moderate directional market exposure over a full market cycle. The valuation techniques used to measure fair value attempt to maximize the use of observable inputs and minimize the use of unobservable inputs. Considerable judgment is required to interpret the factors used to develop estimates of fair value. Valuations of the underlying investment funds are obtained and reviewed. The securities that are valued by the funds are interests in the investment funds and not the underlying holdings of such investment funds. Thus, the inputs used to value the investments in each of the underlying funds may differ from the inputs used to value the underlying holdings of such funds.
In determining the fair value of a security, the fund managers may consider any information that is deemed relevant, which may include one or more of the following factors regarding the portfolio security, if appropriate: type of security or asset; cost at the date of purchase; size of holding; last trade price; most recent valuation; fundamental analytical data relating to the investment in the security; nature and duration of any restriction on the disposition of the security; evaluation of the factors that influence the market in which the security is purchased or sold; financial statements of the issuer; discount from market value of unrestricted securities of the same class at the time of purchase; special reports prepared by analysts; information as to any transactions or offers with respect to the security; existence of merger proposals or tender offers affecting the security; price and extent of public trading in similar securities of the issuer or compatible companies and other relevant matters; changes in interest rates; observations from financial institutions; domestic or foreign government actions or pronouncements; other recent events; existence of shelf registration for restricted securities; existence of any undertaking to register the security; and other acceptable methods of valuing portfolio securities.
Hedge fund investments are valued monthly and recorded on a one-month lag. For alternative investment values reported on a lag, current market information is reviewed for any material changes in values at the reporting date. Share repurchases are available quarterly with notice of 65 business days.
Private Equity Funds
The private equity fund is an alternative investment that represents direct or indirect investments in partnerships, venture funds or a diversified pool of private investment vehicles (fund of funds).
Investment commitments are made in private equity funds of funds based on an asset allocation strategy, and capital calls are made over the life of the funds to fund the commitments. Until commitments are funded, the committed amount is reserved and invested in a selection of public equity mutual funds, including U.S. large, small and mid-cap investments and international equity, designed to approximate overall equity market returns. As of December 31, 2009, remaining commitments total $23.4 million, of which $16.5 million is reserved. Refer to the valuation methodologies for equity securities above for further information.
133
Cliffs Natural Resources Inc. and Subsidiaries
Notes to Consolidated Financial Statements — (Continued)
The valuation of investments in private equity funds of funds is initially performed by the underlying fund managers. In determining the fair value, the fund managers may consider any information that is deemed relevant, which may include: type of security or asset; cost at the date of purchase; size of holding; last trade price; most recent valuation; fundamental analytical data relating to the investment in the security; nature and duration of any restriction on the disposition of the security; evaluation of the factors that influence the market in which the security is purchased or sold; financial statements of the issuer; discount from market value of unrestricted securities of the same class at the time of purchase; special reports prepared by analysts; information as to any transactions or offers with respect to the security; existence of merger proposals or tender offers affecting the security; price and extent of public trading in similar securities of the issuer or compatible companies and other relevant matters; changes in interest rates; observations from financial institutions; domestic or foreign government actions or pronouncements; other recent events; existence of shelf registration for restricted securities; existence of any undertaking to register the security; and other acceptable methods of valuing portfolio securities.
The valuations are obtained from the underlying fund managers, and the valuation methodology and process is reviewed for consistent application and adherence to policies. Considerable judgment is required to interpret the factors used to develop estimates of fair value.
Private equity investments are valued quarterly and recorded on a one-quarter lag. For alternative investment values reported on a lag, current market information is reviewed for any material changes in values at the reporting date. Capital distributions for the funds do not occur on a regular frequency. Liquidation of these investments would require sale of the partnership interest.
Structured Credit
Structured credit investments are alternative investments comprised of collateralized debt obligations and other structured credit investments that are priced based on valuations provided by independent, third-party pricing agents, if available. Such values generally reflect the last reported sales price if the security is actively traded. The third-party pricing agents may also value structured credit investments at an evaluated bid price by employing methodologies that utilize actual market transactions, broker-supplied valuations, or other methodologies designed to identify the market value of such securities. Such methodologies generally consider such factors as security prices, yields, maturities, call features, ratings and developments relating to specific securities in arriving at valuations. Securities listed on a securities exchange, market or automated quotation system for which quotations are readily available are valued at the last quoted sale price on the primary exchange or market on which they are traded. Debt obligations with remaining maturities of 60 days or less may be valued at amortized cost, which approximates fair value.
Structured credit investments are valued monthly and recorded on a one-month lag. For alternative investment values reported on a lag, current market information is reviewed for any material changes in values at the reporting date. Redemption requests are considered quarterly subject to notice of 90 days; however, share repurchases are not permitted for a two-year lock-up period following each investment, which will expire in September 2010 for the plans’ initial investments.
Real Estate
The real estate portfolio is an alternative investment comprised of three funds with strategic categories of real estate investments. All real estate holdings are externally appraised at least annually, and appraisals are conducted by reputable, independent appraisal firms that are members of the Appraisal Institute. All external appraisals are performed in accordance with the Uniform Standards of Professional Appraisal Practices. The property valuations and assumptions of each property are reviewed quarterly by the investment advisor and values are adjusted if there has been a significant change in circumstances relating to the property since the last external appraisal. The valuation methodology utilized in determining the fair value is consistent with the best
134
Cliffs Natural Resources Inc. and Subsidiaries
Notes to Consolidated Financial Statements — (Continued)
practices prevailing within the real estate appraisal and real estate investment management industries, including the Real Estate Information Standards, and standards promulgated by the National Council of Real Estate Investment Fiduciaries, the National Association of Real Estate Investment Fiduciaries, and the National Association of Real Estate Managers. In addition, the investment advisor may cause additional appraisals to be performed. Two of the funds’ fair values are updated monthly, and there is no lag in reported values. Redemption requests for these two funds are considered on a quarterly basis, subject to notice of 45 days.
Effective October 1, 2009, one of the real estate funds began an orderly wind-down over the next three to four years. The decision to wind down the fund was driven primarily by real estate market factors that adversely affected the availability of new investor capital. Third-party appraisals of this fund’s assets will be eliminated; however, internal valuation updates for all assets and liabilities of the fund will be prepared quarterly. The fund’s asset values are recorded on a one-quarter lag, and current market information is reviewed for any material changes in values at the reporting date. Distributions from sales of properties will be made on pro-rata basis. Repurchase requests will not be honored during the wind-down period.
The following represents the effect of fair value measurements using significant unobservable inputs (Level 3) on changes in plan assets for the year ended December 31, 2009:
| (In Millions) | |||||||||||||||||
| Year Ended December 31, 2009 | |||||||||||||||||
| Hedge Funds | Private Equity Funds |
Structured Credit Fund |
Real Estate |
Total | |||||||||||||
| Beginning balance—January 1, 2009 |
$ | 69.3 | $ | 21.0 | $ | 15.9 | $ | 23.5 | $ | 129.7 | |||||||
| Actual return on plan assets: |
|||||||||||||||||
| Relating to assets still held at the reporting date |
2.1 | (5.6 | ) | 23.2 | (9.5 | ) | 10.2 | ||||||||||
| Relating to assets sold during the period |
— | (0.5 | ) | — | 0.6 | 0.1 | |||||||||||
| Purchases, sales and settlements |
— | 3.3 | — | (0.2 | ) | 3.1 | |||||||||||
| Transfers in (out) of Level 3 |
— | — | — | — | — | ||||||||||||
| Ending balance—December 31, 2009 |
$ | 71.4 | $ | 18.2 | $ | 39.1 | $ | 14.4 | $ | 143.1 | |||||||
The pension plan assets and asset allocation at December 31, 2008 were as follows:
| Asset Category (1) |
(In Millions) Assets at December 31, |
Percentage of Plan Assets at December 31, |
||||
| 2008 | 2008 | |||||
| Equity securities |
$ | 163.3 | 35.8 | % | ||
| Fixed income |
149.6 | 32.8 | ||||
| Hedge funds |
69.2 | 15.2 | ||||
| Private equity |
33.9 | 7.4 | ||||
| Structured credit |
15.8 | 3.5 | ||||
| Real estate |
23.5 | 5.2 | ||||
| Cash |
0.7 | 0.1 | ||||
| Total |
$ | 456.0 | 100.0 | % | ||
| (1) | The 2008 presentation has been conformed in accordance with the asset categories presented for 2009. |
135
Cliffs Natural Resources Inc. and Subsidiaries
Notes to Consolidated Financial Statements — (Continued)
The expected return on plan assets takes into account the weighted average of expected returns for each asset category. Expected returns are determined based on historical performance, adjusted for current trends. The expected return is net of investment expenses.
VEBA
Assets for other benefits include VEBA trusts pursuant to bargaining agreements that are available to fund retired employees’ life insurance obligations and medical benefits. The fair values of our other benefit plan assets at December 31, 2009 by asset category are as follows:
| (In Millions) | ||||||||||||
| December 31, 2009 | ||||||||||||
| Asset Category |
Quoted Prices in Active Markets for Identical Assets/Liabilities (Level 1) |
Significant Other Observable Inputs (Level 2) |
Significant Unobservable Inputs (Level 3) |
Total | ||||||||
| Equity securities: |
||||||||||||
| U.S. large-cap |
$ | 32.8 | $ | — | $ | — | $ | 32.8 | ||||
| U.S. small/mid-cap |
12.6 | — | — | 12.6 | ||||||||
| International |
18.1 | — | — | 18.1 | ||||||||
| Fixed income |
52.4 | — | — | 52.4 | ||||||||
| Hedge funds |
— | — | 14.6 | 14.6 | ||||||||
| Private equity |
2.9 | — | 3.1 | 6.0 | ||||||||
| Cash |
0.2 | — | — | 0.2 | ||||||||
| Total |
$ | 119.0 | $ | — | $ | 17.7 | $ | 136.7 | ||||
Refer to the pension asset discussion above for further information regarding the inputs and valuation methodologies used to measure the fair value of each respective category of plan assets.
The following represents the effect of fair value measurements using significant unobservable inputs (Level 3) on changes in plan assets for the year ended December 31, 2009:
| (In Millions) | |||||||||||
| Year Ended December 31, 2009 | |||||||||||
| Hedge Funds | Private Equity Funds |
Total | |||||||||
| Beginning balance—January 1, 2009 |
$ | 13.6 | $ | 3.0 | $ | 16.6 | |||||
| Actual return on plan assets: |
|||||||||||
| Relating to assets still held at the reporting date |
0.5 | (0.9 | ) | (0.4 | ) | ||||||
| Relating to assets sold during the period |
— | — | — | ||||||||
| Purchases, sales and settlements |
0.5 | 1.0 | 1.5 | ||||||||
| Transfers in (out) of Level 3 |
— | — | — | ||||||||
| Ending balance—December 31, 2009 |
$ | 14.6 | $ | 3.1 | $ | 17.7 | |||||
136
Cliffs Natural Resources Inc. and Subsidiaries
Notes to Consolidated Financial Statements — (Continued)
The other benefit plan assets and weighted average asset allocation at December 31, 2008 were as follows:
| (In Millions) Assets at December 31, |
Percentage of Plan Assets at December 31, |
|||||
| Asset Category (1) |
2008 | 2008 | ||||
| Equity securities |
$ | 38.3 | 41.8 | % | ||
| Fixed Income |
33.5 | 36.6 | ||||
| Hedge funds |
13.6 | 14.8 | ||||
| Private Equity |
6.0 | 6.6 | ||||
| Cash |
0.2 | 0.2 | ||||
| Total |
$ | 91.6 | 100.0 | % | ||
| (1) | The 2008 presentation has been conformed in accordance with the asset categories presented for 2009. |
The expected return on plan assets takes into account the weighted average of expected returns for each asset category. Expected returns are determined based on historical performance, adjusted for current trends. The expected return is net of investment expenses.
Contributions
Annual contributions to the pension plans are made within income tax deductibility restrictions in accordance with statutory regulations. In the event of plan termination, the plan sponsors could be required to fund additional shutdown and early retirement obligations that are not included in the pension obligations.
| (In Millions) | ||||||||||||
| Company Contributions |
Pension Benefits |
Other Benefits | ||||||||||
| VEBA | Direct Payments |
Total | ||||||||||
| 2008 |
$ | 24.9 | $ | 4.8 | $ | 14.9 | $ | 19.7 | ||||
| 2009 |
18.5 | 17.4 | 18.3 | 35.7 | ||||||||
| 2010 (Expected)* |
45.9 | 17.4 | 17.8 | 35.2 | ||||||||
| * | Pursuant to the bargaining agreement, benefits can be paid from VEBA trusts that are at least 70 percent funded (no VEBA trusts are 70 percent funded at December 31, 2009). |
VEBA plans are not subject to minimum regulatory funding requirements. Amounts contributed are pursuant to bargaining agreements.
Contributions by participants to the other benefit plans were $3.7 million and $3.6 million for years ended December 31, 2009 and 2008, respectively.
Estimated Cost for 2010
For 2010, we estimate net periodic benefit cost as follows:
| (In Millions) | |||
| Defined benefit pension plans |
$ | 45.4 | |
| Other postretirement benefits |
20.0 | ||
| Total |
$ | 65.4 | |
137
Cliffs Natural Resources Inc. and Subsidiaries
Notes to Consolidated Financial Statements — (Continued)
Estimated Future Benefit Payments
| (In Millions) | ||||||||||||
| Pension Benefits |
Other Benefits | |||||||||||
| Gross Company Benefits |
Less Medicare Subsidy |
Net Company Payments | ||||||||||
| 2010 |
$ | 52.5 | $ | 18.7 | $ | 0.9 | $ | 17.8 | ||||
| 2011 |
55.7 | 20.2 | 0.9 | 19.3 | ||||||||
| 2012 |
57.9 | 21.5 | 1.0 | 20.5 | ||||||||
| 2013 |
56.9 | 22.4 | 1.1 | 21.3 | ||||||||
| 2014 |
58.2 | 23.8 | 1.3 | 22.5 | ||||||||
| 2015-2019 |
309.8 | 130.2 | 8.6 | 121.6 | ||||||||
Other Potential Benefit Obligations
While the foregoing reflects our obligation, our total exposure in the event of non-performance is potentially greater. Following is a summary comparison of the total obligation:
| (In Millions) | ||||||||
| December 31, 2009 | ||||||||
| Defined Benefit Pensions |
Other Benefits |
|||||||
| Fair value of plan assets |
$ | 483.4 | $ | 136.7 | ||||
| Benefit obligation |
750.8 | 333.0 | ||||||
| Underfunded status of plan |
$ | (267.4 | ) | $ | (196.3 | ) | ||
| Additional shutdown and early retirement benefits |
$ | 54.4 | $ | 16.4 | ||||
NOTE 13 — STOCK COMPENSATION PLANS
At December 31, 2009, we have two share-based compensation plans, which are described below. The compensation cost that has been charged against income for those plans was $12.2 million, $22.5 million, and $12.4 million in 2009, 2008 and 2007, respectively, which was recorded primarily in Selling, general and administrative expenses on the Statements of Consolidated Operations. The total income tax benefit recognized in the Statements of Consolidated Operations for share-based compensation arrangements was $4.3 million, $7.9 million and $4.3 million for 2009, 2008 and 2007, respectively. Cash flows resulting from the tax benefits for tax deductions in excess of the compensation expense are classified as financing cash flows. Accordingly, we classified $3.5 million, $3.5 million and $4.3 million in excess tax benefits as cash from financing activities rather than cash from operating activities on our Statements of Consolidated Cash Flows for the years ended December 31, 2009, 2008 and 2007, respectively.
Employees’ Plans
The Company’s 2007 ICE Plan (“Plan”) authorizes up to 4,000,000 of our common shares to be issued as stock options, SAR’s, restricted shares, restricted share units, retention units, deferred shares, and performance shares or performance units. Any of the foregoing awards may be made subject to attainment of performance goals over a performance period of one or more years. Each stock option and SAR will reduce the common shares available under the 2007 ICE Plan by one common share. Each other award will reduce the common shares available under the 2007 ICE Plan by two common shares. No participant in any fiscal year can be granted in the aggregate of a number of Shares having a Fair Market Value on the Date of Grant equal to more than $5 million. The performance shares are intended to meet the requirements of Internal Revenue code section 162(m) for deduction while the retention units are not.
138
Cliffs Natural Resources Inc. and Subsidiaries
Notes to Consolidated Financial Statements — (Continued)
For the outstanding plan year agreements, each performance share, if earned, entitles the holder to receive a number of common shares within the range between a threshold and maximum number of shares, with the actual number of common shares earned dependent upon whether the Company achieves certain objectives and performance goals as established by the Committee. The restricted share units are subject to continued employment, are retention based, will vest at the end of the performance period for the performance shares, and are payable in cash for the 2007 plan year and shares for the 2008 and 2009 plan years at a time determined by the Committee at its discretion.
The performance share grants vest over a period of three years. For the 2007 plan year agreement, performance is measured on the basis of relative TSR for the period, as measured against a predetermined peer group of mining and metals companies, three-year cumulative free cash flow and/or pre-tax RONA. Awards are intended to be paid out in common shares. The final payout for all three plan year agreements vary from zero to 150 percent of the performance shares awarded.
Upon the occurrence of a change in control, all performance shares and restricted share units granted to a participant will vest and become nonforfeitable and will be paid out in cash.
Following is a summary of our Performance Share Award Agreements currently outstanding:
| Performance Share Plan Year |
Performance Shares Outstanding |
Forfeitures (1) | Grant Date |
Performance Period | |||||
| 2009 |
365,868 | 40,722 | March 9, 2009 | 1/1/2009-12/31/2011 | |||||
| 2009 |
3,825 | — | August 31, 2009 | 1/1/2009-12/31/2011 | |||||
| 2009 |
44,673 | (2) | — | December 17, 2009 | 1/1/2009-12/31/2011 | ||||
| 2008 |
143,252 | 15,948 | March 10, 2008 | 1/1/2008-12/31/2010 | |||||
| 2008 |
350 | — | August 29, 2008 | 1/1/2008-12/31/2010 | |||||
| 2007 |
215,160 | 53,790 | July 27, 2007 | 1/1/2007-12/31/2009 | |||||
| 2007 |
3,740 | — | October 1, 2007 | 1/1/2007-12/31/2009 |
| (1) | The 2009, 2008 and 2007 Plans are based on assumed forfeitures. |
| (2) | Represents the target payout as of December 31, 2009 related to the 67,009 shares awarded on December 17, 2009 based upon the Committee’s ability to exercise negative discretion. For accounting purposes, a grant date has not yet been determined for this award. |
Throughout 2009, the Compensation and Organization Committee (“Committee”) of the Board of Directors approved grants under our shareholder approved Plan for the performance period 2009-2011. A total of 573,100 shares were granted, consisting of performance shares and units, restricted share units, retention units and restricted stock. An additional 67,009 shares were awarded under the Plan on December 17, 2009. The number of shares paid out under this particular award will be determined by the Committee based upon the achievement of certain performance factors evaluated solely at the Committee’s discretion and may be reduced from the 67,009 shares. As a result of this uncertainty, a grant date has not yet been determined for this award for purposes of measuring and recognizing compensation cost.
Nonemployee Directors
The Directors’ Plan authorizes us to issue up to 800,000 common shares to Nonemployee Directors. The Directors’ Plan provides for Director Share Ownership Guidelines (“Guidelines”). A Director is required by the end of a four-year period to own either (i) a total of at least 8,000 common shares, or (ii) hold common shares with a market value of at least $100,000. If the Nonemployee Director does not meet the Guidelines assessed December 1, annually, the Nonemployee Director must take a portion of the annual retainer in common shares (“Required Retainer”) until such time the Nonemployee Director reaches the Guidelines. Once the Nonemployee
139
Cliffs Natural Resources Inc. and Subsidiaries
Notes to Consolidated Financial Statements — (Continued)
Director meets the Guidelines, the Nonemployee Director may elect to receive the Required Retainer in cash. Effective May 1, 2008, Nonemployee Directors not meeting the Guidelines must take $20,000 of the annual retainer of $50,000 in common shares.
The Directors’ Plan also provides for an Annual Equity Grant (“Equity Grant”). The Equity Grant is awarded at our Annual Meeting each year to all Nonemployee Directors elected or re-elected by the shareholders. The value of the Equity Grant is payable in restricted shares with a three-year vesting period from the date of grant. The closing market price of our common shares on our Annual Meeting Date is divided into the Equity Grant to determine the number of restricted shares awarded. Effective May 1, 2008, Nonemployee Directors receive an annual retainer fee of $50,000 and an annual equity award of $75,000. Effective July 1, 2009, the Directors’ annual retainer fee was reduced by 10 percent in conjunction with the Company’s compensation reductions across the organization. Such reductions were reinstated to their previous levels effective January 1, 2010. The Directors’ Plan offers the Nonemployee Director the opportunity to defer all or a portion of the Annual Directors’ Retainer fees, Chair retainers, meeting fees, and the Equity Grant into the Compensation Plan. A Director who is 69 or older at the Equity Grant date will receive common shares with no restrictions.
For the last three years, Equity Grant shares have been awarded to elected or re-elected Directors as follows:
| Year of Grant |
Unrestricted Equity Grant Shares |
Restricted Equity Grant Shares |
Deferred Equity Grant Shares | |||
| 2007 |
— | 7,488 | 936 | |||
| 2008 |
804 | 4,824 | 804 | |||
| 2009 |
7,788 | 15,118 | 2,596 |
Other Information
We adopted the fair value recognition provisions of ASC 718 effective January 1, 2006 using the modified prospective transition method. Under existing restricted stock plans awarded prior to January 1, 2006, we continue to recognize compensation cost for awards to retiree-eligible employees without substantive forfeiture risk over the nominal vesting period. This recognition method differs from the requirements for immediate recognition for awards granted with similar provisions after the January 1, 2006 adoption. The following table summarizes the share-based compensation expense that we recorded for continuing operations in 2009, 2008 and 2007:
| (In Millions, except EPS) | ||||||||||||
| 2009 | 2008 | 2007 | ||||||||||
| Cost of goods sold and operating expenses |
$ | 1.2 | $ | 2.1 | $ | 0.4 | ||||||
| Selling, general and administrative expenses |
11.0 | 20.4 | 12.0 | |||||||||
| Reduction of operating income from continuing operations before income taxes and equity loss from ventures |
12.2 | 22.5 | 12.4 | |||||||||
| Income tax benefit |
(4.3 | ) | (7.9 | ) | (4.3 | ) | ||||||
| Reduction of net income attributable to Cliffs shareholders |
$ | 7.9 | $ | 14.6 | $ | 8.1 | ||||||
| Reduction of earnings per share attributable to Cliffs shareholders: |
||||||||||||
| Basic |
$ | 0.06 | $ | 0.14 | $ | 0.10 | ||||||
| Diluted |
$ | 0.06 | $ | 0.13 | $ | 0.08 | ||||||
140
Cliffs Natural Resources Inc. and Subsidiaries
Notes to Consolidated Financial Statements — (Continued)
Determination of Fair Value
The fair value of each grant is estimated on the date of grant using a Monte Carlo simulation to forecast relative TSR performance. A correlation matrix of historic and projected stock prices was developed for both the Company and its predetermined peer group of mining and metals companies. The fair value assumes that performance goals will be achieved. If such goals are not met, no compensation cost is recognized and any recognized compensation cost is reversed.
The expected term of the grant represents the time from the grant date to the end of the service period for each of the three plan year agreements. We estimated the volatility of our common stock and that of the peer group of mining and metals companies using daily price intervals for all companies. The risk-free interest rate is the rate at the grant date on zero-coupon government bonds, with a term commensurate with the remaining life of the performance plans.
The following assumptions were utilized to estimate the fair value for the 2009 performance share grants:
| Grant Date Market Price |
Average Expected Term (Years) |
Expected Volatility |
Risk-Free Interest Rate |
Dividend Yield |
Fair Value |
Fair Value | ||||||||||
| $12.96 - $25.31 |
2.81 | 85.8 | % | 1.43 | % | 2.72 | % | $ | 4.90 | 19.36% -37.83% | ||||||
The fair value of the restricted share units is determined based on the closing price of the Company’s shares on the grant date. The restricted share units granted under the Plan vest over a period of three years.
Stock options, restricted stock, deferred stock allocation and performance share activity under our Incentive Equity Plans and Nonemployee Directors’ Compensation Plans are as follows:
| 2009 | 2008 | 2007 | ||||||||||||||||
| Shares | Weighted- Average Exercise Price |
Shares | Weighted- Average Exercise Price |
Shares | Weighted- Average Exercise Price | |||||||||||||
| Stock options: |
||||||||||||||||||
| Options outstanding at beginning of year |
2,500 | $ | 5.42 | 11,800 | $ | 5.42 | 23,600 | $ | 5.04 | |||||||||
| Granted during the year |
— | — | — | |||||||||||||||
| Exercised |
(2,500 | ) | 5.42 | (9,300 | ) | 6.47 | (11,800 | ) | 4.66 | |||||||||
| Cancelled or expired |
— | — | — | |||||||||||||||
| Options outstanding at end of year |
— | — | 2,500 | 5.42 | 11,800 | 5.42 | ||||||||||||
| Options exercisable at end of year |
— | — | 2,500 | 5.42 | 11,800 | 5.42 | ||||||||||||
| Restricted awards: |
||||||||||||||||||
| Outstanding and restricted at beginning of year |
315,684 | 514,714 | 649,324 | |||||||||||||||
| Granted during the year |
184,904 | 62,672 | 164,692 | |||||||||||||||
| Vested |
(201,486 | ) | (261,702 | ) | (299,302 | ) | ||||||||||||
| Cancelled |
(8,400 | ) | — | — | ||||||||||||||
| Outstanding and restricted at end of year |
290,702 | 315,684 | 514,714 | |||||||||||||||
| Performance shares: |
||||||||||||||||||
| Outstanding at beginning of year |
594,115 | 723,544 | 861,672 | |||||||||||||||
| Granted during the year |
555,046 | 194,881 | 390,888 | |||||||||||||||
| Vested |
(312,336 | ) | (236,520 | ) | (529,016 | ) | ||||||||||||
| Forfeited/cancelled |
(13,432 | ) | (87,790 | ) | — | |||||||||||||
| Outstanding at end of year |
823,393 | 594,115 | 723,544 | |||||||||||||||
141
Cliffs Natural Resources Inc. and Subsidiaries
Notes to Consolidated Financial Statements — (Continued)
| 2009 | 2008 | 2007 | ||||||||||||
| Shares | Weighted- Average Exercise Price |
Shares | Weighted- Average Exercise Price |
Shares | Weighted- Average Exercise Price | |||||||||
| Vested or expected to vest at |
||||||||||||||
| December 31, 2009 |
776,868 | |||||||||||||
| Directors’ retainer and voluntary shares: |
||||||||||||||
| Outstanding at beginning of year |
2,183 | 1,100 | 1,100 | |||||||||||
| Granted during the year |
4,602 | 2,772 | — | |||||||||||
| Vested |
(2,189 | ) | (1,689 | ) | — | |||||||||
| Outstanding at end of year |
4,596 | 2,183 | 1,100 | |||||||||||
| Reserved for future grants or awards at end of year: |
||||||||||||||
| Employee plans |
1,458,438 | |||||||||||||
| Directors’ plans |
146,428 | |||||||||||||
| Total |
1,604,866 | |||||||||||||
A summary of our outstanding share-based awards as of December 31, 2009 is shown below:
| Shares | Weighted Average Grant Date Fair Value | |||||
| Outstanding, beginning of year |
911,982 | $ | 27.37 | |||
| Granted |
644,594 | 8.01 | ||||
| Vested |
(416,053 | ) | 46.18 | |||
| Forfeited/expired |
(21,832 | ) | 20.12 | |||
| Outstanding, end of year |
1,118,691 | $ | 13.60 | |||
The total compensation cost related to outstanding awards not yet recognized is $9.3 million at December 31, 2009. The weighted average remaining period for the awards outstanding at December 31, 2009 is approximately 1.5 years.
NOTE 14 — INCOME TAXES
Income from continuing operations before income taxes and equity loss from ventures includes the following components:
| (In Millions) | |||||||||
| 2009 | 2008 | 2007 | |||||||
| United States |
$ | 130.7 | $ | 566.6 | $ | 312.3 | |||
| Foreign |
159.9 | 149.7 | 68.4 | ||||||
| $ | 290.6 | $ | 716.3 | $ | 380.7 | ||||
142
Cliffs Natural Resources Inc. and Subsidiaries
Notes to Consolidated Financial Statements — (Continued)
The components of the provision (benefit) for income taxes on continuing operations consist of the following:
| (In Millions) | ||||||||||||
| 2009 | 2008 | 2007 | ||||||||||
| Current provision (benefit): |
||||||||||||
| United States federal |
$ | (46.2 | ) | $ | 151.4 | $ | 67.7 | |||||
| United States state & local |
3.4 | 3.7 | 1.0 | |||||||||
| Foreign |
2.8 | 77.6 | 48.5 | |||||||||
| (40.0 | ) | 232.7 | 117.2 | |||||||||
| Deferred provision (benefit): |
||||||||||||
| United States federal |
13.2 | (54.1 | ) | (12.7 | ) | |||||||
| United States state & local |
(6.1 | ) | (4.1 | ) | (2.9 | ) | ||||||
| Foreign |
53.7 | (30.3 | ) | (17.5 | ) | |||||||
| 60.8 | (88.5 | ) | (33.1 | ) | ||||||||
| Total provision on continuing operations |
$ | 20.8 | $ | 144.2 | $ | 84.1 | ||||||
Reconciliation of our income tax attributable to continuing operations computed at the United States federal statutory rate is as follows:
| (In Millions) | ||||||||||||
| 2009 | 2008 | 2007 | ||||||||||
| Tax at U.S. statutory rate of 35 percent |
$ | 101.7 | $ | 250.6 | $ | 133.3 | ||||||
| Increase (decrease) due to: |
||||||||||||
| Percentage depletion in excess of cost depletion |
(66.2 | ) | (101.1 | ) | (46.9 | ) | ||||||
| Tax effect of foreign operations |
(44.3 | ) | (6.5 | ) | (6.6 | ) | ||||||
| State taxes, net |
(2.1 | ) | (0.7 | ) | (2.4 | ) | ||||||
| Manufacturer’s deduction |
(0.1 | ) | (6.9 | ) | (4.3 | ) | ||||||
| Valuation allowance |
39.0 | (0.8 | ) | 13.0 | ||||||||
| Other items — net |
(7.2 | ) | 9.6 | (2.0 | ) | |||||||
| Income tax expense |
$ | 20.8 | $ | 144.2 | $ | 84.1 | ||||||
We had a $39.0 million increase in the valuation allowance of certain deferred tax assets. Of this amount, $24.5 million relates to certain foreign operating losses and $14.5 million relates to certain foreign assets where tax basis exceeds book basis.
The components of income taxes for other than continuing operations consisted of the following:
| (In Millions) | ||||||||||||
| 2009 | 2008 | 2007 | ||||||||||
| Discontinued operations |
$ | — | $ | — | $ | 0.2 | ||||||
| Other comprehensive (income) loss: |
||||||||||||
| Minimum pension/OPEB liability |
(4.7 | ) | (99.8 | ) | 20.1 | |||||||
| Mark-to-market adjustments |
(12.3 | ) | (1.4 | ) | 7.1 | |||||||
| (17.0 | ) | (101.2 | ) | 27.2 | ||||||||
| Paid in capital — stock based compensation |
3.5 | (3.5 | ) | (4.3 | ) | |||||||
143
Cliffs Natural Resources Inc. and Subsidiaries
Notes to Consolidated Financial Statements — (Continued)
Significant components of our deferred tax assets and liabilities as of December 31, 2009 and 2008 are as follows:
| (In Millions) | ||||||
| 2009 | 2008 | |||||
| Deferred tax assets: |
||||||
| Pensions |
$ | 114.7 | $ | 114.8 | ||
| Postretirement benefits other than pensions |
75.0 | 77.9 | ||||
| Alternative minimum tax credit carryforwards |
74.3 | 67.6 | ||||
| Capital loss carryforwards |
1.2 | — | ||||
| Development |
0.1 | 15.1 | ||||
| Asset retirement obligations |
27.1 | 22.8 | ||||
| Operating loss carryforwards |
112.4 | 11.1 | ||||
| Product inventories |
22.8 | 31.6 | ||||
| Properties |
16.2 | 39.4 | ||||
| Lease liabilities |
36.2 | — | ||||
| Financial derivatives |
— | 33.5 | ||||
| Other liabilities |
64.4 | 75.5 | ||||
| Total deferred tax assets before valuation allowance |
544.4 | 489.3 | ||||
| Deferred tax asset valuation allowance |
89.4 | 17.6 | ||||
| Net deferred tax assets |
455.0 | 471.7 | ||||
| Deferred tax liabilities: |
||||||
| Properties |
90.1 | 86.7 | ||||
| Investment in ventures |
143.9 | 102.6 | ||||
| Intangible assets |
13.1 | — | ||||
| Income tax uncertainties |
38.7 | 14.1 | ||||
| Other assets |
26.8 | 32.6 | ||||
| Total deferred tax liabilities |
312.6 | 236.0 | ||||
| Net deferred tax assets |
$ | 142.4 | $ | 235.7 | ||
The deferred tax amounts are classified on the Statements of Consolidated Financial Position as current or long-term in accordance with the asset or liability to which they relate. Following is a summary:
| (In Millions) | ||||||
| 2009 | 2008 | |||||
| Deferred tax assets: |
||||||
| United States |
||||||
| Current |
$ | 41.1 | $ | 28.0 | ||
| Long-term |
140.3 | 178.2 | ||||
| Total United States |
181.4 | 206.2 | ||||
| Foreign |
||||||
| Current |
21.0 | 23.8 | ||||
| Long-term |
10.8 | 73.0 | ||||
| Total deferred tax assets |
213.2 | 303.0 | ||||
| Deferred tax liabilities: |
||||||
| Foreign |
||||||
| Long-term |
70.8 | 67.3 | ||||
| Total deferred tax liabilities |
70.8 | 67.3 | ||||
| Net deferred tax assets |
$ | 142.4 | $ | 235.7 | ||
144
Cliffs Natural Resources Inc. and Subsidiaries
Notes to Consolidated Financial Statements — (Continued)
At December 31, 2009 and 2008, we had $74.3 million and $67.6 million, respectively, of deferred tax assets related to United States alternative minimum tax credits that can be carried forward indefinitely.
We had gross United States federal, state and foreign net operating loss carry forwards of $149.3 million, $192.9 million and $206.0 million, respectively, at December 31, 2009. We had state and foreign net operating loss carry forwards at December 31, 2008 of $85.4 million and $38.9 million, respectively. The federal net operating loss expires in 2029. State net operating losses will begin to expire in 2022, and the foreign net operating loss can be carried forward indefinitely.
Deferred tax assets before valuation allowance as of December 31, 2009 and 2008 have been reduced by $89.4 million and $17.6 million, respectively, to amounts that are considered more-likely-than-not to be realized. At December 31, 2009 our valuation allowance maintained against certain deferred tax assets increased by $71.8 million, of which $42.7 million primarily relates to tax basis greater than book basis on certain foreign assets, and $24.3 million relates to certain foreign operating losses. Of the $71.8 million, $16.8 million was reflected through goodwill.
At December 31, 2009, cumulative undistributed earnings of foreign subsidiaries included in consolidated retained earnings amounted to $487.5 million. These earnings are indefinitely reinvested in international operations. Accordingly, no provision has been made for deferred taxes related to a future repatriation of these earnings, nor is it practicable to estimate the amount of income taxes that would have to be provided if we were to conclude that such earnings will be remitted in the foreseeable future.
A reconciliation of the beginning and ending amount of unrecognized tax benefits is as follows:
| (In Millions) | ||||||||
| 2009 | 2008 | |||||||
| Unrecognized tax benefits balance as of January 1 |
$ | 53.7 | $ | 15.2 | ||||
| Increases for tax positions in prior years |
23.8 | 19.9 | ||||||
| Increases for tax positions in current year |
2.5 | 24.9 | ||||||
| Increase (decrease) due to foreign exchange |
4.7 | (1.6 | ) | |||||
| Settlements |
(9.1 | ) | (4.7 | ) | ||||
| Lapses in statutes of limitations |
(0.4 | ) | — | |||||
| Unrecognized tax benefits balance as of December 31 |
$ | 75.2 | $ | 53.7 | ||||
At December 31, 2009 and 2008, we had $75.2 million and $53.7 million, respectively, of unrecognized tax benefits recorded in Other liabilities on the Statements of Consolidated Financial Position. If the $75.2 million were recognized, $74.2 million would impact the effective tax rate. It is reasonably possible that unrecognized tax benefits will significantly decrease within the next 12 months due to expected settlements with the taxing authorities. An estimate of the range of the possible change cannot be reasonably determined at this time. We recognized potential accrued interest and penalties of $3.4 million and $5.8 million related to unrecognized tax benefits in income tax expense in 2009 and 2008, respectively. At December 31, 2009 and 2008, we had $15.2 million and $11.6 million, respectively, of accrued interest and penalties related to the unrecognized tax benefits recorded in Other liabilities on the Statements of Consolidated Financial Position.
Tax years that remain subject to examination are years 2007 and forward for the United States, 1993 and forward for Canada, and 1994 and forward for Australia.
145
Cliffs Natural Resources Inc. and Subsidiaries
Notes to Consolidated Financial Statements — (Continued)
NOTE 15 — CAPITAL STOCK
Common Shares
Public Offering
On May 19, 2009, we completed a public offering of our common shares. The total number of shares sold was 17.25 million, comprised of a 15 million share offering and the exercise of an underwriters’ over-allotment option to purchase an additional 2.25 million common shares. The common shares sold were out of treasury stock, and the sale did not result in an increase in the number of shares authorized or the number of shares issued. A registration statement relating to these securities was filed with and declared effective by the SEC. Net proceeds at a price of $21.00 per share were approximately $348 million.
Dividends
On May 12, 2009, our board of directors enacted a 55 percent reduction in our quarterly common share dividend to $0.04 from $0.0875 for the second and third quarters of 2009 in order to enhance financial flexibility. The $0.04 common share dividends were paid on June 1, 2009 and September 1, 2009 to shareholders of record as of May 22, 2009 and August 14, 2009, respectively. In the fourth quarter of 2009, the dividend was reinstated to its previous level.
Euronext Listing
In March 2009, we listed our common shares on the Professional Compartment of NYSE Euronext Paris (“Euronext”). On March 31, 2009, the French Autorité des marchés financiers (AMF) approved the prospectus and correspondingly granted a visa number for admission of our common shares to listing and trading on Euronext. Our shares began trading on Euronext on April 6, 2009 under the symbol “CLF” and are denominated in Euros on the Paris venue. The cross listing does not result in changes to our capital structure, share count, or current stock-listings and is intended to promote additional liquidity for investors as well as provide greater access to our shares in Euro-zone markets and currencies.
Preferred Stock
In January 2004, we completed an offering of $172.5 million of redeemable cumulative convertible perpetual preferred stock, without par value, issued at $1,000 per share. The preferred stock paid quarterly cash dividends at a rate of 3.25 percent per annum, had a liquidation preference of $1,000 per share and was convertible into our common shares at an adjusted rate of 133.0646 common shares per share of preferred stock.
The preferred stock is classified for accounting purposes as “temporary equity” reflecting certain provisions of the agreement that could, under remote circumstances (the delisting of our common stock on a U.S. national securities exchange or quotation thereof in an inter-dealer quotation system of any registered U.S. national securities association), require us to redeem the preferred stock for cash. If we were in a default in the payment of six quarterly dividends on the preferred stock, the holders of the preferred stock would thereafter be entitled to elect two directors until all accrued and unpaid dividends were paid.
On January 13, 2009, we announced that the trading price condition for the conversion right of our 3.25 percent redeemable cumulative convertible perpetual preferred stock had been satisfied and, as a result, holders could surrender their shares for conversion at any time. The trading price condition for the preferred shares was satisfied because the closing share price of our common shares for at least 20 of the last 30 trading days of the fiscal 2008 fourth quarter exceeded 110 percent of the then applicable conversion price of the preferred stock. The preferred stock was also convertible during each of the previous 16 fiscal quarters due to the satisfaction of the trading price condition during the applicable periods of the relevant preceding fiscal quarters.
146
Cliffs Natural Resources Inc. and Subsidiaries
Notes to Consolidated Financial Statements — (Continued)
In addition to announcing the convertibility of the shares, on January 13, 2009, we also provided the required notice of our intent to redeem the 205 convertible preferred shares that remained outstanding at December 31, 2008. As a result, holders of the preferred stock could elect to convert their shares in lieu of having them redeemed, provided that surrender for conversion occurred on or prior to February 11, 2009. The conversion rate of 133.0646 common shares per share of preferred stock equates to a conversion price of approximately $7.52 per common share, subject to adjustment in certain circumstances, including payment of dividends on the common shares.
As of February 11, 2009, all remaining preferred shares had been converted to 27,278 common shares at a conversion rate of 133.0646. Total common shares were issued out of treasury.
Shareholder Rights Plan
On October 8, 2008, our Board of Directors adopted a shareholder rights plan. Under the rights plan, the rights initially trade together with the common shares and are not exercisable. In the absence of further action by our Board of Directors, the rights will become exercisable and allow the holder to acquire common shares at a discounted price if a person or group acquires 10 percent or more of the outstanding common shares (or any additional common shares in the case of a person or group that already beneficially owns 10 percent or more of our outstanding common shares on October 13, 2008) without the prior approval of our Board of Directors. Rights held by persons who exceed the applicable threshold will be void. Under certain circumstances, the rights will entitle the holder to buy shares in an acquiring entity at a discounted price.
The rights plan also includes an exchange option. In general, after the rights become exercisable, our Board of Directors may, at its option, effect an exchange of part or all of the rights (other than rights that have become void) at a ratio of one common share for each right, subject to adjustment in certain circumstances. The rights are redeemable at any time prior to the time that they become exercisable for $0.001 per right, subject to adjustment in certain circumstances. Unless earlier amended, redeemed or exchanged, the rights will expire on October 29, 2011.
The issuance of the rights was not a taxable event, does not affect our reported financial condition or results of operations, including our earnings per share, and does not change the manner in which our common shares are currently traded.
147
Cliffs Natural Resources Inc. and Subsidiaries
Notes to Consolidated Financial Statements — (Continued)
NOTE 16 — ACCUMULATED OTHER COMPREHENSIVE LOSS
The components of Accumulated other comprehensive loss within Cliffs shareholders’ equity and related tax effects allocated to each are shown below as of December 31, 2009, 2008 and 2007:
| (In Millions) | ||||||||||||
| Pre-tax Amount |
Tax Benefit (Provision) |
After-tax Amount |
||||||||||
| As of December 31, 2007: |
||||||||||||
| Postretirement benefit liability |
$ | (192.5 | ) | $ | 37.7 | $ | (154.8 | ) | ||||
| Foreign currency translation adjustments |
96.5 | — | 96.5 | |||||||||
| Unrealized net gain on derivative financial instruments |
26.7 | (8.0 | ) | 18.7 | ||||||||
| Unrealized loss on interest rate swap |
(1.4 | ) | 0.5 | (0.9 | ) | |||||||
| Unrealized gain on securities |
15.7 | (5.5 | ) | 10.2 | ||||||||
| $ | (55.0 | ) | $ | 24.7 | $ | (30.3 | ) | |||||
| As of December 31, 2008: |
||||||||||||
| Postretirement benefit liability |
$ | (480.8 | ) | $ | 137.5 | $ | (343.3 | ) | ||||
| Foreign currency translation adjustments |
(68.6 | ) | — | (68.6 | ) | |||||||
| Unrealized net gain on derivative financial instruments |
27.3 | (8.2 | ) | 19.1 | ||||||||
| Unrealized loss on interest rate swap |
(2.6 | ) | 0.9 | (1.7 | ) | |||||||
| Unrealized loss on securities |
(0.2 | ) | 0.1 | (0.1 | ) | |||||||
| $ | (524.9 | ) | $ | 130.3 | $ | (394.6 | ) | |||||
| As of December 31, 2009: |
||||||||||||
| Postretirement benefit liability |
$ | (451.9 | ) | $ | 132.8 | $ | (319.1 | ) | ||||
| Foreign currency translation adjustments |
163.1 | — | 163.1 | |||||||||
| Unrealized net gain on derivative financial instruments |
5.7 | (1.7 | ) | 4.0 | ||||||||
| Unrealized gain on securities |
43.1 | (13.7 | ) | 29.4 | ||||||||
| $ | (240.0 | ) | $ | 117.4 | $ | (122.6 | ) | |||||
The following table reflects the changes in Accumulated other comprehensive loss related to Cliffs shareholders’ equity for 2009, 2008 and 2007:
| (In Millions) | ||||||||||||||||||||||||||||
| Postretirement Benefit Liability |
Adoption of Certain Provisions of ASC 715 |
Unrealized Net Gain (Loss) on Securities |
Foreign Currency Translation |
Unrealized (Loss) on Interest Rate Swap |
Unrealized Net Gain (Loss) on Derivative Financial Instruments |
Accumulated Other Comprehensive Gain (Loss) |
||||||||||||||||||||||
| Balance December 31, 2006 |
$ | (82.9 | ) | $ | (110.7 | ) | $ | 9.6 | $ | 9.6 | $ | — | $ | 4.5 | $ | (169.9 | ) | |||||||||||
| Change during 2007 |
(71.9 | ) | 110.7 | 0.6 | 86.9 | (0.9 | ) | 14.2 | 139.6 | |||||||||||||||||||
| Balance December 31, 2007 |
(154.8 | ) | — | 10.2 | 96.5 | (0.9 | ) | 18.7 | (30.3 | ) | ||||||||||||||||||
| Change during 2008 |
(188.5 | ) | — | (10.3 | ) | (165.1 | ) | (0.8 | ) | 0.4 | (364.3 | ) | ||||||||||||||||
| Balance December 31, 2008 |
(343.3 | ) | — | (0.1 | ) | (68.6 | ) | (1.7 | ) | 19.1 | (394.6 | ) | ||||||||||||||||
| Change during 2009 |
24.2 | — | 29.5 | 231.7 | 1.7 | (15.1 | ) | 272.0 | ||||||||||||||||||||
| Balance December 31, 2009 |
$ | (319.1 | ) | $ | — | $ | 29.4 | $ | 163.1 | $ | — | $ | 4.0 | $ | (122.6 | ) | ||||||||||||
148
Cliffs Natural Resources Inc. and Subsidiaries
Notes to Consolidated Financial Statements — (Continued)
NOTE 17 — EARNINGS PER SHARE
The following table summarizes the computation of basic and diluted earnings per share attributable to Cliffs shareholders:
| (In Millions, Except per Share) | ||||||||||||||||||||||
| 2009 | 2008 | 2007 | ||||||||||||||||||||
| Amount | Per Share |
Amount | Per Share |
Amount | Per Share |
|||||||||||||||||
| Income from continuing operations attributable to Cliffs shareholders |
$ | 205.1 | $ | 1.64 | $ | 515.8 | $ | 5.08 | $ | 269.8 | $ | 3.25 | ||||||||||
| Preferred dividends |
— | — | (1.1 | ) | (.01 | ) | (5.2 | ) | (.06 | ) | ||||||||||||
| Income from continuing operations attributable to Cliffs common shareholders |
205.1 | 1.64 | 514.7 | 5.07 | 264.6 | 3.19 | ||||||||||||||||
| Discontinued operations |
— | — | — | — | 0.2 | — | ||||||||||||||||
| Income attributable to Cliffs common shareholders |
205.1 | $ | 1.64 | 514.7 | $ | 5.07 | 264.8 | $ | 3.19 | |||||||||||||
| Dilutive effect preferred dividend |
— | 1.1 | 5.2 | |||||||||||||||||||
| Income attributable to Cliffs common shareholders plus assumed conversions — diluted |
$ | 205.1 | $ | 1.63 | $ | 515.8 | $ | 4.76 | $ | 270.0 | $ | 2.57 | ||||||||||
| Average number of shares (in thousands) |
||||||||||||||||||||||
| Basic |
124,998 | 101,471 | 82,988 | |||||||||||||||||||
| Employee stock plans |
753 | 1,485 | 528 | |||||||||||||||||||
| Convertible preferred stock |
— | 5,332 | 21,510 | |||||||||||||||||||
| Diluted |
125,751 | 108,288 | 105,026 | |||||||||||||||||||
NOTE 18 — COMMITMENTS AND CONTINGENCIES
We have total contractual obligations and binding commitments of approximately $2.7 billion as of December 31, 2009 compared with $2.5 billion as of December 31, 2008, primarily related to purchase commitments, principal and interest payments on long-term debt, lease obligations, pension and OPEB funding minimums, and mine closure obligations. Such future commitments total $661.0 million in 2010, $314.9 million in 2011, $429.7 million in 2012, $470.0 million in 2013, $183.4 million in 2014 and $597.4 million thereafter.
Purchase Commitments
In 2008, we incurred a capital commitment for the purchase of a new longwall plow system for our Pinnacle mine in West Virginia. The system, which requires a capital investment of approximately $83 million, will replace the current longwall plow system in an effort to reduce maintenance costs and increase production at the mine. As of December 31, 2009, capital expenditures related to this purchase were approximately $29 million. Remaining expenditures of approximately $40 million and $14 million are scheduled to be made in 2010 and 2011, respectively, based upon revised payment and delivery terms negotiated with the supplier.
Contingencies
Litigation
We are currently a party to various claims and legal proceedings incidental to our operations. If management believes that a loss arising from these matters is probable and can reasonably be estimated, we record the amount of the loss, or the minimum estimated liability when the loss is estimated using a range, and no
149
Cliffs Natural Resources Inc. and Subsidiaries
Notes to Consolidated Financial Statements — (Continued)
point within the range is more probable than another. As additional information becomes available, any potential liability related to these matters is assessed and the estimates are revised, if necessary. Based on currently available information, management believes that the ultimate outcome of these matters, individually and in the aggregate, will not have a material adverse effect on our financial position or results of operations. However, litigation is subject to inherent uncertainties, and unfavorable rulings could occur. An unfavorable ruling could include monetary damages or an injunction. If an unfavorable ruling were to occur, there exists the possibility of a material adverse impact on the financial position and results of operations of the period in which the ruling occurs, or future periods. However, we believe that any pending litigation will not result in a material liability in relation to our consolidated financial statements. Refer to Part 1 — Item 3, Legal Proceedings, for additional information.
Environmental Matters
We had environmental liabilities of $14.5 million and $16.4 million at December 31, 2009 and 2008 respectively, including obligations for known environmental remediation exposures at active and closed mining operations and other sites. These amounts have been recognized based on the estimated cost of investigation and remediation at each site, and include site studies, design and implementation of remediation plans, legal and consulting fees, and post-remediation monitoring and related activities. If the cost can only be estimated as a range of possible amounts with no specific amount being more likely, the minimum of the range is accrued. Future expenditures are not discounted unless the amount and timing of the cash disbursements are readily known. Potential insurance recoveries have not been reflected. Additional environmental obligations could be incurred, the extent of which cannot be assessed. The amount of our ultimate liability with respect to these matters may be affected by several uncertainties, primarily the ultimate cost of required remediation and the extent to which other responsible parties contribute. Refer to NOTE 11 — ENVIRONMENTAL AND MINE CLOSURE OBLIGATIONS for further information.
Tax Matters
The calculation of our tax liabilities involves dealing with uncertainties in the application of complex tax regulations. We recognize liabilities for anticipated tax audit issues based on our estimate of whether, and the extent to which, additional taxes will be due. If we ultimately determine that payment of these amounts is unnecessary, we reverse the liability and recognize a tax benefit during the period in which we determine that the liability is no longer necessary. We also recognize tax benefits to the extent that it is more likely than not that our positions will be sustained when challenged by the taxing authorities. To the extent we prevail in matters for which liabilities have been established, or are required to pay amounts in excess of our liabilities, our effective tax rate in a given period could be materially affected. An unfavorable tax settlement would require use of our cash and result in an increase in our effective tax rate in the year of resolution. A favorable tax settlement would be recognized as a reduction in our effective tax rate in the year of resolution.
Guarantees
We are party to financing arrangements under which we issue guarantees on behalf of certain of our unconsolidated subsidiaries. In the event of non-payment, we are obligated to make payment in accordance with the provisions of the guarantee arrangement. At December 31, 2009 and 2008, Amapá had total project debt outstanding of approximately $530 million and $493 million, respectively. We have provided several guarantees on our 30 percent share of the total debt outstanding, or $160 million and $148 million, at December 31, 2009 and 2008, respectively. Our estimate of the aggregate fair value of the outstanding guarantees is $6.7 million as of December 31, 2009 and 2008, which is reflected in Other Liabilities on the Statements of Consolidated Financial Position. The fair value was estimated using a discounted cash flow model based upon the spread between guaranteed and non-guaranteed debt over the period the debt is expected to be outstanding. Should we be required to pay any portion of the total amount of the loans we have guaranteed, we could attempt to recover some or all of that amount from guaranteed parties. We hold no collateral in respect of the guarantees.
150
Cliffs Natural Resources Inc. and Subsidiaries
Notes to Consolidated Financial Statements — (Continued)
Amapá is currently in violation of certain operating and financial loan covenants contained in the debt agreements. However, Amapá and its lenders have agreed to waive these covenants through May 31, 2010 related to the remaining debt outstanding. If Amapá is unable to either renegotiate the terms of the debt agreements or obtain further extension of the compliance waivers, violation of the operating and financial loan covenants may result in the lenders calling the debt, thereby requiring us to recognize and repay our share of the debt in accordance with the provisions of the guarantee arrangement.
NOTE 19 — CASH FLOW INFORMATION
A reconciliation of capital additions to cash paid for capital expenditures for the years ended December 31, 2009, 2008 and 2007 is as follows:
| (In Millions) | |||||||||
| 2009 | 2008 | 2007 | |||||||
| Capital additions |
$ | 168.2 | $ | 232.6 | $ | 235.1 | |||
| Cash paid for capital expenditures |
116.3 | 182.5 | 199.5 | ||||||
| Difference |
$ | 51.9 | $ | 50.1 | $ | 35.6 | |||
| Non-cash accruals |
$ | 3.0 | $ | 25.7 | $ | 4.7 | |||
| Capital leases |
48.9 | 24.4 | 30.9 | ||||||
| Total |
$ | 51.9 | $ | 50.1 | $ | 35.6 | |||
Cash payments for interest and income taxes in 2009, 2008 and 2007 are as follows:
| (In Millions) | |||||||||
| 2009 | 2008 | 2007 | |||||||
| Taxes paid on income |
$ | 64.8 | $ | 175.5 | $ | 123.6 | |||
| Interest paid on debt obligations |
25.3 | 26.3 | 16.6 | ||||||
NOTE 20 — RELATED PARTIES
We co-own four of our six North American iron ore mines with various joint venture partners that are integrated steel producers or their subsidiaries. We are the manager of each of the mines we co-own and rely on our joint venture partners to make their required capital contributions and to pay for their share of the iron ore pellets that we produce. The joint venture partners are also our customers. The following is a summary of the mine ownership of these four North American iron ore mines at December 31, 2009:
| Percent ownership | ||||||
| Mine |
Cliffs Natural Resources |
ArcelorMittal | U. S. Steel Canada | |||
| Empire |
79.0 | 21.0 | — | |||
| Tilden |
85.0 | — | 15.0 | |||
| Hibbing |
23.0 | 62.3 | 14.7 | |||
| Wabush (1) |
26.8 | 28.6 | 44.6 | |||
| (1) | On October 12, 2009, we exercised our right of first refusal to acquire U.S. Steel Canada’s 44.6 percent interest and ArcelorMittal Dofasco’s 28.6 percent interest in Wabush, thereby increasing our ownership stake in Wabush Mines to 100 percent. Ownership transfer to Cliffs was completed on February 1, 2010. Refer to NOTE 5 — ACQUISTIONS & OTHER INVESTMENTS for further information. |
ArcelorMittal has a unilateral right to put its interest in the Empire Mine to us, but has not exercised this right to date.
151
Cliffs Natural Resources Inc. and Subsidiaries
Notes to Consolidated Financial Statements — (Continued)
Product revenues to related parties were as follows:
| (In Millions) | ||||||||||||
| 2009 | 2008 | 2007 | ||||||||||
| Product revenues to related parties |
$ | 593.8 | $ | 1,020.5 | $ | 754.3 | ||||||
| Total product revenues |
2,216.2 | 3,294.8 | 1,997.3 | |||||||||
| Related party product revenue as a percent of total product revenue |
26.8 | % | 31.0 | % | 37.8 | % | ||||||
Accounts receivable from related parties were $1.8 million and $2.9 million at December 31, 2009 and 2008, respectively.
In 2002, we entered into an agreement with Ispat that restructured the ownership of the Empire mine and increased our ownership from 46.7 percent to 79 percent in exchange for assumption of all mine liabilities. Under the terms of the agreement, we indemnified Ispat from obligations of Empire in exchange for certain future payments to Empire and to us by Ispat of $120.0 million, recorded at a present value of $38.3 million and $43.2 million at December 31, 2009 and 2008, respectively. Of these amounts, $28.3 million and $33.2 million were classified as Long-term receivable at December 31, 2009 and 2008, respectively, with the balances current, over the 12-year life of the supply agreement.
Supply agreements with one of our customers include provisions for supplemental revenue or refunds based on the customer’s annual steel pricing for the year the product is consumed in the customer’s blast furnace. The supplemental pricing is characterized as an embedded derivative. Refer to NOTE 3 — DERIVATIVE INSTRUMENTS AND HEDGING ACTIVITIES for further information.
NOTE 21 — SUBSEQUENT EVENTS
Freewest Acquisition
On January 25, 2010, we obtained shareholder approval to acquire all of the outstanding shares of Freewest for C$1.00 per share, court approval was received on January 26, 2010, and the transaction closed on January 27, 2010. We issued 0.0201 of our common shares for each Freewest share, a total of 4.2 million common shares, representing total purchase consideration of approximately $174 million.
Wabush Acquisition
On January 26, 2010, we obtained the remaining regulatory approvals required to obtain full ownership of Wabush. Ownership transfer to Cliffs of U.S. Steel Canada’s 44.6 percent interest and ArcelorMittal Dofasco’s 28.6 percent interest in Wabush was completed on February 1, 2010. Total purchase consideration for the acquisition was approximately $88 million, subject to certain working capital adjustments.
Ratification of New Labor Agreement at Wabush
In February 2010, we entered into a new five-year labor agreement with the USW for our Wabush mine. The agreement provides for a 15 percent increase in labor costs over the five-year term of the agreement, inclusive of benefits.
We have evaluated subsequent events through February 18, 2010, which represents the date of financial statement issuance.
152
Cliffs Natural Resources Inc. and Subsidiaries
Notes to Consolidated Financial Statements — (Continued)
NOTE 22 — QUARTERLY RESULTS OF OPERATIONS (UNAUDITED)
The sum of quarterly EPS may not equal EPS for the year due to discrete quarterly calculations.
| (In Millions, Except Per Common Share) | |||||||||||||||||
| 2009 | |||||||||||||||||
| Quarters | Year | ||||||||||||||||
| First | Second | Third | Fourth | ||||||||||||||
| Revenues from product sales and services |
$ | 464.8 | $ | 390.3 | $ | 666.4 | $ | 820.5 | $ | 2,342.0 | |||||||
| Sales margin |
42.4 | (11.7 | ) | 103.2 | 175.0 | 308.9 | |||||||||||
| Income (Loss) attributable to Cliffs before extraordinary gain and cumulative effect of accounting change |
(7.4 | ) | 45.5 | 58.8 | 108.2 | 205.1 | |||||||||||
| Net income (loss) attributable to Cliffs shareholders |
(7.4 | ) | 45.5 | 58.8 | 108.2 | 205.1 | |||||||||||
| Earnings (Loss) per common share attributable to Cliffs shareholders: |
|||||||||||||||||
| Basic |
$ | (0.07 | ) | $ | 0.36 | $ | 0.45 | $ | 0.83 | $ | 1.64 | ||||||
| Diluted |
(0.07 | ) | 0.36 | 0.45 | 0.82 | 1.63 | |||||||||||
| 2008 | |||||||||||||||||
| Quarters | Year | ||||||||||||||||
| First | Second | Third | Fourth | ||||||||||||||
| Revenues from product sales and services |
$ | 494.4 | $ | 1,008.6 | $ | 1,189.7 | $ | 916.4 | $ | 3,609.1 | |||||||
| Sales margin |
82.4 | 426.3 | 365.0 | 286.0 | 1,159.7 | ||||||||||||
| Income attributable to Cliffs before extraordinary gain and cumulative effect of accounting change |
16.7 | 270.2 | 174.9 | 54.0 | 515.8 | ||||||||||||
| Net income attributable to Cliffs shareholders |
16.7 | 270.2 | 174.9 | 54.0 | 515.8 | ||||||||||||
| Earnings per common share attributable to Cliffs shareholders: |
|||||||||||||||||
| Basic |
$ | 0.18 | $ | 2.75 | $ | 1.67 | $ | 0.48 | $ | 5.07 | |||||||
| Diluted |
0.16 | 2.57 | 1.61 | 0.47 | 4.76 | ||||||||||||
In the fourth quarter of 2008, we had certain non-recurring items which had a material impact on the quarterly results. In particular, on November 17, 2008, we announced the termination of the definitive merger agreement with Alpha Natural Resources, Inc., under which we would have acquired all outstanding shares of Alpha. Based upon the macroeconomic environment in 2008, uncertainty in the steel industry, shareholder dynamics, and the risks and costs of potential litigation, both our Board of Directors and Alpha’s Board of Directors determined that termination of the merger agreement was in the best interest of its equity holders. Under the terms of the settlement agreement, we were required to pay Alpha a $70 million termination fee, which was financed through our revolving credit facility and paid in November 2008. As a result, $90.1 million in termination fees and associated acquisition costs were expensed through Other Operating Income (Expense) on the Statement of Consolidated Operations in the fourth quarter of 2008 upon termination of the definitive merger agreement.
Additionally, in the fourth quarter of 2008, we recorded impairment charges of $25.1 million in Other income (expense) on the Statement of Consolidated Operations related to declines in the fair value of our available-for-sale securities which we concluded were other than temporary. As of December 31, 2008, our investments in PolyMet and Golden West had fair values totaling $6.2 million and $4.7 million, respectively, compared with a cost of $14.2 million and $21.8 million, respectively. The severity of the impairments in relation to the carrying amounts of the individual investments was consistent with the macroeconomic market and industry developments during 2008. However, we evaluated the near-term prospects of the issuers in relation to the severity and rapid decline in the fair value of each of these investments, and based upon that evaluation, we could not reasonably assert that the impairment period would be temporary primarily as a result of the global economic crisis and the corresponding uncertainties in the market.
153
Report of Independent Registered Public Accounting Firm
To the Board of Directors and Shareholders of
Cliffs Natural Resources Inc.
Cleveland, Ohio
We have audited the internal control over financial reporting of Cliffs Natural Resources Inc. and subsidiaries (the “Company”) as of December 31, 2009, based on criteria established in Internal Control — Integrated Framework issued by the Committee of Sponsoring Organizations of the Treadway Commission. The Company’s management is responsible for maintaining effective internal control over financial reporting and for its assessment of the effectiveness of internal control over financial reporting, included in the accompanying Management’s Report on Internal Controls Over Financial Reporting. Our responsibility is to express an opinion on the Company’s internal control over financial reporting based on our audit.
We conducted our audit in accordance with the standards of the Public Company Accounting Oversight Board (United States). Those standards require that we plan and perform the audit to obtain reasonable assurance about whether effective internal control over financial reporting was maintained in all material respects. Our audit included obtaining an understanding of internal control over financial reporting, assessing the risk that a material weakness exists, testing and evaluating the design and operating effectiveness of internal control based on the assessed risk, and performing such other procedures as we considered necessary in the circumstances. We believe that our audit provides a reasonable basis for our opinion.
A company’s internal control over financial reporting is a process designed by, or under the supervision of, the company’s principal executive and principal financial officers, or persons performing similar functions, and effected by the company’s board of directors, management, and other personnel to provide reasonable assurance regarding the reliability of financial reporting and the preparation of financial statements for external purposes in accordance with generally accepted accounting principles. A company’s internal control over financial reporting includes those policies and procedures that (1) pertain to the maintenance of records that, in reasonable detail, accurately and fairly reflect the transactions and dispositions of the assets of the company; (2) provide reasonable assurance that transactions are recorded as necessary to permit preparation of financial statements in accordance with generally accepted accounting principles, and that receipts and expenditures of the company are being made only in accordance with authorizations of management and directors of the company; and (3) provide reasonable assurance regarding prevention or timely detection of unauthorized acquisition, use, or disposition of the company’s assets that could have a material effect on the financial statements.
Because of the inherent limitations of internal control over financial reporting, including the possibility of collusion or improper management override of controls, material misstatements due to error or fraud may not be prevented or detected on a timely basis. Also, projections of any evaluation of the effectiveness of the internal control over financial reporting to future periods are subject to the risk that the controls may become inadequate because of changes in conditions, or that the degree of compliance with the policies or procedures may deteriorate.
In our opinion, the Company maintained, in all material respects, effective internal control over financial reporting as of December 31, 2009, based on the criteria established in Internal Control — Integrated Framework issued by the Committee of Sponsoring Organizations of the Treadway Commission.
We have also audited, in accordance with the standards of the Public Company Accounting Oversight Board (United States), the consolidated financial statements and financial statement schedule as of and for the year ended December 31, 2009 of the Company and our report dated February 18, 2010 expressed an unqualified opinion on those financial statements and financial statement schedule.
/s/ DELOITTE & TOUCHE LLP
Cleveland, Ohio
February 18, 2010
154
Report of Independent Registered Public Accounting Firm
To the Board of Directors and Shareholders of
Cliffs Natural Resources Inc.
Cleveland, Ohio
We have audited the accompanying statements of consolidated financial position of Cliffs Natural Resources Inc. and subsidiaries (the “Company”) as of December 31, 2009 and 2008, and the related statements of consolidated operations, cash flows, and changes in equity for each of the three years in the period ended December 31, 2009. Our audits also included the financial statement schedule listed in the Index at Item 15. These financial statements and financial statement schedule are the responsibility of the Company’s management. Our responsibility is to express an opinion on the financial statements and financial statement schedule based on our audits.
We conducted our audits in accordance with the standards of the Public Company Accounting Oversight Board (United States). Those standards require that we plan and perform the audit to obtain reasonable assurance about whether the financial statements are free of material misstatement. An audit includes examining, on a test basis, evidence supporting the amounts and disclosures in the financial statements. An audit also includes assessing the accounting principles used and significant estimates made by management, as well as evaluating the overall financial statement presentation. We believe that our audits provide a reasonable basis for our opinion.
In our opinion, such consolidated financial statements present fairly, in all material respects, the financial position of Cliffs Natural Resources Inc. and subsidiaries as of December 31, 2009 and 2008, and the results of their operations and their cash flows for each of the three years in the period ended December 31, 2009, in conformity with accounting principles generally accepted in the United States of America. Also, in our opinion, such financial statement schedule, when considered in relation to the basic consolidated financial statements taken as a whole, presents fairly, in all material respects, the information set forth therein.
We have also audited, in accordance with the standards of the Public Company Accounting Oversight Board (United States), the Company’s internal control over financial reporting as of December 31, 2009, based on the criteria established in Internal Control—Integrated Framework issued by the Committee of Sponsoring Organizations of the Treadway Commission and our report dated February 18, 2010 expressed an unqualified opinion on the Company’s internal control over financial reporting.
/s/ DELOITTE & TOUCHE LLP
Cleveland, Ohio
February 18, 2010
155
| Item 9. | Changes in and Disagreements with Accountants on Accounting and Financial Disclosure. |
None.
| Item 9A. | Controls and Procedures. |
We maintain disclosure controls and procedures that are designed to ensure that information required to be disclosed in our Exchange Act reports is recorded, processed, summarized and reported within the time periods specified in the SEC’s rules and forms, and that such information is accumulated and communicated to our management, including our Chief Executive Officer and Chief Financial Officer, as appropriate, to allow timely decisions regarding required disclosure based solely on the definition of “disclosure controls and procedures” in Rule 13a-15(e) promulgated under the Exchange Act. In designing and evaluating the disclosure controls and procedures, management recognized that any controls and procedures, no matter how well designed and operated, can provide only reasonable assurance of achieving the desired control objectives, and management necessarily was required to apply its judgment in evaluating the cost-benefit relationship of possible controls and procedures.
As of the end of the period covered by this report, we carried out an evaluation under the supervision and with the participation of our management, including our Chief Executive Officer and our Chief Financial Officer, of the effectiveness of the design and operation of our disclosure controls and procedures. Based on the foregoing, our Chief Executive Officer and Chief Financial Officer concluded that our disclosure controls and procedures were effective at the reasonable assurance level.
156
Management’s Report on Internal Controls Over Financial Reporting
Our management is responsible for establishing and maintaining adequate internal control over financial reporting as such term is defined under Rule 13a-15(f) promulgated under the Securities Exchange Act of 1934, as amended.
Internal control over financial reporting is a process designed to provide reasonable assurance regarding the reliability of financial reporting and the preparation of the Company’s consolidated financial statements for external purposes in accordance with generally accepted accounting principles.
Internal control over financial reporting includes those policies and procedures that (i) pertain to the maintenance of records that, in reasonable detail, accurately and fairly reflect the transactions and dispositions of the assets of the Company; (ii) provide reasonable assurance that transactions are recorded as necessary to permit the preparation of the consolidated financial statements in accordance with generally accepted accounting principles, and that receipts and expenditures of the Company are being made only in accordance with appropriate authorizations of management and directors of the Company, and (iii) provide reasonable assurance regarding prevention or timely detection of unauthorized acquisition, use or disposition of the Company’s assets that could have a material effect on the consolidated financial statements.
Because of its inherent limitations, internal control over financial reporting may not prevent or detect misstatements. Also, projections of any evaluation of effectiveness to future periods are subject to the risk that controls may become inadequate because of changes in conditions, or that the degree of compliance with the policies or procedures may deteriorate.
Management conducted an assessment of the Company’s internal control over financial reporting as of December 31, 2009 using the framework specified in Internal Control — Integrated Framework, published by the Committee of Sponsoring Organizations of the Treadway Commission. Based on such assessment, management has concluded that the Company’s internal control over financial reporting was effective as of December 31, 2009.
The effectiveness of the Company’s internal control over financial reporting as of December 31, 2009 has been audited by Deloitte & Touche LLP, an independent registered public accounting firm, as stated in their report that appears herein.
February 18, 2010
Changes in Internal Control Over Financial Reporting
There have been no changes in our internal control over financial reporting, as defined in Rules 13a-15(f) and 15d-15(f) under the Securities Exchange Act of 1934, as amended, during the quarter ended December 31, 2009 that materially affected, or are reasonably likely to materially affect, our internal control over financial reporting.
| Item 9B. | Other Information. |
None.
157
| Item 10. | Directors, Executive Officers and Corporate Governance. |
The information required to be furnished by this Item will be set forth in our definitive Proxy Statement to Security Holders under the headings “Information Concerning Directors and Nominees”, “Section 16(a) Beneficial Ownership Reporting and Compliance”, “Business Ethics Policy”, “Board of Directors and Board Committees — Audit Committee”, and “Agreements and Transactions” and is incorporated herein by reference and made a part hereof from the Proxy Statement. The information regarding executive officers required by this Item is set forth in Part I hereof under the heading “Executive Officers of the Registrant”, which information is incorporated herein by reference and made a part hereof.
| Item 11. | Executive Compensation. |
The information required to be furnished by this Item will be set forth in our definitive Proxy Statement to Security Holders under the headings “Executive Compensation”, “Directors’ Compensation”, “Compensation Committee Interlocks and Insider Participation” and “Compensation Committee Report” and is incorporated herein by reference and made a part hereof from the Proxy Statement.
| Item 12. | Security Ownership of Certain Beneficial Owners and Management and Related Stockholder Matters. |
EQUITY COMPENSATION PLAN INFORMATION
The table below sets forth certain information regarding the following equity compensation plans as of December 31, 2009: the 1992 ICE Plan, the 2007 ICE Plan, the MPI Plan, the EMPI Plan and the Mine Performance Bonus Plan, which we refer to as the Mine Plan, the VNQDC Plan and the Directors’ Plan. Only the 1992 ICE Plan, the 2007 ICE Plan, the Directors’ Plan and the EMPI Plan have been approved by shareholders.
| Plan category |
Number of securities to be issued upon exercise of outstanding options, warrants and rights |
Weighted- average exercise price of outstanding options, warrants and rights |
Number of securities remaining available for future issuance under equity compensation plans (excluding securities reflected in column(a)) |
|||||
| (a) | (b) | (c) | ||||||
| Equity compensation plans approved by security holders |
1,113,844 | (1) | N/A | 1,604,866 | (2) | |||
| Equity compensation plans not approved by security holders |
— | N/A | (3 | ) |
| (1) | Includes 823,393 performance share awards for which issuance is dependent upon meeting certain performance targets, and 323,021 restricted awards for which issuance is based upon a three-year vesting period. |
| (2) | Includes 1,458,438 common shares remaining available under the 2007 ICE Plan, which authorizes the Compensation Committee to make awards of option rights, restricted shares, deferred shares, performance shares and performance units; and 146,428 common shares remaining available under the Directors’ Plan, which authorizes the award of restricted shares, which we refer to as the annual equity grant, to Directors upon their election or re-election to the Board at the annual meeting and provides (i) that the Directors are required to take $20,000 of the annual retainer in common shares unless they meet the Director share ownership guidelines, and (ii) may take up to 100 percent of their retainer and other fees in common shares. |
| (3) | The MPI Plan, the Mine Plan, and the VNQDC Plan provide for the issuance of common shares, but do not provide for a specific amount available under the plans. Descriptions of those plans are set forth below. |
158
MPI Plan
The Management Performance Incentive Plan, known as the MPI Plan, provides an opportunity for elected officers and other management employees to earn annual cash bonuses. Bonuses may also be paid in common shares. Certain participants in the MPI Plan may elect to defer all or a portion of such bonus into the VNQDC Plan. Each year the participants under the MPI Plan must make their cash bonus deferral election by December 31 of the year prior to the year in which the bonus is earned. A further election to exchange this bonus into shares may be made before payment of the bonus at a time selected by the Chief Executive Officer. We refer to these exchanged shares as bonus exchange shares. These participants may also elect at this time to have dividends credited with respect to the bonus exchange shares, either credited in additional deferred common shares, deferred in cash or paid out in cash in an in-service compensation distribution. In order to encourage elections to be credited with deferred common shares, the participants in the MPI Plan, who elect to have their cash bonuses credited to an account with bonus exchange shares, will be credited with restricted deferred common shares in the amount of 25 percent of the bonus exchange shares, which we refer to as bonus match shares. These participants must comply with the employment and non-distribution requirements for the bonus exchange shares during a five-year period for the bonus match shares to become vested and nonforfeitable.
Mine Plan
The Mine Plan provides an opportunity for senior mine managers to earn cash bonuses. Bonuses earned under the Mine Plan are determined and paid quarterly to the participants. Certain participants may elect to defer all or part of their quarterly cash bonuses under the VNQDC Plan. Participants in the Mine Plan may further elect to have his or her deferred cash bonus credited to an account with deferred common shares. Each year participants under the Mine Plan must make their bonus exchange shares election (for the four quarters of that year). Such elections must be made by December 31 of the year prior to the year in which the quarterly bonuses are earned. As with the participants electing bonus exchange shares under the MPI Plan, participants under the Mine Plan electing bonus exchange shares will receive or be credited with restricted bonus match shares in an amount of 25 percent of the bonus exchange shares with the same five-year vesting period.
VNQDC Plan
The VNQDC Plan was originally adopted by the Board of Directors to provide certain key management and highly compensated employees of ours or our selected affiliates with the opportunity to defer receipt of a portion of their regular compensation in order to defer taxation of these amounts. The VNQDC Plan also permits deferral of bonus awards under the MPI Plan, the EMPI Plan, the Mine Plan, and Performance Shares (awarded under the 1992 ICE Plan and 2007 ICE Plan). In addition, the VNQDC Plan contains the Management Share Acquisition Program, or (“MSAP”), whose purpose is to provide designated management employees with the opportunity to acquire deferred interests in common shares through deferral of their bonuses. The VNQDC Plan also contains the Officer Share Acquisition Program, or (“OSAP”), which permits elected officers who have not met the requirements of our Share Ownership Guidelines, to acquire deferred interests in common shares with compensation previously deferred in cash under the VNQDC Plan. When participants in the MPI Plan, the Mine Plan or the MSAP or OSAP elect to have accounts credited with deferred common shares under the VNQDC Plan, they receive a match equal to 25 percent of the value of the deferred common shares that is credited by us to the accounts of participants.
| Item 13. | Certain Relationships and Related Transactions, and Director Independence. |
The information required to be furnished by this Item will be set forth in our definitive Proxy Statement to Security Holders under the heading “Director Independence” and is incorporated herein by reference and made a part hereof from the Proxy Statement.
| Item 14. Principal | Accountant Fees and Services. |
The information required to be furnished by this Item will be set forth in our definitive Proxy Statement to Security Holders under the heading “Ratification of Independent Registered Public Accounting Firm” and is incorporated herein by reference and made a part hereof from the Proxy Statement.
159
| Item 15. Exhibits, | Financial Statement Schedules and Reports on Form 8-K. |
(a)(1) and (2) — List of Financial Statements and Financial Statement Schedules.
The following consolidated financial statements of Cliffs Natural Resources Inc. are included at Item 8 above:
Statements of Consolidated Financial Position — December 31, 2009 and 2008
Statements of Consolidated Operations — Years ended December 31, 2009, 2008 and 2007
Statements of Consolidated Cash Flows — Years ended December 31, 2009, 2008 and 2007
Statements of Consolidated Changes in Equity — Years ended December 31, 2009, 2008 and 2007
Notes to Consolidated Financial Statements
The following consolidated financial statement schedule of Cliffs Natural Resources Inc. is included herein in Item 15(d) and attached as Exhibit 99(a):
Schedule II — Valuation and Qualifying Accounts
All other schedules for which provision is made in the applicable accounting regulation of the Securities and Exchange Commission are not required under the related instructions or are inapplicable, and therefore have been omitted.
(3) List of Exhibits — Refer to Exhibit Index on pages 162-171, which is incorporated herein by reference.
(c) Exhibits listed in Item 15(a)(3) above are incorporated herein by reference.
(d) The schedule listed above in Item 15(a)(1) and (2) is attached as Exhibit 99(a) and incorporated herein by reference.
160
Pursuant to the requirements of Section 13 of the Securities Exchange Act of 1934, the Registrant has duly caused this report to be signed on its behalf by the undersigned, thereunto duly authorized.
| CLIFFS NATURAL RESOURCES INC. | ||||
| By: |
/s/ TERRANCE M. PARADIE | |||
| Name: | Terrance M. Paradie | |||
| Title: | Vice President – Corporate Controller and | |||
| Chief Accounting Officer | ||||
Date: February 18, 2010
Pursuant to the requirements of the Securities Exchange Act of 1934, this report has been signed below by the following persons on behalf of the Registrant and in the capacities and on the dates indicated.
| Signatures |
Title |
Date | ||
| /S/ J. CARRABBA J. Carrabba |
Chairman, President and Chief Executive Officer and Director (Principal Executive Officer) |
February 18, 2010 | ||
| /S/ L. BRLAS L. Brlas |
Executive Vice President and Chief Financial Officer (Principal Financial Officer) |
February 18, 2010 | ||
| * R. C. Cambre |
Director | February 18, 2010 | ||
| * S. M. Cunningham |
Director | February 18, 2010 | ||
| * B. J. Eldridge |
Director | February 18, 2010 | ||
| * S. M. Green |
Director | February 18, 2010 | ||
| * J. K. Henry |
Director | February 18, 2010 | ||
| * J. D. Ireland, III |
Director | February 18, 2010 | ||
| * F. R. McAllister |
Director | February 18, 2010 | ||
| * R. Phillips |
Director | February 18, 2010 | ||
| * R. K. Riederer |
Director | February 18, 2010 | ||
| * A. Schwartz |
Director | February 18, 2010 | ||
| * | The undersigned, by signing his name hereto, does sign and execute this Annual Report on Form 10-K pursuant to a Power of Attorney executed on behalf of the above-indicated officers and directors of the registrant and filed herewith as Exhibit 24 on behalf of the registrant. |
| By: |
/s/ L. Brlas | |
| (L. Brlas, as Attorney-in-Fact) |
161
EXHIBIT INDEX
All documents referenced below were filed pursuant to the Securities Exchange Act of 1934 by Cliffs Natural Resources Inc., file number 1-09844, unless otherwise indicated.
| Exhibit |
Pagination by Sequential Numbering System | |||
| Plan of acquisition, reorganization, arrangement, liquidation or succession | ||||
| 2(a) |
# Share Purchase Agreement by and among Cliffs International Lux IV Sarl, Centennial Asset Mining Fund LLC, Eike Fuhrken Batista, and, for limited purposes, MMX Mineração e Metálicos S.A. dated December 12, 2006 (filed as Exhibit 2(a) to Form 10-K of Cliffs on May 25, 2007 and incorporated by reference) | Not Applicable | ||
| 2(b) |
# Unit Purchase Agreement by and among Cleveland-Cliffs Inc and PinnOak Resources, LLC, The Regent Investment Company, L.P., Questor Partners Fund II, L.P., Questor Side-by-Side Partners II, L.P., Questor Side-by-Side Partners II 3(c)1, L.P., Questor Partners Fund II AIV-1, LLC, Questor General Partner II, L.P. and PinnOak Resources Employee Equity Incentive Plan, LLC dated June 14, 2007 (filed as Exhibit 2(a) to Form 10-Q of Cliffs on August 3, 2007 and incorporated by reference) | Not Applicable | ||
| 2(c) |
# Purchase and Sale Agreement by and among Cliffs UTAC Holding LLC, Cleveland-Cliffs Inc., United Mining Co., Ltd., and Laiwu Steel Group Ltd. dated July 11, 2008 (filed as Exhibit 2(a) to Form 10-Q of Cliffs on July 31, 2008 and incorporated by reference) | Not Applicable | ||
| Articles of Incorporation and By-Laws of Cliffs Natural Resources Inc. | ||||
| 3(a) |
Regulations of Cleveland-Cliffs Inc. (filed as Exhibit 3(b) to Form 10-K of Cliffs filed on February 2, 2001 and incorporated by reference) | Not Applicable | ||
| 3(b) |
Amended Articles of Incorporation of Cleveland-Cliffs Inc as filed with the Secretary of State of the State of Ohio on January 20, 2004 (filed as Exhibit 3(a) to Form 10-K of Cliffs on February 13, 2004 and incorporated by reference) | Not Applicable | ||
| 3(c) |
Amendment to Amended Articles of Incorporation as filed with the Secretary of State of the State of Ohio on November 30, 2004 (filed as Exhibit 3(a) to Form 8-K of Cliffs on November 30, 2004 and incorporated by reference) | Not Applicable | ||
| 3(d) |
Amendment No. 2 to Amended Articles of Incorporation as filed with the Secretary of State of the State of Ohio (filed as Exhibit 3(a) to Form 8-K of Cliffs on June 9, 2006 and incorporated by reference) | Not Applicable | ||
| 3(e) |
Amendment No. 3 to Amended Articles of Incorporation as filed with the Secretary of State of the State of Ohio on April 21, 2008 (filed as Exhibit 3(a) to Form 8-K of Cliffs on April 23, 2008 and incorporated by reference) | Not Applicable | ||
| 3(f) |
Amendment No. 4 to Amended Articles of Incorporation as filed with the Secretary of State of Ohio on October 3, 2008 (filed as Exhibit 3(a) to Amendment No. 2 of Form S-4 of Cliffs filed on October 15, 2008 and incorporated by reference) | Not Applicable | ||
| 3(g) |
Amendment No. 5 to Amended Articles of Incorporation as filed with the Secretary of State of Ohio on September 30, 2009 (filed as Exhibit 3(a) to Form 10-Q of Cliffs filed on October 29, 2009 and incorporated by reference) | Not Applicable | ||
| # | The Company agrees to furnish supplementally a copy of any omitted exhibits or schedules to the Securities and Exchange Commission upon request. |
162
| Exhibit |
Pagination by Sequential Numbering System | |||
| Instruments defining rights of security holders, including indentures | ||||
| 4(a) |
Multicurrency Credit Agreement among Cleveland-Cliffs Inc, Bank of America, N.A., as Administrative Agent, Swing Line Lender and Letter of Credit Issuer, JP Morgan Chase Bank, N.A., as Syndication Agent, and 11 other financial institutions dated August 17, 2007 (filed as exhibit 4(a) to Form 8-K of Cliffs on August 20, 2007 and incorporated by reference) | Not Applicable | ||
| 4(b) |
First Amendment to Multicurrency Credit Agreement among Cleveland-Cliffs Inc, Bank of America, N.A. as Administrative Agent, Swing Line Lender and Letter of Credit Issuer and certain other financial institutions dated May 15, 2008 (filed as Exhibit 4(a) to Form 8-K of Cliffs on May 21, 2008 and incorporated by reference) | Not Applicable | ||
| 4(c) |
Second Amendment to Multicurrency Credit Agreement among Cliffs Natural Resources Inc. (f/k/a Cleveland-Cliffs Inc), Bank of America, N.A., as Administrative Agent, Swing Line Lender and L/C Issuer, and certain other financial institutions dated October 29, 2009 | Filed Herewith | ||
| 4(d) |
Note Purchase Agreement dated June 25, 2008 by and among Cleveland-Cliffs Inc and the institutional investors party thereto (filed as Exhibit 4(a) to Form 8-K of Cliffs Inc on June 30, 2008 and incorporated by reference) | Not Applicable | ||
| 4(e) |
Form of Common Share Certificate (filed as Exhibit 4(a) to Form 10-Q of Cliffs on October 30, 2008 and incorporated by reference) | Not Applicable | ||
| 4(f) |
Rights Agreement dated October 13, 2008 by and between Cleveland-Cliffs Inc and Computershare Trust Company, N.A. as Rights Agent (filed as Exhibit 4(a) to Form 8-A of Cliffs on October 14, 2008 and incorporated by reference) | Not Applicable | ||
| Material Contracts | ||||
| 10(a) |
* Cleveland-Cliffs Inc Change in Control Severance Pay Plan, effective as of January 1, 2000 (filed as Exhibit 10(jj) to Form 10-K of Cliffs on March 16, 2000 and incorporated by reference) | Not Applicable | ||
| 10(b) |
* Cleveland-Cliffs Inc Voluntary Non-Qualified Deferred Compensation Plan (Amended and Restated as of January 1, 2000) (filed as Exhibit 10(a) to Form 10-Q of Cleveland-Cliffs Inc on July 27, 2000 and incorporated by reference) | Not Applicable | ||
| 10(c) |
* Form of Indemnification Agreement between Cleveland-Cliffs Inc and Directors (filed as Exhibit 10(f) to Form 10-K of Cliffs on February 2, 2001 and incorporated by reference) | Not Applicable | ||
| 10(d) |
* Amended and Restated Cleveland-Cliffs Inc Retirement Plan for Non-Employee Directors effective on July 1, 1995 (filed as Exhibit 10(l) to Form 10-K of Cliffs on February 2, 2001 and incorporated by reference) | Not Applicable | ||
| 10(e) |
* Amendment to Amended and Restated Cleveland-Cliffs Inc Retirement Plan for Non-Employee Directors dated as of January 1, 2001 (filed as Exhibit 10(d) to Form 10-Q of Cliffs on July 27, 2001 and incorporated by reference) | Not Applicable | ||
| 10(f) |
* Second Amendment to the Amended and Restated Cleveland-Cliffs Inc Retirement Plan for Non-Employee Directors dated and effective January 14, 2003 (filed as Exhibit 10(a) to Form 10-Q of Cliffs on April 24, 2003 and incorporated by reference) | Not Applicable | ||
| 10(g) |
* Cleveland-Cliffs Inc 2000 Retention Unit Plan, effective as of May 8, 2000 (filed as Exhibit 10(ss) to Form 10-K of Cliffs on February 2, 2001 and incorporated by reference) | Not Applicable | ||
| * | Reflects management contract or other compensatory arrangement required to be filed as an Exhibit pursuant to Item 15(c) of this Report. |
163
| Exhibit |
Pagination by Sequential Numbering System | |||
| 10(h) |
* Cleveland-Cliffs Inc 1992 Incentive Equity Plan (as Amended and Restated as of May 13, 1997), effective as of May 13, 1997 (filed as Exhibit 10(i) to Form 10-K of Cliffs on February 5, 2002 and incorporated by reference) | Not Applicable | ||
| 10(i) |
* Amendment to the Cleveland-Cliffs Inc 1992 Incentive Equity Plan (as Amended and Restated as of May 13, 1997), effective May 11, 1999 (filed as Appendix A to Proxy Statement of Cliffs on March 22, 1999 and incorporated by reference) | Not Applicable | ||
| 10(j) |
* Cleveland-Cliffs Inc Long-Term Incentive Program, effective as of May 8, 2000 (filed as Exhibit 10(rr) to Form 10-K of Cliffs on February 2, 2001 and incorporated by reference) | Not Applicable | ||
| 10(k) |
* Amendment No. 1 to the Long-Term Incentive Program dated May 8, 2006 and effective as of January 1, 2006 (filed as Exhibit 10(b) to Form 8-K of Cliffs on May 12, 2006 and incorporated by reference) | Not Applicable | ||
| 10(l) |
* Cleveland-Cliffs Inc and Subsidiaries Management Performance Incentive Plan, effective January 1, 2004 (filed as Exhibit 19(c) to Form 10-Q of Cliffs on July 29, 2007 and incorporated by reference) | Not Applicable | ||
| 10(m) |
* Form of the Restricted Shares Agreement under the Cleveland-Cliffs Inc 1992 Incentive Equity Plan (as Amended and Restated as of May 13, 1997) as amended, between Cliffs and Joseph A. Carrabba effective May 23, 2005 (filed as Exhibit 10(c) to Form 10-Q of Cliffs on July 28, 2005 and incorporated by reference) | Not Applicable | ||
| 10(n) |
* Form of the 2006 Restricted Shares Agreement for the Retirement Eligible Employee (filed as Exhibit 99(a) to Form 8-K of Cliffs on March 17, 2006 and incorporated by reference) | Not Applicable | ||
| 10(o) |
* Form of the 2006 Restricted Shares Agreement for the Non-Retirement Eligible Employee (filed as Exhibit 99(b) to Form 8-K of Cliffs on March 17, 2006 and incorporated by reference) | Not Applicable | ||
| 10(p) |
* Form of Long-Term Incentive Program Participant Grant and Agreement Year 2006 for Performance Period 2006-2008 (filed as Exhibit 10(a) to Form 8-K of Cliffs on May 12, 2006 and incorporated by reference) | Not Applicable | ||
| 10(q) |
* Amendment No. 1 to Long-Term Incentive Program Participant Grant and Agreement for Joseph A. Carrabba as set forth by Cleveland-Cliffs Inc dated September 15, 2006 and effective as of September 1, 2006 (filed as Exhibit 10(jjj) to Form 10-K of Cliffs on May 25, 2007 and incorporated by reference) | Not Applicable | ||
| 10(r) |
* Form of Long-Term Incentive Program Method of Calculation of Payout of Performance Shares Election Form for the Long-Term Incentive Program Grants and Agreements Years 2005 and 2006 (filed as Exhibit 10(mmm) to Form 10-K of Cliffs on May 25, 2007 and incorporated by reference) | Not Applicable | ||
| 10(s) |
* Form of letter to Participants of the 2006-2008 and 2007-2009 Performance Share Periods amending the payment calculation method to be used for 2006 and 2007 Performance Share Grants, dated May 27, 2008 (filed as Exhibit 10(nnn) to Form 10-Q of Cliffs on July 31, 2008 and incorporated by reference) | Not Applicable | ||
| * | Reflects management contract or other compensatory arrangement required to be filed as an Exhibit pursuant to Item 15(c) of this Report. |
164
| Exhibit |
Pagination by Sequential Numbering System | |||
| 10(t) |
* Omnibus Amendment to Outstanding Grants Under Cleveland-Cliffs Inc 1992 Incentive Equity Plan (as Amended and Restated as of May 13, 1997) dated January 13, 2009 between Cliffs Natural Resources Inc. and Plan participants (filed as Exhibit 10(u) to Form 10-K of Cliffs on February 26, 2009 and incorporated by reference) | Not Applicable | ||
| 10(u) |
* Trust Agreement No. 1 (Amended and Restated effective June 1, 1997), dated June 12, 1997, by and between Cleveland-Cliffs Inc and KeyBank National Association, Trustee, with respect to the Cleveland-Cliffs Inc Supplemental Retirement Benefit Plan, Severance Pay Plan for Key Employees and certain executive agreements (filed as Exhibit 10(o) to Form 10-K of Cliffs on February 5, 2002 and incorporated by reference) | Not Applicable | ||
| 10(v) |
* Trust Agreement No. 1 Amendments to Exhibits, effective as of January 1, 2000, by and between Cleveland-Cliffs Inc and KeyBank National Association, as Trustee (filed as Exhibit 10(n) to Form 10-K of Cliffs on March 16, 2000 and incorporated by reference) | Not Applicable | ||
| 10(w) |
* First Amendment to Trust Agreement No. 1, effective September 10, 2002, by and between Cleveland-Cliffs Inc and KeyBank National Association, as Trustee (filed as Exhibit 10(p) to Form 10-K of Cliffs on February 5, 2003 and incorporated by reference) | Not Applicable | ||
| 10(x) |
* Second Amendment to Trust Agreement No. 1 between Cliffs Natural Resources Inc. (f/k/a Cleveland-Cliffs Inc) and KeyBank, N.A. entered into and effective as of December 31, 2008 (filed as Exhibit 10(y) to Form 10-K of Cliffs on February 26, 2009 and incorporated by reference) | Not Applicable | ||
| 10(y) |
* Amended and Restated Trust Agreement No. 2, effective as of October 15, 2002, by and between Cleveland-Cliffs Inc and KeyBank National Association, Trustee, with respect to Executive Agreements and Indemnification Agreements with the Company’s Directors and certain Officers, the Company’s Severance Pay Plan for Key Employees, and the Retention Plan for Salaried Employees (filed as Exhibit 10(q) to Form 10-K of Cliffs on February 5, 2003 and incorporated by reference) | Not Applicable | ||
| 10(z) |
* Second Amendment to Amended and Restated Trust Agreement No. 2 between Cliffs Natural Resources Inc. (f/k/a Cleveland-Cliffs Inc) and KeyBank, N.A. entered into and effective as of December 31, 2008 (filed as Exhibit 10(aa) to Form 10-K of Cliffs on February 26, 2009 and incorporated by reference) | Not Applicable | ||
| 10(aa) |
* Trust Agreement No. 5, dated as of October 28, 1987, by and between Cleveland-Cliffs Inc and KeyBank National Association, Trustee, with respect to the Cleveland-Cliffs Inc Voluntary Non-Qualified Deferred Compensation Plan (filed as Exhibit 10(v) to Form 10-K of Cliffs on February 2, 2001 and incorporated by reference) | Not Applicable | ||
| 10(bb) |
* First Amendment to Trust Agreement No. 5, dated as of May 12, 1989, by and between Cleveland-Cliffs Inc and KeyBank National Association, Trustee (filed as Exhibit 10(x) to Form 10-K of Cliffs on February 2, 2001 and incorporated by reference) | Not Applicable | ||
| * | Reflects management contract or other compensatory arrangement required to be filed as an Exhibit pursuant to Item 15(c) of this Report. |
165
| Exhibit |
Pagination by Sequential Numbering System | |||
| 10(cc) |
* Second Amendment to Trust Agreement No. 5, dated as of April 9, 1991, by and between Cleveland-Cliffs Inc and KeyBank National Association, Trustee (filed as Exhibit 10(y) to Form 10-K of Cliffs on February 2, 2001 and incorporated by reference) | Not Applicable | ||
| 10(dd) |
* Third Amendment to Trust Agreement No. 5, dated as of March 9, 1992, by and between Cleveland-Cliffs Inc and KeyBank National Association, Trustee (filed as Exhibit 10(z) to Form 10-K of Cliffs on February 2, 2001 and incorporated by reference) | Not Applicable | ||
| 10(ee) |
* Fourth Amendment to Trust Agreement No. 5, dated November 18, 1994, by and between Cleveland-Cliffs Inc and KeyBank National Association, Trustee (filed as Exhibit 10(w) to Form 10-K of Cliffs on March 16, 2000 and incorporated by reference) | Not Applicable | ||
| 10(ff) |
* Fifth Amendment to Trust Agreement No. 5, dated May 23, 1997, by and between Cleveland-Cliffs Inc and KeyBank National Association, Trustee (filed as Exhibit 10(cc) to Form 10-K of Cliffs on February 5, 2002 and incorporated by reference) | Not Applicable | ||
| 10(gg) |
* Sixth Amendment to Trust Agreement No. 5 between Cliffs Natural Resources Inc. (f/k/a Cleveland-Cliffs Inc) and KeyBank, N.A. entered into and effective as of December 31, 2008 (filed as Exhibit 10(hh) to Form 10-K of Cliffs on February 26, 2009 and incorporated by reference) | Not Applicable | ||
| 10(hh) |
* Trust Agreement No. 7, dated as of April 9, 1991, by and between Cleveland-Cliffs Inc and KeyBank National Association, Trustee, with respect to the Cleveland-Cliffs Inc Supplemental Retirement Benefit Plan (filed as Exhibit 10(ee) to Form 10-K of Cliffs on February 2, 2001 and incorporated by reference) | Not Applicable | ||
| 10(ii) |
* First Amendment to Trust Agreement No. 7, by and between Cleveland-Cliffs Inc and KeyBank National Association, Trustee, dated as of March 9, 1992 (filed as Exhibit 10(ff) to Form 10-K of Cliffs on February 2, 2001 and incorporated by reference) | Not Applicable | ||
| 10(jj) |
* Second Amendment to Trust Agreement No. 7, dated November 18, 1994, by and between Cleveland-Cliffs Inc and KeyBank National Association, Trustee (filed as Exhibit 10(bb) to Form 10-K of Cliffs on March 16, 2000 and incorporated by reference) | Not Applicable | ||
| 10(kk) |
* Third Amendment to Trust Agreement No. 7, dated May 23, 1997, by and between Cleveland-Cliffs Inc and KeyBank National Association, Trustee (filed as Exhibit 10(ii) to Form 10-K of Cliffs on February 5, 2002 and incorporated by reference) | Not Applicable | ||
| 10(ll) |
* Fourth Amendment to Trust Agreement No. 7, dated July 15, 1997, by and between Cleveland-Cliffs Inc and KeyBank National Association, Trustee (filed as Exhibit 10(jj) to Form 10-K of Cliffs on February 5, 2002 and incorporated by reference) | Not Applicable | ||
| 10(mm) |
* Amendment to Exhibits to Trust Agreement No. 7, effective as of January 1, 2000, by and between Cleveland-Cliffs Inc and KeyBank National Association, Trustee (filed as Exhibit 10(ee) to Form 10-K of Cliffs on March 16, 2000 and incorporated by reference) | Not Applicable | ||
| * | Reflects management contract or other compensatory arrangement required to be filed as an Exhibit pursuant to Item 15(c) of this Report. |
166
| Exhibit |
Pagination by Sequential Numbering System | |||
| 10(nn) |
* Sixth Amendment to Trust Agreement No. 7 between Cliffs Natural Resources Inc. (f/k/a Cleveland-Cliffs Inc) and KeyBank, N.A. entered into and effective as of December 31, 2008 (filed as Exhibit 10(oo) to Form 10-K of Cliffs on February 26, 2009 and incorporated by reference) | Not Applicable | ||
| 10(oo) |
* Trust Agreement No. 8, dated as of April 9, 1991, by and between Cleveland-Cliffs Inc and KeyBank National Association, Trustee, with respect to the Cleveland-Cliffs Inc Retirement Plan for Non-Employee Directors (filed as Exhibit 10(kk) to Form 10-K of Cliffs on February 2, 2001 and incorporated by reference) | Not Applicable | ||
| 10(pp) |
* First Amendment to Trust Agreement No. 8, dated as of March 9, 1992, by and between Cleveland-Cliffs Inc and KeyBank National Association, Trustee (filed as Exhibit 10(ll) to Form 10-K of Cliffs on February 2, 2001 and incorporated by reference) | Not Applicable | ||
| 10(qq) |
* Second Amendment to Trust Agreement No. 8, dated June 12, 1997, by and between Cleveland-Cliffs Inc and KeyBank National Association, Trustee (filed as Exhibit 10(nn) to Form 10-K of Cliffs on February 5, 2002 and incorporated by reference) | Not Applicable | ||
| 10(rr) |
* Third Amendment to Trust Agreement No. 8 between Cliffs Natural Resources Inc. (f/k/a Cleveland-Cliffs Inc) and KeyBank, N.A. entered into and effective as of December 31, 2008 (filed as Exhibit 10(ss) to Form 10-K of Cliffs on February 26, 2009 and incorporated by reference) | Filed Herewith | ||
| 10(ss) |
* Trust Agreement No. 9, dated as of November 20, 1996, by and between Cleveland-Cliffs Inc and KeyBank National Association, Trustee, with respect to the Cleveland-Cliffs Inc Nonemployee Directors’ Supplemental Compensation Plan (filed as Exhibit 10(oo) to Form 10-K of Cliffs on February 5, 2002 and incorporated by reference) | Not Applicable | ||
| 10(tt) |
* First Amendment to Trust Agreement No. 9 between Cliffs Natural Resources Inc. (f/k/a Cleveland-Cliffs Inc) and KeyBank, N.A. entered into and effective as of December 31, 2008 (filed as Exhibit 10(uu) to Form 10-K of Cliffs on February 26, 2009 and incorporated by reference) | Not Applicable | ||
| 10(uu) |
* Trust Agreement No. 10, dated as of November 20, 1996, by and between Cleveland-Cliffs Inc and KeyBank National Association, Trustee, with respect to the Cleveland-Cliffs Inc Nonemployee Directors’ Compensation Plan (filed as Exhibit 10(pp) to Form 10-K of Cliffs on February 5, 2002 and incorporated by reference) | Not Applicable | ||
| 10(vv) |
* First Amendment to Trust Agreement No. 10 between Cliffs Natural Resources Inc. (f/k/a Cleveland-Cliffs Inc) and KeyBank, N.A. entered into and effective as of December 31, 2008 (filed as Exhibit 10(ww) to Form 10-K of Cliffs on February 26, 2009 and incorporated by reference) | Not Applicable | ||
| 10(ww) |
* Letter Agreement of Employment by and between Cleveland-Cliffs Inc and Joseph A. Carrabba dated April 29, 2005 (filed as Exhibit 10(b) to Form 10-Q of Cliffs on July 28, 2005 and incorporated by reference) | Not Applicable | ||
| 10(xx) |
* Letter Agreement of Employment by and between Cleveland-Cliffs Inc and Laurie Brlas dated November 22, 2006 (filed as Exhibit 10(a) to Form 8-K of Cliffs on November 28, 2006 and incorporated by reference) | Not Applicable | ||
| * | Reflects management contract or other compensatory arrangement required to be filed as an Exhibit pursuant to Item 15(c) of this Report. |
167
| Exhibit |
Pagination by Sequential Numbering System | |||
| 10(yy) |
* Letter Agreement of Employment by and between Cleveland-Cliffs Inc and William Brake dated April 4, 2007 (filed as Exhibit 10(a) to Form 8-K of Cliffs on April 10, 2007 and incorporated by reference) | Not Applicable | ||
| 10(zz) |
* Cleveland-Cliffs Inc Executive Management Performance Incentive Plan adopted July 27, 2007 and effective as of January 1, 2007 (filed as Annex C to the proxy statement of Cliffs on June 15, 2007 and incorporated by reference) | Not Applicable | ||
| 10(aaa) |
* First Amendment to Executive Management Performance Incentive Plan dated December 31, 2008 (filed as Exhibit 10(bbb) to Form 10-K of Cliffs on February 26, 2009 and incorporated by reference) | Not Applicable | ||
| 10(bbb) |
* Cleveland-Cliffs Inc 2007 Incentive Equity Plan adopted July 27, 2007 and effective as of March 13, 2007 (filed as Annex B to the proxy statement of Cliffs on June 15, 2007 and incorporated by reference) | Not Applicable | ||
| 10(ccc) |
* First Amendment to Cleveland-Cliffs Inc 2007 Incentive Equity Plan dated as of August 11, 2008 (filed as Exhibit 10(b) of Form 8-K of Cliffs on August 14, 2008 and incorporated by reference) | Not Applicable | ||
| 10(ddd) |
* Second Amendment to 2007 Incentive Equity Plan dated December 31, 2008 by Cliffs Natural Resources Inc. (filed as Exhibit 10(eee) to Form 10-K of Cliffs on February 26, 2009 and incorporated by reference) | Not Applicable | ||
| 10(eee) |
* Amendment No. 3 to the Cleveland-Cliffs Inc 2007 Incentive Equity Plan dated as of January 13, 2009 by Cliffs Natural Resources Inc. (filed as Exhibit 10(fff) to Form 10-K of Cliffs on February 26, 2009 and incorporated by reference) | Not Applicable | ||
| 10(fff) |
* Form of 2007 Participant Grant and Agreement effective March 13, 2007 from the Cleveland-Cliffs Inc 2007 Incentive Equity Plan (filed as Exhibit 10(d) to Form 10-Q of Cliffs on August 3, 2007 and incorporated by reference) | Not Applicable | ||
| 10(ggg) |
* Form of 2008 Participant Grant and Agreement Under the 2007 Incentive Equity Plan for performance grant period January 1, 2008 through December 31, 2009, effective March 10, 2008 (filed as Exhibit 10(b) to Form 10-Q of Cliffs on July 31, 2008 and incorporated by reference) | Not Applicable | ||
| 10(hhh) |
* Omnibus Amendment To Restricted Shares Agreements, Participant Grant and Agreements, 1992 Incentive Equity Plan, 2007 Incentive Equity Plan, Long-Term Incentive Program, and 2000 Retention Plan dated December 31, 2008 by Cliffs Natural Resources Inc. (filed as Exhibit 10(iii) to Form 10-K of Cliffs on February 26, 2009 and incorporated by reference) | Not Applicable | ||
| 10(iii) |
* Omnibus Amendment to Outstanding Grants Under Cleveland-Cliffs Inc 2007 Incentive Equity Plan dated January 13, 2009 between Cliffs Natural Resources Inc. and Plan participants (filed as Exhibit 10(jjj) to Form 10-K of Cliffs on February 26, 2009 and incorporated by reference) | Not Applicable | ||
| 10(jjj) |
* Form of Amendment and Restatement of Severance Agreement entered into between Cliffs Natural Resources Inc. and elected officers and certain mine managers (filed as Exhibit 10(b) to Form 8-K of Cliffs on November 14, 2008 and incorporated by reference) | Not Applicable | ||
| 10(kkk) |
* Cliffs Natural Resources Inc. 2005 Voluntary Non-Qualified Deferred Compensation Plan (Effective as of January 1, 2005) dated November 11, 2008 (filed as Exhibit 10(a) to Form 8-K of Cliffs on November 14, 2008 and incorporated by reference) | Not Applicable | ||
| * | Reflects management contract or other compensatory arrangement required to be filed as an Exhibit pursuant to Item 15(c) of this Report. |
168
| Exhibit |
Pagination by Sequential Numbering System | |||
| 10(lll) |
* First Amendment to Cliffs Natural Resources Inc. 2005 Voluntary Non-Qualified Deferred Compensation Plan dated September 2, 2009 and effective as of January 1, 2009 (filed as Exhibit 10(a) to Form 10-Q of Cliffs on October 29, 2009 and incorporated by reference) | Not Applicable | ||
| 10(mmm) |
* Cliffs Natural Resources Inc. Supplemental Retirement Benefit Plan (as Amended and Restated effective December 1, 2006) dated December 31, 2008 (filed as Exhibit 10(mmm) to Form 10-K of Cliffs on February 26, 2009 and incorporated by reference) | Not Applicable | ||
| 10(nnn) |
* Cliffs Natural Resources Inc. Nonemployee Directors’ Compensation Plan (Amended and Restated as of December 31, 2008) (filed as Exhibit 10(nnn) to Form 10-K of Cliffs on February 26, 2009 and incorporated by reference) | Not Applicable | ||
| 10(ooo) |
Registration Rights Agreement dated as of July 11, 2008 by and between Cleveland-Cliffs Inc and United Mining Co., Ltd. (filed as Exhibit 10(e) to Form 10-Q of Cliffs on July 31, 2008 and incorporated by reference) | Not Applicable | ||
| 10(ppp) |
Payment Agreement among Cleveland-Cliffs Inc, Cliffs Mining Company, The Regent Investment Company, L.P., Questor Partners Fund II, L.P., Questor Side-by-Side Partners II, L.P., Questor Side-by-Side Partners II 3(c)1, L.P., Questor General Partner II, L.P., and PinnOak Resources Employee Equity Incentive Plan, LLC, entered into October 3, 2008 (filed as Exhibit 10(a) for Form S-3 of Cliffs on October 7, 2008 and incorporated by reference) | Not Applicable | ||
| 10(qqq) |
2009 Participant Grant Under the 2007 Incentive Equity Plan by and between Cliffs and Joseph A. Carrabba effective December 17, 2009 subject to Terms and Conditions of the 2009 Participant Grant to Joseph A. Carrabba Under the 2007 Incentive Equity Plan adopted February 16, 2010, and effective December 17, 2009 | Filed Herewith | ||
| 10(rrr) |
** Pellet Sale and Purchase Agreement, dated and effective as of January 31, 2002, by and among The Cleveland-Cliffs Iron Company, Cliffs Mining Company, Northshore Mining Company and Algoma Steel Inc. (filed as Exhibit 10(a) to Form 10-Q of Cliffs on April 25, 2002 and incorporated by reference) | Not Applicable | ||
| 10(sss) |
** Pellet Sale and Purchase Agreement, dated and effective as of April 10, 2002, by and among The Cleveland-Cliffs Iron Company, Cliffs Mining Company, Northshore Mining Company, Northshore Sales Company, International Steel Group Inc., ISG Cleveland Inc., and ISG Indiana Harbor Inc. (filed as Exhibit 10(a) to Form 10-Q of Cliffs on July 25, 2002 and incorporated by reference) | Not Applicable | ||
| 10(ttt) |
** First Amendment to Pellet Sale and Purchase Agreement, dated and effective December 16, 2004 by and among The Cleveland-Cliffs Iron Company, Cliffs Mining Company, Northshore Mining Company, Cliffs Sales Company (formerly known as Northshore Sales Company), International Steel Group Inc., ISG Cleveland Inc., and ISG Indiana Harbor (filed as Exhibit 10(a) to Form 8-K of Cliffs on December 29, 2004, and incorporated by reference) | Not Applicable | ||
| * | Reflects management contract or other compensatory arrangement required to be filed as an Exhibit pursuant to Item 15(c) of this Report. |
| ** | Confidential treatment requested and/or approved as to certain portions, which portions have been omitted and filed separately with the Securities and Exchange Commission. |
169
| Exhibit |
Pagination by Sequential Numbering System | |||
| 10(uuu) |
** Pellet Sale and Purchase Agreement, dated and effective as of December 31, 2002 by and among The Cleveland-Cliffs Iron Company, Cliffs Mining Company, and Ispat Inland Inc. (filed as Exhibit 10(vv) to Form 10-K of Cliffs filed on February 5, 2003, and incorporated by reference) | Not Applicable | ||
| 10(vvv) |
** Amended and Restated Pellet Sale and Purchase Agreement, dated and effective as of May 17, 2004, by and among The Cleveland-Cliffs Iron Company, Cliffs Mining Company, Northshore Mining Company, Cliffs Sales Company, International Steel Group Inc., and ISG Weirton Inc. (filed as Exhibit 10(a) of Form 8-K of Cliffs on September 21, 2004, and incorporated by reference) | Not Applicable | ||
| 10(www) |
** Umbrella Agreement between Mittal Steel USA and Cleveland-Cliffs Inc, The Cleveland-Cliffs Iron Company, Cliffs Mining Company, Northshore Mining Company, and Cliffs Sales Company amending three existing pellet sales contracts for Mittal Steel USA-Indiana Harbor West (Exhibit 10(sss) and 10(ttt) above in this index), Mittal Steel USA-Indiana Harbor East (Exhibit 10(uuu) above in this index), and Mittal Steel USA-Weirton (Exhibit 10(vvv) above in this index), dated as of March 1, 2007 and effective as of April 12, 2006 (filed as Exhibit 10(www) for Form 10-K of Cliffs on May 25, 2007 and incorporated by reference) | Not Applicable | ||
| 10(xxx) |
** Amended and Restated Pellet Sale and Purchase Agreement, dated and effective January 1, 2006 by and among Cliffs Sales Company, The Cleveland-Cliffs Iron Company, Cliffs Mining Company, and Severstal North America, Inc. (filed as Exhibit 10(fff) of Form 10-K of Cliffs on February 21, 2006 and incorporated by reference) | Not Applicable | ||
| 10(yyy) |
** Term Sheet for Amendment and Extension of the Amended and Restated Pellet Sale and Purchase Agreement among Cliffs Sales Company, The Cleveland-Cliffs Iron Company, Cliffs Mining Company, and Severstal North America, Inc. (filed as Exhibit 10(d) to Form 10-Q of Cliffs on July 31, 2008 and incorporated by reference) | Not Applicable | ||
| 10(zzz) |
** Term Sheet for Modification of Certain Terms of the Pellet Sale and Purchase Agreement by and between Cliffs and Severstal dated and effective December 15, 2008 (filed as Exhibit 10(a) to Form 10-Q of Cliffs on July 30, 2009 and incorporated by reference) | Not Applicable | ||
| 10(aaaa) |
** Term Sheet for Modification of Certain Terms of the Pellet Sale and Purchase Agreement by and between Cliffs and Severstal dated and effective June 19, 2009 (filed as Exhibit 10(b) to Form 10-Q of Cliffs on July 30, 2009 and incorporated by reference) | Not Applicable | ||
| 10(bbbb) |
** Pellet Sale and Purchase Agreement by and among The Cleveland-Cliffs Iron Company, Cliffs Sales Company, and AK Steel Corporation dated November 10, 2006 and effective January 1, 2007 through December 31, 2013 (filed as Exhibit 10(a) to Form 8-K of Cliffs on November 15, 2006 and incorporated by reference) | Not Applicable | ||
| ** | Confidential treatment requested and/or approved as to certain portions, which portions have been omitted and filed separately with the Securities and Exchange Commission. |
170
| Exhibit |
Pagination by Sequential Numbering System | |||
| 12 |
Ratio of Earnings To Combined Fixed Charges And Preferred Stock Dividend Requirements | Filed Herewith | ||
| 21 |
Subsidiaries of the registrant | Filed Herewith | ||
| 23 |
Consent of independent auditors | Filed Herewith | ||
| 24 |
Power of Attorney | Filed Herewith | ||
| 31(a) |
Certification Pursuant to 15 U.S.C. Section 7241, as Adopted Pursuant to Section 302 of the Sarbanes-Oxley Act of 2002, signed and dated by Joseph A. Carrabba as of February 18, 2010 | Filed Herewith | ||
| 31(b) |
Certification Pursuant to 15 U.S.C. Section 7241, as Adopted Pursuant to Section 302 of the Sarbanes-Oxley Act of 2002, signed and dated by Laurie Brlas as of February 18, 2010 | Filed Herewith | ||
| 32(a) |
Certification Pursuant to 18 U.S.C. Section 1350, as Adopted Pursuant to Section 906 of the Sarbanes-Oxley Act of 2002, signed and dated by Joseph A. Carrabba, President and Chief Executive Officer of Cliffs Natural Resources Inc., as of February 18, 2010 | Filed Herewith | ||
| 32(b) |
Certification Pursuant to 18 U.S.C. Section 1350, as Adopted Pursuant to Section 906 of the Sarbanes-Oxley Act of 2002, signed and dated by Laurie Brlas, Executive Vice President, Chief Financial Officer of Cliffs Natural Resources Inc., as of February 18, 2010 | Filed Herewith | ||
| 99(a) |
Schedule II — Valuation and Qualifying Accounts | Filed Herewith | ||
| 101.INS |
XBRL Instance Document | |||
| 101.SCH |
XBRL Taxonomy Extension Schema Document | |||
| 101.CAL |
XBRL Taxonomy Extension Calculation Linkbase Document | |||
| 101.DEF |
XBRL Taxonomy Extension Definition Linkbase Document | |||
| 101.LAB |
XBRL Taxonomy Extension Label Linkbase Document | |||
| 101.PRE |
XBRL Taxonomy Extension Presentation Linkbase Document | |||
171