000076406512/312025Q2falsexbrli:sharesiso4217:USDiso4217:USDxbrli:sharesclf:Employeeiso4217:CADxbrli:sharesxbrli:pureclf:segmentiso4217:CADclf:segmentsclf:MMBtuutr:MWhclf:Tons00007640652025-01-012025-06-3000007640652025-07-2300007640652025-06-3000007640652024-12-3100007640652025-04-012025-06-3000007640652024-04-012024-06-3000007640652024-01-012024-06-3000007640652023-12-3100007640652024-06-300000764065us-gaap:CommonStockMember2024-12-310000764065us-gaap:AdditionalPaidInCapitalMember2024-12-310000764065us-gaap:RetainedEarningsMember2024-12-310000764065us-gaap:TreasuryStockCommonMember2024-12-310000764065us-gaap:AccumulatedOtherComprehensiveIncomeMember2024-12-310000764065us-gaap:NoncontrollingInterestMember2024-12-310000764065us-gaap:RetainedEarningsMember2025-01-012025-03-310000764065us-gaap:AccumulatedOtherComprehensiveIncomeMember2025-01-012025-03-310000764065us-gaap:NoncontrollingInterestMember2025-01-012025-03-3100007640652025-01-012025-03-310000764065us-gaap:CommonStockMember2025-01-012025-03-310000764065us-gaap:AdditionalPaidInCapitalMember2025-01-012025-03-310000764065us-gaap:TreasuryStockCommonMember2025-01-012025-03-310000764065us-gaap:CommonStockMember2025-03-310000764065us-gaap:AdditionalPaidInCapitalMember2025-03-310000764065us-gaap:RetainedEarningsMember2025-03-310000764065us-gaap:TreasuryStockCommonMember2025-03-310000764065us-gaap:AccumulatedOtherComprehensiveIncomeMember2025-03-310000764065us-gaap:NoncontrollingInterestMember2025-03-3100007640652025-03-310000764065us-gaap:RetainedEarningsMember2025-04-012025-06-300000764065us-gaap:AccumulatedOtherComprehensiveIncomeMember2025-04-012025-06-300000764065us-gaap:NoncontrollingInterestMember2025-04-012025-06-300000764065us-gaap:CommonStockMember2025-04-012025-06-300000764065us-gaap:AdditionalPaidInCapitalMember2025-04-012025-06-300000764065us-gaap:TreasuryStockCommonMember2025-04-012025-06-300000764065us-gaap:CommonStockMember2025-06-300000764065us-gaap:AdditionalPaidInCapitalMember2025-06-300000764065us-gaap:RetainedEarningsMember2025-06-300000764065us-gaap:TreasuryStockCommonMember2025-06-300000764065us-gaap:AccumulatedOtherComprehensiveIncomeMember2025-06-300000764065us-gaap:NoncontrollingInterestMember2025-06-300000764065us-gaap:CommonStockMember2023-12-310000764065us-gaap:AdditionalPaidInCapitalMember2023-12-310000764065us-gaap:RetainedEarningsMember2023-12-310000764065us-gaap:TreasuryStockCommonMember2023-12-310000764065us-gaap:AccumulatedOtherComprehensiveIncomeMember2023-12-310000764065us-gaap:NoncontrollingInterestMember2023-12-310000764065us-gaap:RetainedEarningsMember2024-01-012024-03-310000764065us-gaap:AccumulatedOtherComprehensiveIncomeMember2024-01-012024-03-310000764065us-gaap:NoncontrollingInterestMember2024-01-012024-03-3100007640652024-01-012024-03-310000764065us-gaap:CommonStockMember2024-01-012024-03-310000764065us-gaap:TreasuryStockCommonMember2024-01-012024-03-310000764065us-gaap:AdditionalPaidInCapitalMember2024-01-012024-03-310000764065us-gaap:CommonStockMember2024-03-310000764065us-gaap:AdditionalPaidInCapitalMember2024-03-310000764065us-gaap:RetainedEarningsMember2024-03-310000764065us-gaap:TreasuryStockCommonMember2024-03-310000764065us-gaap:AccumulatedOtherComprehensiveIncomeMember2024-03-310000764065us-gaap:NoncontrollingInterestMember2024-03-3100007640652024-03-310000764065us-gaap:RetainedEarningsMember2024-04-012024-06-300000764065us-gaap:AccumulatedOtherComprehensiveIncomeMember2024-04-012024-06-300000764065us-gaap:NoncontrollingInterestMember2024-04-012024-06-300000764065us-gaap:CommonStockMember2024-04-012024-06-300000764065us-gaap:TreasuryStockCommonMember2024-04-012024-06-300000764065us-gaap:AdditionalPaidInCapitalMember2024-04-012024-06-300000764065us-gaap:CommonStockMember2024-06-300000764065us-gaap:AdditionalPaidInCapitalMember2024-06-300000764065us-gaap:RetainedEarningsMember2024-06-300000764065us-gaap:TreasuryStockCommonMember2024-06-300000764065us-gaap:AccumulatedOtherComprehensiveIncomeMember2024-06-300000764065us-gaap:NoncontrollingInterestMember2024-06-300000764065clf:StelcoHoldingsIncMemberclf:StelcoHoldingsIncMember2024-11-010000764065clf:StelcoHoldingsIncMember2024-11-012024-11-010000764065us-gaap:OtherNoncurrentAssetsMember2025-06-300000764065us-gaap:OtherNoncurrentAssetsMember2024-12-310000764065us-gaap:OtherCurrentLiabilitiesMember2025-06-300000764065us-gaap:OtherCurrentLiabilitiesMember2024-12-310000764065us-gaap:AccountsPayableMember2025-06-300000764065us-gaap:AccountsPayableMember2024-12-310000764065us-gaap:EmployeeSeveranceMember2024-12-310000764065us-gaap:OtherRestructuringMember2024-12-310000764065clf:AssetImpairmentsMember2024-12-310000764065us-gaap:EmployeeSeveranceMember2025-01-012025-03-310000764065us-gaap:OtherRestructuringMember2025-01-012025-03-310000764065clf:AssetImpairmentsMember2025-01-012025-03-310000764065us-gaap:EmployeeSeveranceMember2025-03-310000764065us-gaap:OtherRestructuringMember2025-03-310000764065clf:AssetImpairmentsMember2025-03-310000764065us-gaap:EmployeeSeveranceMember2025-04-012025-06-300000764065us-gaap:OtherRestructuringMember2025-04-012025-06-300000764065clf:AssetImpairmentsMember2025-04-012025-06-300000764065us-gaap:EmployeeSeveranceMember2025-06-300000764065us-gaap:OtherRestructuringMember2025-06-300000764065clf:AssetImpairmentsMember2025-06-300000764065us-gaap:OtherPostretirementBenefitPlansDefinedBenefitMemberus-gaap:OtherRestructuringMember2025-04-012025-06-300000764065clf:StelcoHoldingsIncMember2024-11-010000764065clf:StelcoHoldingsIncMember2024-11-022025-06-300000764065clf:StelcoHoldingsIncMember2025-06-300000764065clf:StelcoHoldingsIncMemberus-gaap:CustomerRelationshipsMember2024-11-012024-11-010000764065clf:StelcoHoldingsIncMemberus-gaap:TrademarksAndTradeNamesMember2024-11-012024-11-010000764065clf:StelcoHoldingsIncMember2024-04-012024-06-300000764065clf:StelcoHoldingsIncMember2024-01-012024-06-300000764065clf:AutomotiveMemberclf:SteelmakingMember2025-04-012025-06-300000764065clf:AutomotiveMemberclf:SteelmakingMember2024-04-012024-06-300000764065clf:AutomotiveMemberclf:SteelmakingMember2025-01-012025-06-300000764065clf:AutomotiveMemberclf:SteelmakingMember2024-01-012024-06-300000764065clf:InfrastructureAndManufacturingMemberclf:SteelmakingMember2025-04-012025-06-300000764065clf:InfrastructureAndManufacturingMemberclf:SteelmakingMember2024-04-012024-06-300000764065clf:InfrastructureAndManufacturingMemberclf:SteelmakingMember2025-01-012025-06-300000764065clf:InfrastructureAndManufacturingMemberclf:SteelmakingMember2024-01-012024-06-300000764065clf:DistributorsAndConvertersMemberclf:SteelmakingMember2025-04-012025-06-300000764065clf:DistributorsAndConvertersMemberclf:SteelmakingMember2024-04-012024-06-300000764065clf:DistributorsAndConvertersMemberclf:SteelmakingMember2025-01-012025-06-300000764065clf:DistributorsAndConvertersMemberclf:SteelmakingMember2024-01-012024-06-300000764065clf:SteelProducersMemberclf:SteelmakingMember2025-04-012025-06-300000764065clf:SteelProducersMemberclf:SteelmakingMember2024-04-012024-06-300000764065clf:SteelProducersMemberclf:SteelmakingMember2025-01-012025-06-300000764065clf:SteelProducersMemberclf:SteelmakingMember2024-01-012024-06-300000764065clf:ThirdPartyMemberclf:SteelmakingMember2025-04-012025-06-300000764065clf:ThirdPartyMemberclf:SteelmakingMember2024-04-012024-06-300000764065clf:ThirdPartyMemberclf:SteelmakingMember2025-01-012025-06-300000764065clf:ThirdPartyMemberclf:SteelmakingMember2024-01-012024-06-300000764065clf:AutomotiveMemberclf:OtherBusinessesMember2025-04-012025-06-300000764065clf:AutomotiveMemberclf:OtherBusinessesMember2024-04-012024-06-300000764065clf:AutomotiveMemberclf:OtherBusinessesMember2025-01-012025-06-300000764065clf:AutomotiveMemberclf:OtherBusinessesMember2024-01-012024-06-300000764065clf:InfrastructureAndManufacturingMemberclf:OtherBusinessesMember2025-04-012025-06-300000764065clf:InfrastructureAndManufacturingMemberclf:OtherBusinessesMember2024-04-012024-06-300000764065clf:InfrastructureAndManufacturingMemberclf:OtherBusinessesMember2025-01-012025-06-300000764065clf:InfrastructureAndManufacturingMemberclf:OtherBusinessesMember2024-01-012024-06-300000764065clf:DistributorsAndConvertersMemberclf:OtherBusinessesMember2025-04-012025-06-300000764065clf:DistributorsAndConvertersMemberclf:OtherBusinessesMember2024-04-012024-06-300000764065clf:DistributorsAndConvertersMemberclf:OtherBusinessesMember2025-01-012025-06-300000764065clf:DistributorsAndConvertersMemberclf:OtherBusinessesMember2024-01-012024-06-300000764065clf:OtherBusinessesMember2025-04-012025-06-300000764065clf:OtherBusinessesMember2024-04-012024-06-300000764065clf:OtherBusinessesMember2025-01-012025-06-300000764065clf:OtherBusinessesMember2024-01-012024-06-300000764065clf:HotRolledSteelMemberclf:SteelmakingMember2025-04-012025-06-300000764065clf:HotRolledSteelMemberclf:SteelmakingMember2024-04-012024-06-300000764065clf:HotRolledSteelMemberclf:SteelmakingMember2025-01-012025-06-300000764065clf:HotRolledSteelMemberclf:SteelmakingMember2024-01-012024-06-300000764065clf:ColdRolledSteelMemberclf:SteelmakingMember2025-04-012025-06-300000764065clf:ColdRolledSteelMemberclf:SteelmakingMember2024-04-012024-06-300000764065clf:ColdRolledSteelMemberclf:SteelmakingMember2025-01-012025-06-300000764065clf:ColdRolledSteelMemberclf:SteelmakingMember2024-01-012024-06-300000764065clf:CoatedSteelMemberclf:SteelmakingMember2025-04-012025-06-300000764065clf:CoatedSteelMemberclf:SteelmakingMember2024-04-012024-06-300000764065clf:CoatedSteelMemberclf:SteelmakingMember2025-01-012025-06-300000764065clf:CoatedSteelMemberclf:SteelmakingMember2024-01-012024-06-300000764065clf:StainlessAndElectricalSteelMemberclf:SteelmakingMember2025-04-012025-06-300000764065clf:StainlessAndElectricalSteelMemberclf:SteelmakingMember2024-04-012024-06-300000764065clf:StainlessAndElectricalSteelMemberclf:SteelmakingMember2025-01-012025-06-300000764065clf:StainlessAndElectricalSteelMemberclf:SteelmakingMember2024-01-012024-06-300000764065clf:PlateSteelMemberclf:SteelmakingMember2025-04-012025-06-300000764065clf:PlateSteelMemberclf:SteelmakingMember2024-04-012024-06-300000764065clf:PlateSteelMemberclf:SteelmakingMember2025-01-012025-06-300000764065clf:PlateSteelMemberclf:SteelmakingMember2024-01-012024-06-300000764065clf:SlabAndOtherSteelProductsMemberclf:SteelmakingMember2025-04-012025-06-300000764065clf:SlabAndOtherSteelProductsMemberclf:SteelmakingMember2024-04-012024-06-300000764065clf:SlabAndOtherSteelProductsMemberclf:SteelmakingMember2025-01-012025-06-300000764065clf:SlabAndOtherSteelProductsMemberclf:SteelmakingMember2024-01-012024-06-300000764065clf:OtherMemberclf:SteelmakingMember2025-04-012025-06-300000764065clf:OtherMemberclf:SteelmakingMember2024-04-012024-06-300000764065clf:OtherMemberclf:SteelmakingMember2025-01-012025-06-300000764065clf:OtherMemberclf:SteelmakingMember2024-01-012024-06-300000764065clf:OtherMemberclf:OtherBusinessesMember2025-04-012025-06-300000764065clf:OtherMemberclf:OtherBusinessesMember2024-04-012024-06-300000764065clf:OtherMemberclf:OtherBusinessesMember2025-01-012025-06-300000764065clf:OtherMemberclf:OtherBusinessesMember2024-01-012024-06-300000764065clf:SteelmakingMember2025-04-012025-06-300000764065clf:EliminationsMember2025-04-012025-06-300000764065clf:SteelmakingMember2024-04-012024-06-300000764065clf:EliminationsMember2024-04-012024-06-300000764065clf:SteelmakingMember2025-01-012025-06-300000764065clf:EliminationsMember2025-01-012025-06-300000764065clf:SteelmakingMember2024-01-012024-06-300000764065clf:EliminationsMember2024-01-012024-06-300000764065clf:SteelmakingMember2025-06-300000764065clf:SteelmakingMember2024-12-310000764065clf:OtherBusinessesMember2025-06-300000764065clf:OtherBusinessesMember2024-12-310000764065clf:LandlandimprovementsandmineralrightsMember2025-06-300000764065clf:LandlandimprovementsandmineralrightsMember2024-12-310000764065us-gaap:BuildingMember2025-06-300000764065us-gaap:BuildingMember2024-12-310000764065us-gaap:EquipmentMember2025-06-300000764065us-gaap:EquipmentMember2024-12-310000764065us-gaap:OtherAssetsMember2025-06-300000764065us-gaap:OtherAssetsMember2024-12-310000764065us-gaap:ConstructionInProgressMember2025-06-300000764065us-gaap:ConstructionInProgressMember2024-12-310000764065clf:StelcoHoldingsIncMember2025-01-012025-06-300000764065us-gaap:CustomerRelationshipsMember2025-06-300000764065us-gaap:CustomerRelationshipsMember2024-12-310000764065us-gaap:TechnologyBasedIntangibleAssetsMember2025-06-300000764065us-gaap:TechnologyBasedIntangibleAssetsMember2024-12-310000764065us-gaap:TrademarksAndTradeNamesMember2025-06-300000764065us-gaap:TrademarksAndTradeNamesMember2024-12-310000764065clf:MiningPermitsMember2025-06-300000764065clf:MiningPermitsMember2024-12-310000764065clf:SupplierRelationshipsMember2025-06-300000764065clf:SupplierRelationshipsMember2024-12-310000764065clf:A70002027SeniorNotesMemberclf:ClevelandCliffsInc.Member2025-06-300000764065clf:A70002027SeniorNotesMemberclf:ClevelandCliffsInc.Member2024-12-310000764065clf:A70002027AKSeniorNotesMemberclf:AKSteelMember2025-06-300000764065clf:A70002027AKSeniorNotesMemberclf:AKSteelMember2024-12-310000764065clf:A5.8752027SeniorNotesMemberclf:ClevelandCliffsInc.Member2025-06-300000764065clf:A5.8752027SeniorNotesMemberclf:ClevelandCliffsInc.Member2024-12-310000764065clf:A46252029SeniorNotesMemberclf:ClevelandCliffsInc.Member2025-06-300000764065clf:A46252029SeniorNotesMemberclf:ClevelandCliffsInc.Member2024-12-310000764065clf:A6.8752029SeniorNotesMemberclf:ClevelandCliffsInc.Member2025-06-300000764065clf:A6.8752029SeniorNotesMemberclf:ClevelandCliffsInc.Member2024-12-310000764065clf:A67502030SeniorNotesMemberclf:ClevelandCliffsInc.Member2025-06-300000764065clf:A67502030SeniorNotesMemberclf:ClevelandCliffsInc.Member2024-12-310000764065clf:A48752031SeniorNotesMemberclf:ClevelandCliffsInc.Member2025-06-300000764065clf:A48752031SeniorNotesMemberclf:ClevelandCliffsInc.Member2024-12-310000764065clf:A7.5002031SeniorNotesMemberclf:ClevelandCliffsInc.Member2025-06-300000764065clf:A7.5002031SeniorNotesMemberclf:ClevelandCliffsInc.Member2024-12-310000764065clf:A7.0002032SeniorNotesMemberclf:ClevelandCliffsInc.Member2025-06-300000764065clf:A7.0002032SeniorNotesMemberclf:ClevelandCliffsInc.Member2024-12-310000764065clf:A7.3752033SeniorNotesMemberclf:ClevelandCliffsInc.Member2025-06-300000764065clf:A7.3752033SeniorNotesMemberclf:ClevelandCliffsInc.Member2024-12-310000764065clf:A62502040SeniorNotesMemberclf:ClevelandCliffsInc.Member2025-06-300000764065clf:A62502040SeniorNotesMemberclf:ClevelandCliffsInc.Member2024-12-310000764065us-gaap:RevolvingCreditFacilityMemberclf:ClevelandCliffsInc.Member2025-06-300000764065us-gaap:RevolvingCreditFacilityMemberclf:ClevelandCliffsInc.Member2024-12-310000764065clf:A7.5002031SeniorNotesMemberclf:ClevelandCliffsInc.Member2025-02-060000764065clf:A7.5002031SeniorNotesMemberclf:ClevelandCliffsInc.Membersrt:MinimumMember2025-01-012025-06-300000764065clf:A7.5002031SeniorNotesMemberclf:ClevelandCliffsInc.Membersrt:MaximumMember2025-01-012025-06-300000764065clf:A7.5002031SeniorNotesMemberclf:ClevelandCliffsInc.Memberus-gaap:DebtInstrumentRedemptionPeriodOneMember2025-01-012025-06-300000764065clf:A7.5002031SeniorNotesMemberclf:ClevelandCliffsInc.Memberclf:DebtInstrumentRedemptionPeriodOneUponEquityIssuanceMember2025-01-012025-06-300000764065clf:A7.5002031SeniorNotesMemberclf:ClevelandCliffsInc.Memberus-gaap:DebtInstrumentRedemptionPeriodTwoMember2025-01-012025-06-300000764065clf:A7.5002031SeniorNotesMemberclf:ClevelandCliffsInc.Memberus-gaap:DebtInstrumentRedemptionPeriodThreeMember2025-01-012025-06-300000764065clf:A7.5002031SeniorNotesMemberclf:ClevelandCliffsInc.Member2025-01-012025-06-300000764065us-gaap:RevolvingCreditFacilityMemberus-gaap:LineOfCreditMember2025-01-012025-06-300000764065us-gaap:RevolvingCreditFacilityMember2025-06-300000764065us-gaap:LetterOfCreditMember2025-06-300000764065us-gaap:PensionPlansDefinedBenefitMember2025-04-012025-06-300000764065us-gaap:PensionPlansDefinedBenefitMember2024-04-012024-06-300000764065us-gaap:PensionPlansDefinedBenefitMember2025-01-012025-06-300000764065us-gaap:PensionPlansDefinedBenefitMember2024-01-012024-06-300000764065us-gaap:OtherPostretirementBenefitPlansDefinedBenefitMember2025-04-012025-06-300000764065us-gaap:OtherPostretirementBenefitPlansDefinedBenefitMember2024-04-012024-06-300000764065us-gaap:OtherPostretirementBenefitPlansDefinedBenefitMember2025-01-012025-06-300000764065us-gaap:OtherPostretirementBenefitPlansDefinedBenefitMember2024-01-012024-06-300000764065us-gaap:OperatingSegmentsMember2025-06-300000764065us-gaap:OperatingSegmentsMember2024-12-310000764065us-gaap:FairValueInputsLevel1Memberus-gaap:CarryingReportedAmountFairValueDisclosureMemberus-gaap:SeniorNotesMember2025-06-300000764065us-gaap:FairValueInputsLevel1Memberus-gaap:EstimateOfFairValueFairValueDisclosureMemberus-gaap:SeniorNotesMember2025-06-300000764065us-gaap:FairValueInputsLevel1Memberus-gaap:CarryingReportedAmountFairValueDisclosureMemberus-gaap:SeniorNotesMember2024-12-310000764065us-gaap:FairValueInputsLevel1Memberus-gaap:EstimateOfFairValueFairValueDisclosureMemberus-gaap:SeniorNotesMember2024-12-310000764065us-gaap:FairValueInputsLevel2Memberus-gaap:RevolvingCreditFacilityMemberus-gaap:CarryingReportedAmountFairValueDisclosureMemberus-gaap:LineOfCreditMember2025-06-300000764065us-gaap:FairValueInputsLevel2Memberus-gaap:RevolvingCreditFacilityMemberus-gaap:EstimateOfFairValueFairValueDisclosureMemberus-gaap:LineOfCreditMember2025-06-300000764065us-gaap:FairValueInputsLevel2Memberus-gaap:RevolvingCreditFacilityMemberus-gaap:CarryingReportedAmountFairValueDisclosureMemberus-gaap:LineOfCreditMember2024-12-310000764065us-gaap:FairValueInputsLevel2Memberus-gaap:RevolvingCreditFacilityMemberus-gaap:EstimateOfFairValueFairValueDisclosureMemberus-gaap:LineOfCreditMember2024-12-310000764065us-gaap:CarryingReportedAmountFairValueDisclosureMember2025-06-300000764065us-gaap:EstimateOfFairValueFairValueDisclosureMember2025-06-300000764065us-gaap:CarryingReportedAmountFairValueDisclosureMember2024-12-310000764065us-gaap:EstimateOfFairValueFairValueDisclosureMember2024-12-310000764065us-gaap:CommitmentsMember2024-12-310000764065us-gaap:CommitmentsMember2025-01-012025-06-300000764065us-gaap:CommitmentsMember2025-06-300000764065us-gaap:CommodityOptionMember2025-06-300000764065us-gaap:CommodityOptionMember2024-12-310000764065us-gaap:CommodityOptionMember2025-01-012025-06-300000764065srt:NaturalGasPerThousandCubicFeetMemberus-gaap:CommodityContractMember2025-06-300000764065srt:NaturalGasPerThousandCubicFeetMemberus-gaap:CommodityContractMember2024-12-310000764065us-gaap:ElectricityMemberus-gaap:CommodityContractMember2025-06-300000764065us-gaap:ElectricityMemberus-gaap:CommodityContractMember2024-12-310000764065clf:HRCMemberus-gaap:CommodityContractMember2025-06-300000764065clf:HRCMemberus-gaap:CommodityContractMember2024-12-310000764065us-gaap:CostOfSalesMember2025-01-012025-06-300000764065us-gaap:SalesMember2025-01-012025-06-300000764065us-gaap:OtherCurrentAssetsMember2025-06-300000764065us-gaap:OtherCurrentAssetsMember2024-12-310000764065us-gaap:OtherNoncurrentLiabilitiesMember2025-06-300000764065us-gaap:OtherNoncurrentLiabilitiesMember2024-12-3100007640652022-02-1000007640652024-04-220000764065us-gaap:CommonStockMember2025-01-012025-06-300000764065us-gaap:CommonStockMember2024-01-012024-06-300000764065us-gaap:TreasuryStockCommonMember2024-01-012024-06-300000764065us-gaap:SeriesAPreferredStockMember2025-06-300000764065us-gaap:SeriesBPreferredStockMember2025-06-300000764065us-gaap:AccumulatedTranslationAdjustmentMember2025-03-310000764065us-gaap:AccumulatedTranslationAdjustmentMember2024-03-310000764065us-gaap:AccumulatedTranslationAdjustmentMember2024-12-310000764065us-gaap:AccumulatedTranslationAdjustmentMember2023-12-310000764065us-gaap:AccumulatedTranslationAdjustmentMember2025-04-012025-06-300000764065us-gaap:AccumulatedTranslationAdjustmentMember2024-04-012024-06-300000764065us-gaap:AccumulatedTranslationAdjustmentMember2025-01-012025-06-300000764065us-gaap:AccumulatedTranslationAdjustmentMember2024-01-012024-06-300000764065us-gaap:AccumulatedTranslationAdjustmentMember2025-06-300000764065us-gaap:AccumulatedTranslationAdjustmentMember2024-06-300000764065us-gaap:AccumulatedGainLossNetCashFlowHedgeParentMember2025-03-310000764065us-gaap:AccumulatedGainLossNetCashFlowHedgeParentMember2024-03-310000764065us-gaap:AccumulatedGainLossNetCashFlowHedgeParentMember2024-12-310000764065us-gaap:AccumulatedGainLossNetCashFlowHedgeParentMember2023-12-310000764065us-gaap:AccumulatedGainLossNetCashFlowHedgeParentMember2025-04-012025-06-300000764065us-gaap:AccumulatedGainLossNetCashFlowHedgeParentMember2024-04-012024-06-300000764065us-gaap:AccumulatedGainLossNetCashFlowHedgeParentMember2025-01-012025-06-300000764065us-gaap:AccumulatedGainLossNetCashFlowHedgeParentMember2024-01-012024-06-300000764065us-gaap:AccumulatedGainLossNetCashFlowHedgeParentMember2025-06-300000764065us-gaap:AccumulatedGainLossNetCashFlowHedgeParentMember2024-06-300000764065us-gaap:AccumulatedDefinedBenefitPlansAdjustmentMember2025-03-310000764065us-gaap:AccumulatedDefinedBenefitPlansAdjustmentMember2024-03-310000764065us-gaap:AccumulatedDefinedBenefitPlansAdjustmentMember2024-12-310000764065us-gaap:AccumulatedDefinedBenefitPlansAdjustmentMember2023-12-310000764065us-gaap:AccumulatedDefinedBenefitPlansAdjustmentMember2025-04-012025-06-300000764065us-gaap:AccumulatedDefinedBenefitPlansAdjustmentMember2024-04-012024-06-300000764065us-gaap:AccumulatedDefinedBenefitPlansAdjustmentMember2025-01-012025-06-300000764065us-gaap:AccumulatedDefinedBenefitPlansAdjustmentMember2024-01-012024-06-300000764065us-gaap:AccumulatedDefinedBenefitPlansAdjustmentMember2025-06-300000764065us-gaap:AccumulatedDefinedBenefitPlansAdjustmentMember2024-06-300000764065clf:SunCokeMiddletownMemberus-gaap:VariableInterestEntityPrimaryBeneficiaryMember2025-04-012025-06-300000764065clf:SunCokeMiddletownMemberus-gaap:VariableInterestEntityPrimaryBeneficiaryMember2025-01-012025-06-300000764065clf:SunCokeMiddletownMemberus-gaap:VariableInterestEntityPrimaryBeneficiaryMember2024-04-012024-06-300000764065clf:SunCokeMiddletownMemberus-gaap:VariableInterestEntityPrimaryBeneficiaryMember2024-01-012024-06-300000764065clf:SunCokeMiddletownMemberus-gaap:VariableInterestEntityPrimaryBeneficiaryMember2025-06-300000764065clf:SunCokeMiddletownMemberus-gaap:VariableInterestEntityPrimaryBeneficiaryMember2024-12-310000764065us-gaap:StockCompensationPlanMember2025-04-012025-06-300000764065us-gaap:StockCompensationPlanMember2025-01-012025-06-300000764065us-gaap:StockCompensationPlanMember2024-01-012024-06-300000764065us-gaap:StockCompensationPlanMember2024-04-012024-06-300000764065us-gaap:SuretyBondMember2025-06-30
UNITED STATES
SECURITIES AND EXCHANGE COMMISSION
Washington, D.C. 20549
FORM 10-Q
| | | | | | | | | | | |
| ☒ | QUARTERLY REPORT PURSUANT TO SECTION 13 OR 15(d) OF THE SECURITIES EXCHANGE ACT OF 1934 | |
For the quarterly period ended June 30, 2025
OR
| | | | | | | | | | | |
| ☐ | TRANSITION REPORT PURSUANT TO SECTION 13 OR 15(d) OF THE SECURITIES EXCHANGE ACT OF 1934 | |
For the transition period from to .
Commission File Number: 1-8944
CLEVELAND-CLIFFS INC.
(Exact Name of Registrant as Specified in Its Charter)
| | | | | | | | | | | | | | | | | | | | |
| Ohio | | 34-1464672 | |
| (State or Other Jurisdiction of
Incorporation or Organization) | | (I.R.S. Employer
Identification No.) | |
| | | | |
| 200 Public Square, | Cleveland, | Ohio | | 44114-2315 | |
| (Address of Principal Executive Offices) | | (Zip Code) | |
Registrant’s telephone number, including area code: (216) 694-5700
Securities registered pursuant to Section 12(b) of the Act:
| | | | | | | | | | | | | | |
| Title of each class | | Trading Symbol(s) | | Name of each exchange on which registered |
| Common shares, par value $0.125 per share | | CLF | | New York Stock Exchange |
Indicate by check mark whether the registrant (1) has filed all reports required to be filed by Section 13 or 15(d) of the Securities Exchange Act of 1934 during the preceding 12 months (or for such shorter period that the registrant was required to file such reports), and (2) has been subject to such filing requirements for the past 90 days.
Yes ☒ No ☐
Indicate by check mark whether the registrant has submitted electronically every Interactive Data File required to be submitted pursuant to Rule 405 of Regulation S-T (§232.405 of this chapter) during the preceding 12 months (or for such shorter period that the registrant was required to submit such files).
Yes ☒ No ☐
Indicate by check mark whether the registrant is a large accelerated filer, an accelerated filer, a non-accelerated filer, a smaller reporting company, or an emerging growth company. See the definitions of “large accelerated filer,” “accelerated filer,” “smaller reporting company,” and "emerging growth company" in Rule 12b-2 of the Exchange Act.
| | | | | | | | | | | |
| Large accelerated filer | ☒ | Accelerated filer | ☐ |
| Non-accelerated filer | ☐ | Smaller reporting company | ☐ |
| | Emerging growth company | ☐ |
If an emerging growth company, indicate by check mark if the registrant has elected not to use the extended transition period for complying with any new or revised financial accounting standards provided pursuant to Section 13(a) of the Exchange Act. ☐
Indicate by check mark whether the registrant is a shell company (as defined in Rule 12b-2 of the Exchange Act).
Yes ☐ No ☒
The number of shares outstanding of the registrant’s common shares, par value $0.125 per share, was 494,695,276 as of July 23, 2025.
TABLE OF CONTENTS | | | | | | | | | | | | | | | | | |
| | | Page Number |
| | | | | |
| DEFINITIONS | | | |
| | | |
| PART I - FINANCIAL INFORMATION | | | |
| ITEM 1. | FINANCIAL STATEMENTS AND SUPPLEMENTARY DATA | | | |
| | STATEMENTS OF UNAUDITED CONDENSED CONSOLIDATED FINANCIAL POSITION AS OF JUNE 30, 2025 AND DECEMBER 31, 2024 | | | |
| | STATEMENTS OF UNAUDITED CONDENSED CONSOLIDATED OPERATIONS FOR THE THREE AND SIX MONTHS ENDED JUNE 30, 2025 AND 2024 | | | |
| | STATEMENTS OF UNAUDITED CONDENSED CONSOLIDATED COMPREHENSIVE INCOME (LOSS) FOR THE THREE AND SIX MONTHS ENDED JUNE 30, 2025 AND 2024 | | | |
| | STATEMENTS OF UNAUDITED CONDENSED CONSOLIDATED CASH FLOWS FOR THE SIX MONTHS ENDED JUNE 30, 2025 AND 2024 | | | |
| | STATEMENTS OF UNAUDITED CONDENSED CONSOLIDATED CHANGES IN EQUITY FOR THE SIX MONTHS ENDED JUNE 30, 2025 AND 2024 | | | |
| | NOTES TO UNAUDITED CONDENSED CONSOLIDATED FINANCIAL STATEMENTS | | | |
| ITEM 2. | MANAGEMENT'S DISCUSSION AND ANALYSIS OF FINANCIAL CONDITION AND RESULTS OF OPERATIONS | | | |
| ITEM 3. | QUANTITATIVE AND QUALITATIVE DISCLOSURES ABOUT MARKET RISK | | | |
| ITEM 4. | CONTROLS AND PROCEDURES | | | |
| | | |
| PART II - OTHER INFORMATION | | | |
| ITEM 1. | LEGAL PROCEEDINGS | | | |
| ITEM 1A. | RISK FACTORS | | | |
| ITEM 2. | UNREGISTERED SALES OF EQUITY SECURITIES AND USE OF PROCEEDS | | | |
| ITEM 4. | MINE SAFETY DISCLOSURES | | | |
| ITEM 5. | OTHER INFORMATION | | | |
| ITEM 6. | EXHIBITS | | | |
| | | | | |
| SIGNATURES | | | |
| | | |
DEFINITIONS
The following abbreviations or acronyms are used in the text. References in this report to the “Company,” “we,” “us,” “our,” "Cleveland-Cliffs" and “Cliffs” are to Cleveland-Cliffs Inc. and subsidiaries, collectively. References to “$” is to United States currency, unless otherwise stated.
| | | | | | | | |
| Abbreviation or acronym | | Term |
| ABL Facility | | Asset-Based Revolving Credit Agreement, dated as of March 13, 2020, which matures the earlier of June 9, 2028, or 91 days prior to the maturity of certain other material debt, among Cleveland-Cliffs Inc., the lenders party thereto from time to time and Bank of America, N.A., as administrative agent, as amended as of March 27, 2020, December 9, 2020, December 17, 2021, June 9, 2023, July 31, 2024, and September 13, 2024, and as may be further amended from time to time |
| Adjusted EBITDA | | EBITDA, excluding certain items such as EBITDA from noncontrolling interests, idled facilities charges, changes in fair value of derivatives, net, currency exchange, loss on extinguishment of debt, severance, and other, net. |
| AOCI | | Accumulated other comprehensive income (loss) |
| Arrangement Agreement | | Arrangement Agreement, by and between Stelco Holdings Inc., 13421422 Canada Inc. and Cleveland-Cliffs Inc., dated July 14, 2024, in respect of the Stelco Acquisition |
| ASU | | Accounting Standards Update |
| BOF | | Basic oxygen furnace |
| CERCLA | | Comprehensive Environmental Response, Compensation and Liability Act of 1980 |
| CODM | | Chief Operating Decision Maker |
CO2e | | Carbon dioxide equivalent |
| Dodd-Frank Act | | Dodd-Frank Wall Street Reform and Consumer Protection Act |
| EAF | | Electric arc furnace |
| EBITDA | | Earnings before interest, taxes, depreciation and amortization |
| EPA | | U.S. Environmental Protection Agency |
| EPS | | Earnings per share |
| Exchange Act | | Securities Exchange Act of 1934, as amended |
| FASB | | Financial Accounting Standards Board |
| GAAP | | Accounting principles generally accepted in the United States |
| GHG | | Greenhouse gas |
| GOES | | Grain oriented electrical steel |
| HBI | | Hot briquetted iron |
| HRC | | Hot-rolled coil steel |
| IAM | | International Association of Machinists and Aerospace Workers |
| Long ton (lt) | | 2,240 pounds |
| Metric ton (mt) | | 2,205 pounds |
| MMBtu | | Million British Thermal Units |
| Net ton (nt) | | 2,000 pounds |
| NOES | | Non-oriented electrical steel |
| OPEB | | Other postretirement benefits |
| RCRA | | Resource Conservation and Recovery Act |
| SEC | | U.S. Securities and Exchange Commission |
| Section 232 | | Section 232 of the Trade Expansion Act of 1962 (as amended by the Trade Act of 1974) |
| Securities Act | | Securities Act of 1933, as amended |
| Stelco | | Stelco Holdings Inc., a Canadian corporation, and its consolidated subsidiaries, collectively, unless stated otherwise or the context indicates otherwise, which continues as Stelco Inc. following the amalgamation of Stelco Holdings Inc., Stelco Inc. and 13421422 Canada Inc. effective November 8, 2024 |
| Stelco Acquisition | | The acquisition of all of the outstanding common shares of Stelco Holdings Inc. by the Company, as provided for in the Arrangement Agreement |
| SunCoke Middletown | | Middletown Coke Company, LLC, a subsidiary of SunCoke Energy, Inc. |
| UAW | | United Auto Workers |
| USW | | United Steelworkers |
| VIE | | Variable interest entity |
PART I
| | |
|
| ITEM 1. FINANCIAL STATEMENTS AND SUPPLEMENTARY DATA |
STATEMENTS OF UNAUDITED CONDENSED CONSOLIDATED FINANCIAL POSITION
CLEVELAND-CLIFFS INC. AND SUBSIDIARIES
| | | | | | | | | | | |
| (In millions, except share information) | June 30,
2025 | | December 31,
2024 |
| ASSETS | | | |
| Current assets: | | | |
| Cash and cash equivalents | $ | 61 | | | $ | 54 | |
| Accounts receivable, net | 1,783 | | | 1,576 | |
| Inventories | 4,699 | | | 5,094 | |
| Other current assets | 144 | | | 183 | |
| Total current assets | 6,687 | | | 6,907 | |
| Non-current assets: | | | |
| Property, plant and equipment, net | 9,620 | | | 9,942 | |
| Goodwill | 1,814 | | | 1,768 | |
| Intangible assets | 1,185 | | | 1,170 | |
| Pension and OPEB assets | 453 | | | 427 | |
| Other non-current assets | 712 | | | 733 | |
| TOTAL ASSETS | $ | 20,471 | | | $ | 20,947 | |
| LIABILITIES AND EQUITY | | | |
| Current liabilities: | | | |
| Accounts payable | $ | 1,947 | | | $ | 2,008 | |
| Accrued employment costs | 521 | | | 447 | |
| Accrued expenses | 348 | | | 375 | |
| Other current liabilities | 461 | | | 492 | |
| Total current liabilities | 3,277 | | | 3,322 | |
| Non-current liabilities: | | | |
| Long-term debt | 7,727 | | | 7,065 | |
| Pension and OPEB liabilities | 693 | | | 751 | |
| Deferred income taxes | 612 | | | 858 | |
| Asset retirement and environmental obligations | 613 | | | 601 | |
| Other non-current liabilities | 1,507 | | | 1,453 | |
| TOTAL LIABILITIES | 14,429 | | | 14,050 | |
| Commitments and contingencies (See Note 18) | | | |
| Equity: | | | |
Common shares - par value $0.125 per share | | | |
Authorized - 1,200,000,000 shares (2024 - 1,200,000,000 shares); | | | |
Issued - 531,051,530 shares (2024 - 531,051,530 shares); | | | |
Outstanding - 494,679,326 shares (2024 - 493,948,905 shares) | 66 | | | 66 | |
| Capital in excess of par value of shares | 4,768 | | | 4,758 | |
| Retained earnings | 1 | | | 979 | |
Cost of 36,372,204 common shares in treasury (2024 - 37,102,625 shares) | (660) | | | (676) | |
| Accumulated other comprehensive income | 1,644 | | | 1,537 | |
| Total Cliffs shareholders' equity | 5,819 | | | 6,664 | |
| Noncontrolling interests | 223 | | | 233 | |
| TOTAL EQUITY | 6,042 | | | 6,897 | |
| TOTAL LIABILITIES AND EQUITY | $ | 20,471 | | | $ | 20,947 | |
The accompanying notes are an integral part of these unaudited condensed consolidated financial statements.
STATEMENTS OF UNAUDITED CONDENSED CONSOLIDATED OPERATIONS
CLEVELAND-CLIFFS INC. AND SUBSIDIARIES
| | | | | | | | | | | | | | | | | | | | | | | |
| Three Months Ended
June 30, | | Six Months Ended
June 30, |
| (In millions, except per share amounts) | 2025 | | 2024 | | 2025 | | 2024 |
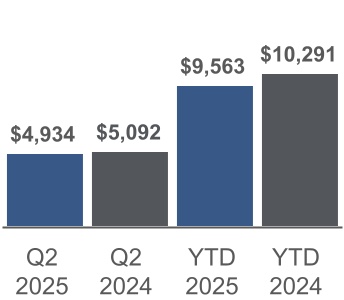
| Revenues | $ | 4,934 | | | $ | 5,092 | | | $ | 9,563 | | | $ | 10,291 | |
| Operating costs: | | | | | | | |
| Cost of goods sold | (5,143) | | | (4,930) | | | (10,163) | | | (9,844) | |
| Selling, general and administrative expenses | (137) | | | (103) | | | (270) | | | (235) | |
| Restructuring and other charges | (86) | | | (25) | | | (89) | | | (129) | |
| Asset impairment | (39) | | | (15) | | | (39) | | | (79) | |
| Miscellaneous – net | (27) | | | (13) | | | (38) | | | (36) | |
| Total operating costs | (5,432) | | | (5,086) | | | (10,599) | | | (10,323) | |
| Operating income (loss) | (498) | | | 6 | | | (1,036) | | | (32) | |
| Other income (expense): | | | | | | | |
| Interest expense, net | (149) | | | (69) | | | (289) | | | (133) | |
| Loss on extinguishment of debt | — | | | (6) | | | — | | | (27) | |
| Net periodic benefit credits other than service cost component | 43 | | | 62 | | | 100 | | | 122 | |
| Other non-operating income (expense) | (14) | | | 1 | | | (23) | | | 3 | |
| Total other expense | (120) | | | (12) | | | (212) | | | (35) | |
| Loss before income taxes | (618) | | | (6) | | | (1,248) | | | (67) | |
| Income tax benefit | 148 | | | 15 | | | 295 | | | 23 | |
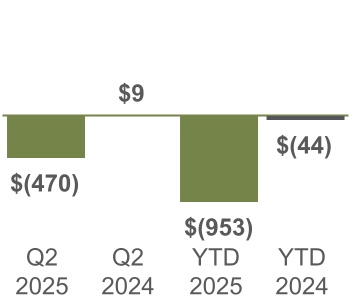
| Net income (loss) | (470) | | | 9 | | | (953) | | | (44) | |
| Net income attributable to noncontrolling interests | (13) | | | (7) | | | (25) | | | (21) | |
| Net income (loss) attributable to Cliffs shareholders | $ | (483) | | | $ | 2 | | | $ | (978) | | | $ | (65) | |
| | | | | | | |
| Earnings (loss) per common share attributable to Cliffs shareholders: | | | | | | | |
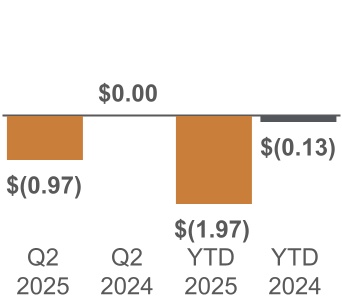
| Basic | $ | (0.97) | | | $ | 0.00 | | | $ | (1.97) | | | $ | (0.13) | |
| Diluted | $ | (0.97) | | | $ | 0.00 | | | $ | (1.97) | | | $ | (0.13) | |
The accompanying notes are an integral part of these unaudited condensed consolidated financial statements.
STATEMENTS OF UNAUDITED CONDENSED CONSOLIDATED COMPREHENSIVE INCOME (LOSS)
CLEVELAND-CLIFFS INC. AND SUBSIDIARIES
| | | | | | | | | | | | | | | | | | | | | | | |
| Three Months Ended
June 30, | | Six Months Ended
June 30, |
| (In millions) | 2025 | | 2024 | | 2025 | | 2024 |
| Net income (loss) | $ | (470) | | | $ | 9 | | | $ | (953) | | | $ | (44) | |
| Other comprehensive income (loss): | | | | | | | |
| Changes in pension and OPEB, net of tax | (25) | | | (29) | | | (52) | | | (57) | |
| Changes in derivative financial instruments, net of tax | (45) | | | 47 | | | 56 | | | 67 | |
| Changes in foreign currency translation, net of tax | 102 | | | — | | | 103 | | | (1) | |
| Total other comprehensive income | 32 | | | 18 | | | 107 | | | 9 | |
| Comprehensive income (loss) | (438) | | | 27 | | | (846) | | | (35) | |
| Comprehensive income attributable to noncontrolling interests | (13) | | | (7) | | | (25) | | | (21) | |
| Comprehensive income (loss) attributable to Cliffs shareholders | $ | (451) | | | $ | 20 | | | $ | (871) | | | $ | (56) | |
The accompanying notes are an integral part of these unaudited condensed consolidated financial statements.
STATEMENTS OF UNAUDITED CONDENSED CONSOLIDATED CASH FLOWS
CLEVELAND-CLIFFS INC. AND SUBSIDIARIES
| | | | | | | | | | | |
| Six Months Ended
June 30, |
| (In millions) | 2025 | | 2024 |
| OPERATING ACTIVITIES | | | |
| Net loss | $ | (953) | | | $ | (44) | |
| Adjustments to reconcile net loss to net cash provided (used) by operating activities: | | | |
| Depreciation, depletion and amortization | 675 | | | 458 | |
| Pension and OPEB credits | (82) | | | (104) | |
| Deferred income taxes | (301) | | | (21) | |
| Restructuring and other charges | 89 | | | 129 | |
| Asset impairments | 39 | | | 79 | |
| Other | 63 | | | 95 | |
| Changes in operating assets and liabilities: | | | |
| Accounts receivable, net | (199) | | | 67 | |
| Inventories | 396 | | | 227 | |
| Income taxes | 10 | | | (12) | |
| Pension and OPEB payments and contributions | (73) | | | (62) | |
| Payables, accrued employment and accrued expenses | (3) | | | (176) | |
| Other, net | 33 | | | 25 | |
| Net cash provided (used) by operating activities | (306) | | | 661 | |
| INVESTING ACTIVITIES | | | |
| Purchase of property, plant and equipment | (264) | | | (339) | |
| Other investing activities | 8 | | | 8 | |
| Net cash used by investing activities | (256) | | | (331) | |
| FINANCING ACTIVITIES | | | |
| Proceeds from issuance of senior notes | 850 | | | 825 | |
| Repayments of senior notes | — | | | (845) | |
| Repurchase of common shares | — | | | (733) | |
| Borrowings (repayments) under credit facilities, net | (183) | | | 370 | |
| Debt issuance costs | (14) | | | (13) | |
| Other financing activities | (86) | | | (22) | |
| Net cash provided (used) by financing activities | 567 | | | (418) | |
| Net increase (decrease) in cash and cash equivalents | 5 | | | (88) | |
| | | |
| Cash, cash equivalents, and restricted cash at beginning of period | 60 | | | 198 | |
| Effect of exchange rate changes on cash | 3 | | | — | |
| Cash, cash equivalents, and restricted cash at end of period | 68 | | | 110 | |
| | | |
| Restricted cash | (7) | | | — | |
| | | |
| Cash and cash equivalents at end of period | $ | 61 | | | $ | 110 | |
The accompanying notes are an integral part of these unaudited condensed consolidated financial statements.
STATEMENTS OF UNAUDITED CONDENSED CONSOLIDATED CHANGES IN EQUITY
CLEVELAND-CLIFFS INC. AND SUBSIDIARIES
| | | | | | | | | | | | | | | | | | | | | | | | | | | | | | | | | | | | | | | | | | | | | | | |
| (In millions) | Number of
Common Shares Outstanding | | Par Value of Common
Shares Issued | | Capital in
Excess of
Par Value
of Shares | | Retained
Earnings | | Common
Shares
in
Treasury | | AOCI | | Non-Controlling Interest | | Total |
| December 31, 2024 | 493.9 | | | $ | 66 | | | $ | 4,758 | | | $ | 979 | | | $ | (676) | | | $ | 1,537 | | | $ | 233 | | | $ | 6,897 | |
| Comprehensive income (loss) | — | | | — | | | — | | | (495) | | | — | | | 75 | | | 12 | | | (408) | |
| Stock and other incentive plans | 0.6 | | | — | | | (2) | | | — | | | 12 | | | — | | | — | | | 10 | |
| Net distributions to noncontrolling interests | — | | | — | | | — | | | — | | | — | | | — | | | (15) | | | (15) | |
| March 31, 2025 | 494.5 | | | $ | 66 | | | $ | 4,756 | | | $ | 484 | | | $ | (664) | | | $ | 1,612 | | | $ | 230 | | | $ | 6,484 | |
| Comprehensive income (loss) | — | | | — | | | — | | | (483) | | | — | | | 32 | | | 13 | | | (438) | |
| Stock and other incentive plans | 0.2 | | | — | | | 12 | | | — | | | 4 | | | — | | | — | | | 16 | |
| Net distributions to noncontrolling interests | — | | | — | | | — | | | — | | | — | | | — | | | (20) | | | (20) | |
| June 30, 2025 | 494.7 | | | $ | 66 | | | $ | 4,768 | | | $ | 1 | | | $ | (660) | | | $ | 1,644 | | | $ | 223 | | | $ | 6,042 | |
| | | | | | | | | | | | | | | |
| | | | | | | | | | | | | | | |
| | | | | | | | | | | | | | | |
| | | | | | | | | | | | | | | |
| | | | | | | | | | | | | | | | | | | | | | | | | | | | | | | | | | | | | | | | | | | | | | | |
| (In millions) | Number of
Common Shares Outstanding | | Par Value of Common
Shares Issued | | Capital in
Excess of
Par Value
of Shares | | Retained
Earnings | | Common
Shares
in
Treasury | | AOCI | | Non-Controlling Interest | | Total |
| December 31, 2023 | 504.9 | | | $ | 66 | | | $ | 4,861 | | | $ | 1,733 | | | $ | (430) | | | $ | 1,657 | | | $ | 235 | | | $ | 8,122 | |
| Comprehensive income (loss) | — | | | — | | | — | | | (67) | | | — | | | (9) | | | 14 | | | (62) | |
| Common stock repurchases, net of excise tax | (30.4) | | | — | | | — | | | — | | | (615) | | | — | | | — | | | (615) | |
| Stock and other incentive plans | 1.0 | | | — | | | (10) | | | — | | | 15 | | | — | | | — | | | 5 | |
| Net distributions to noncontrolling interests | — | | | — | | | — | | | — | | | — | | | — | | | (8) | | | (8) | |
| March 31, 2024 | 475.5 | | | $ | 66 | | | $ | 4,851 | | | $ | 1,666 | | | $ | (1,030) | | | $ | 1,648 | | | $ | 241 | | | $ | 7,442 | |
| Comprehensive income | — | | | — | | | — | | | 2 | | | — | | | 18 | | | 7 | | | 27 | |
| Common stock repurchases, net of excise tax | (7.5) | | | — | | | — | | | — | | | (125) | | | — | | | — | | | (125) | |
| Stock and other incentive plans | — | | | — | | | 13 | | | — | | | 1 | | | — | | | — | | | 14 | |
| Net contributions to noncontrolling interests | — | | | — | | | — | | | — | | | — | | | — | | | 14 | | | 14 | |
| June 30, 2024 | 468.0 | | | $ | 66 | | | $ | 4,864 | | | $ | 1,668 | | | $ | (1,154) | | | $ | 1,666 | | | $ | 262 | | | $ | 7,372 | |
| | | | | | | | | | | | | | | |
| | | | | | | | | | | | | | | |
| | | | | | | | | | | | | | | |
| | | | | | | | | | | | | | | |
| | | | | | | | | | | | | | | |
The accompanying notes are an integral part of these unaudited condensed consolidated financial statements.
NOTES TO CONSOLIDATED FINANCIAL STATEMENTS
CLEVELAND-CLIFFS INC. AND SUBSIDIARIES
NOTE 1 - BASIS OF PRESENTATION AND SIGNIFICANT ACCOUNTING POLICIES
BUSINESS, CONSOLIDATION AND PRESENTATION
The accompanying unaudited condensed consolidated financial statements have been prepared in accordance with SEC rules and regulations and, in the opinion of management, include all adjustments (consisting of normal recurring adjustments) necessary to present fairly the financial position, results of operations, comprehensive income (loss), cash flows and changes in equity for the periods presented. The preparation of financial statements in conformity with GAAP requires management to make estimates and assumptions that affect the amounts reported in the financial statements and accompanying notes. Management bases its estimates on various assumptions and historical experience, which are believed to be reasonable; however, due to the inherent nature of estimates, actual results may differ significantly due to changed conditions or assumptions. The results of operations for the three and six months ended June 30, 2025 are not necessarily indicative of results to be expected for the year ending December 31, 2025 or any other future period. Certain prior period amounts have been reclassified to conform with the current year presentation. These unaudited condensed consolidated financial statements should be read in conjunction with the financial statements and notes included in our Annual Report on Form 10-K for the year ended December 31, 2024.
NATURE OF BUSINESS
We are a leading North America-based steel producer with focus on value-added sheet products, particularly for the automotive industry. We are vertically integrated from the mining of iron ore, production of pellets and direct reduced iron, and processing of ferrous scrap through primary steelmaking and downstream finishing, stamping, tooling and tubing. Headquartered in Cleveland, Ohio, we employ approximately 30,000 people across our operations in the United States and Canada. More than 90% of our hourly workforce is represented by three prominent unions – USW, UAW and IAM.
ACQUISITION OF STELCO
On November 1, 2024, pursuant to the terms of the Arrangement Agreement announced on July 15, 2024, we completed the Stelco Acquisition. In connection with closing, Stelco shareholders received CAD $60.00 in cash and 0.454 shares of Cliffs common stock per share of Stelco common stock. Refer to NOTE 3 - ACQUISITIONS for further information.
BUSINESS OPERATIONS
We are organized into four operating segments based on differentiated products – Steelmaking, Tubular, Tooling and Stamping, and European Operations. We primarily operate through one reportable segment – the Steelmaking segment.
BASIS OF CONSOLIDATION
The consolidated financial statements consolidate our accounts and the accounts of our wholly owned subsidiaries, all subsidiaries in which we have a controlling interest and VIEs for which we are the primary beneficiary. All intercompany transactions and balances are eliminated upon consolidation.
INVESTMENTS IN AFFILIATES
We have investments in several businesses accounted for using the equity method of accounting. These investments are included within our Steelmaking segment. We review an investment for impairment when circumstances indicate that a loss in value below its carrying amount is other than temporary.
Our investment in affiliates of $132 million and $131 million as of June 30, 2025 and December 31, 2024, respectively, was classified in Other non-current assets.
SIGNIFICANT ACCOUNTING POLICIES
A detailed description of our significant accounting policies can be found in the audited financial statements included in our Annual Report on Form 10-K for the year ended December 31, 2024 filed with the SEC. There have been no material changes in our significant accounting policies and estimates from those disclosed therein.
RECENT ACCOUNTING PRONOUNCEMENTS AND LEGISLATION
ACCOUNTING PRONOUNCEMENTS - ISSUED AND NOT EFFECTIVE
In December 2023, the FASB issued ASU No. 2023-09, Income Taxes (Topic 740): Improvements to Income Tax Disclosures. This guidance requires additional annual disclosures for income taxes. This new standard does not affect the recognition, measurement or financial statement presentation. The amendments are effective for annual reporting periods beginning after December 15, 2024.
In November 2024, the FASB issued ASU No. 2024-03, Income Statement—Reporting Comprehensive Income (Subtopic 220-40): Disaggregation of Income Statement Expenses. This new standard does not affect the recognition, measurement or financial statement presentation. However, this guidance does require additional annual and interim disclosures related to the
disaggregation of various income statement expense captions. The amendments are effective for annual reporting periods beginning after December 15, 2026, and interim reporting periods beginning after December 15, 2027.
LEGISLATION
On July 4, 2025, the One Big Beautiful Bill Act was enacted in the U.S. The One Big Beautiful Bill Act includes significant provisions, such as the permanent extension of certain expiring provisions of the Tax Cuts and Jobs Act, modifications to the international tax framework and the restoration of favorable tax treatment for certain business provisions. The legislation has multiple effective dates, with certain provisions effective in 2025 and others implemented through future years. We are currently assessing its impact on our consolidated financial statements.
NOTE 2 - SUPPLEMENTARY FINANCIAL STATEMENT INFORMATION
INVENTORIES
The following table presents the detail of our Inventories on the Statements of Unaudited Condensed Consolidated Financial Position:
| | | | | | | | | | | |
| (In millions) | June 30,
2025 | | December 31,
2024 |
| Product inventories | | | |
| Finished and semi-finished goods | $ | 2,319 | | | $ | 2,393 | |
| Raw materials | 1,882 | | | 2,208 | |
| Total product inventories | 4,201 | | | 4,601 | |
| Manufacturing supplies and critical spares | 498 | | | 493 | |
| Inventories | $ | 4,699 | | | $ | 5,094 | |
SUPPLY CHAIN FINANCE PROGRAMS
We negotiate payment terms directly with our suppliers for the purchase of goods and services. We currently offer voluntary supply chain finance programs that enable our suppliers to sell their Cliffs receivables to financial intermediaries, at the sole discretion of both the suppliers and financial intermediaries. No guarantees are provided by us or our subsidiaries under the supply chain finance programs. The supply chain finance programs allow our suppliers to be paid by the financial intermediaries earlier than the due date on the applicable invoice. Supply chain finance programs that extend terms or provide us an economic benefit are classified as short-term financings. As of June 30, 2025 and December 31, 2024, we had $22 million and $29 million, respectively, deemed as short-term financings that are classified in Other current liabilities. Additionally, as of June 30, 2025 and December 31, 2024, we had $82 million and $76 million, respectively, classified as Accounts payable.
INDEFINITELY IDLED FACILITIES CHARGES
The following table represents a reconciliation of our accrued liabilities related to the discontinuation of certain product lines resulting from the indefinite idling of our Steelton rail production facility and Weirton tinplate production facility:
| | | | | | | | | | | | | | | | | | | | | | | |
| (In millions) | Employee-Related Costs | | Exit Costs | | Asset Impairment | | Total |
| Balance as of December 31, 2024 | $ | 56 | | | $ | 15 | | | $ | — | | | $ | 71 | |
Costs incurred1 | — | | | 3 | | | — | | | 3 | |
| Cash payments | (8) | | | (9) | | | — | | | (17) | |
| | | | | | | |
| Balance as of March 31, 2025 | $ | 48 | | | $ | 9 | | | $ | — | | | $ | 57 | |
Costs incurred2 | 70 | | | 26 | | | 39 | | | 135 | |
| Cash payments | (7) | | | (22) | | | — | | | (29) | |
| Non-cash | — | | | — | | | (39) | | | (39) | |
| Balance as of June 30, 2025 | $ | 111 | | | $ | 13 | | | $ | — | | | $ | 124 | |
| | | | | | | |
1 All $3 million of cost incurred was recorded in Restructuring and other charges. |
2 Of the $135 million of cost incurred, $86 million was recorded in Restructuring and other charges, $39 million was recorded in Asset impairments, and $10 million was recorded in Net periodic benefit credits other than service cost component. |
CASH FLOW INFORMATION
A reconciliation of capital additions to cash paid for capital expenditures is as follows:
| | | | | | | | | | | |
| Six Months Ended
June 30, |
| (In millions) | 2025 | | 2024 |
| Capital additions | $ | 281 | | | $ | 346 | |
| Less: | | | |
| Non-cash accruals | (53) | | | (47) | |
| Equipment financed with seller | 28 | | | — | |
| Right-of-use assets - finance leases | 42 | | | 54 | |
| Cash paid for capital expenditures including deposits | $ | 264 | | | $ | 339 | |
Cash payments (receipts) for income taxes and interest are as follows:
| | | | | | | | | | | |
| Six Months Ended
June 30, |
| (In millions) | 2025 | | 2024 |
| Income taxes paid | $ | 4 | | | $ | 10 | |
| Income tax refunds | (11) | | | (4) | |
Interest paid on debt obligations net of capitalized interest1 | 210 | | | 134 | |
| | | |
1 Capitalized interest was $8 million for each of the six months ended June 30, 2025 and 2024. |
NOTE 3 - ACQUISITIONS
STELCO ACQUISITION OVERVIEW
On November 1, 2024, pursuant to the Arrangement Agreement, we completed the Stelco Acquisition, in which we were the acquirer. The Stelco Acquisition expands our existing presence in Canada and diversifies our customer base across service centers, construction and other industrial end markets in Canada with higher volumes of spot sales.
The Stelco Acquisition was accounted for under the acquisition method of accounting for business combinations.
The fair value of the total purchase consideration was determined as follows:
| | | | | |
| (In millions) | |
| Total cash consideration | $ | 2,450 | |
| Total share exchange consideration | 343 | |
| Total debt consideration | 415 | |
| Total purchase consideration | $ | 3,208 | |
Total consideration shares are calculated as follows:
| | | | | |
| Number of outstanding Stelco shares | 54,448,388 | |
| Number of outstanding share-based compensation awards | 2,516,415 | |
| Total consideration shares | 56,964,803 | |
Total estimated cash consideration is calculated as follows:
| | | | | |
| Number of consideration shares | 56,964,803 | |
| Consideration share price per share (CAD) | $ | 60.00 | |
| Total cash consideration (CAD) (in millions) | 3,418 | |
| Exchange rate (November 1, 2024) | 0.7168 | |
| Total cash consideration (USD) | $ | 2,450 | |
The fair value of share exchange consideration is as follows:
| | | | | |
| Number of consideration shares | 56,964,803 | |
| Fixed share exchange factor | 0.454 | |
| Total Cliffs exchange shares | 25,862,021 | |
| Cliffs share price at closing date (November 1, 2024) | $ | 13.27 | |
| Total share exchange consideration (in millions) | $ | 343 | |
The fair value of debt consideration includes outstanding obligations with preexisting change-in-control provisions requiring repayment at the time of closing. The debt consideration includes amounts repaid in connection with retiring Stelco's asset-based lending facility and inventory monetization arrangement.
VALUATION ASSUMPTION AND PURCHASE PRICE ALLOCATION
We estimated fair values at November 1, 2024 for the preliminary allocation of consideration to the net tangible and intangible assets acquired and liabilities assumed in connection with the Stelco Acquisition. During the measurement period, we will continue to obtain information to assist in finalizing the fair value of assets acquired and liabilities assumed, which may differ materially from these preliminary estimates. If we determine any measurement period adjustments are material, we will apply those adjustments, including any related impacts to net income, in the reporting period in which the adjustments are determined. We are in the process of conducting a valuation of the assets acquired and liabilities assumed related to the Stelco Acquisition, most notably, personal and real property, deferred taxes, environmental obligations, asset retirement obligations and intangible assets, and the final allocation will be made when completed, including the result of any identified goodwill. Accordingly, the provisional measurements noted below are preliminary and subject to modification in the future.
The preliminary purchase price allocation to assets acquired and liabilities assumed in the Stelco Acquisition was:
| | | | | | | | | | | | | | | | | | | | | |
| (In millions) | Initial Allocation of Consideration | | Measurement Period Adjustments | | Updated Allocation | | | | |
| Cash and cash equivalents | $ | 341 | | | $ | — | | | $ | 341 | | | | | |
| Accounts receivable | 104 | | | — | | | 104 | | | | | |
| Inventories | 726 | | | (11) | | | 715 | | | | | |
| Other current assets | 107 | | | (1) | | | 106 | | | | | |
| Property, plant and equipment | 1,286 | | | (4) | | | 1,282 | | | | | |
| Intangible assets | 1,025 | | | — | | | 1,025 | | | | | |
| Other non-current assets | 250 | | | (1) | | | 249 | | | | | |
| Accounts payable | (212) | | | — | | | (212) | | | | | |
| Accrued employment costs | (29) | | | — | | | (29) | | | | | |
| Accrued expenses | (6) | | | (1) | | | (7) | | | | | |
| Other current liabilities | (71) | | | — | | | (71) | | | | | |
| Pension and OPEB liability, non-current | (14) | | | — | | | (14) | | | | | |
| Deferred income taxes | (449) | | | 10 | | | (439) | | | | | |
| Asset retirement and environmental obligations | (20) | | | — | | | (20) | | | | | |
| Other non-current liabilities | (616) | | | 5 | | | (611) | | | | | |
| Net identifiable assets acquired | 2,422 | | | (3) | | | 2,419 | | | | | |
| Goodwill | 786 | | | 3 | | | 789 | | | | | |
| Total net assets acquired | $ | 3,208 | | | $ | — | | | $ | 3,208 | | | | | |
The goodwill resulting from the Stelco Acquisition primarily represents the growth opportunities through diversification within our customer base across service centers, construction and other industrial end markets with higher volumes of spot sales, as well as any synergistic benefits to be realized from the Stelco Acquisition within our Steelmaking segment. Goodwill is not expected to be deductible for U.S. federal income tax purposes.
The purchase price allocated to identifiable intangible assets acquired was:
| | | | | | | | | | | |
| (In millions) | | Weighted Average Life
(In years) |
| Intangible assets: | | | |
| Customer relationships | $ | 953 | | | 15 |
| Trade names and trademarks | 72 | | | 15 |
| Total identifiable intangible assets | $ | 1,025 | | | 15 |
PRO FORMA RESULTS
The following table provides unaudited pro forma financial information, prepared in accordance with Topic 805, Business Combinations, as if Stelco had been acquired as of January 1, 2023:
| | | | | | | | | | | |
| (In millions) | Three Months Ended June 30, 2024 | | Six Months Ended June 30, 2024 |
| Revenues | $ | 5,615 | | | $ | 11,367 | |
| Net income (loss) attributable to Cliffs shareholders | 30 | | | (63) | |
The unaudited pro forma financial information has been calculated after applying our accounting policies and adjusting the historical results with pro forma adjustments, net of tax, that assume the Stelco Acquisition occurred on January 1, 2023. There were no significant non-recurring pro forma adjustments included in the pro forma results for the three and six months ended June 30, 2024.
The unaudited pro forma financial information does not reflect the potential realization of synergies or cost savings, nor does it reflect other costs relating to the integration of the acquired company. This unaudited pro forma financial information should not be considered indicative of the results that would have actually occurred if the Stelco Acquisition had been consummated on January 1, 2023, nor are they indicative of future results.
NOTE 4 - REVENUES
We generate our revenue through product sales, in which shipping terms indicate when we have fulfilled our performance obligations and transferred control of products to our customer. Our revenue transactions consist of a single performance obligation to transfer promised goods. Our contracts with customers define the mechanism for determining the sales price, which is generally fixed upon transfer of control, but the contracts generally do not impose a specific quantity on either party. Quantities to be delivered to the customer are determined at a point near the date of delivery through purchase orders or other written instructions we receive from the customer. Spot market sales are made through purchase orders or other written instructions. We consider our performance obligation to be complete and recognize revenue when control transfers in accordance with shipping terms.
Revenue is measured as the amount of consideration we expect to receive in exchange for transferring product. We reduce the amount of revenue recognized for estimated returns and other customer credits, such as discounts and volume rebates, based on the expected value to be realized. Payment terms are consistent with terms standard to the markets we serve. Sales taxes collected from customers are excluded from revenues. Revenue by market and product are presented net of intersegment revenues, which are entirely related to the Steelmaking segment.
The following table represents our Revenues by market:
| | | | | | | | | | | | | | | | | | | | | | | |
| Three Months Ended
June 30, | | Six Months Ended
June 30, |
| (In millions) | 2025 | | 2024 | | 2025 | | 2024 |
| Steelmaking | | | | | | | |
| Automotive | $ | 1,249 | | | $ | 1,460 | | | $ | 2,546 | | | $ | 3,077 | |
| Infrastructure and manufacturing | 1,489 | | | 1,421 | | | 2,843 | | | 2,813 | |
| Distributors and converters | 1,433 | | | 1,402 | | | 2,661 | | | 2,814 | |
Other | 600 | | | 632 | | | 1,188 | | | 1,238 | |
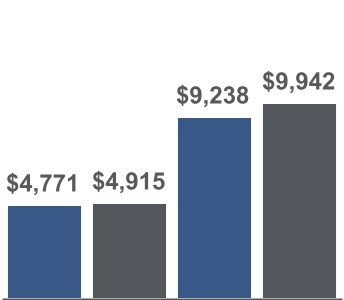
| Total Steelmaking | 4,771 | | | 4,915 | | | 9,238 | | | 9,942 | |
| Other Businesses | | | | | | | |
| Automotive | 129 | | | 148 | | | 259 | | | 288 | |
| Infrastructure and manufacturing | 14 | | | 10 | | | 24 | | | 20 | |
| Distributors and converters | 20 | | | 19 | | | 42 | | | 41 | |
| Total Other Businesses | 163 | | | 177 | | | 325 | | | 349 | |
| Total revenues | $ | 4,934 | | | $ | 5,092 | | | $ | 9,563 | | | $ | 10,291 | |
The following tables represent our Revenues by product line:
| | | | | | | | | | | | | | | | | | | | | | | |
| Three Months Ended
June 30, | | Six Months Ended
June 30, |
| (In millions) | 2025 | | 2024 | | 2025 | | 2024 |
| Steelmaking | | | | | | | |
| Hot-rolled steel | $ | 1,332 | | | $ | 1,115 | | | $ | 2,498 | | | $ | 2,243 | |
| Cold-rolled steel | 645 | | | 711 | | | 1,236 | | | 1,460 | |
| Coated steel | 1,392 | | | 1,546 | | | 2,753 | | | 3,169 | |
| Stainless and electrical steel | 434 | | | 480 | | | 878 | | | 941 | |
| Plate steel | 275 | | | 317 | | | 522 | | | 650 | |
| Other steel products | 276 | | | 318 | | | 523 | | | 653 | |
| Other | 417 | | | 428 | | | 828 | | | 826 | |
| Total Steelmaking | 4,771 | | | 4,915 | | | 9,238 | | | 9,942 | |
| Other Businesses | | | | | | | |
| Other | 163 | | | 177 | | | 325 | | | 349 | |
| Total revenues | $ | 4,934 | | | $ | 5,092 | | | $ | 9,563 | | | $ | 10,291 | |
NOTE 5 - SEGMENT REPORTING
We are vertically integrated from the mining of iron ore, production of pellets and direct reduced iron, and processing of ferrous scrap through primary steelmaking and downstream finishing, stamping, tooling, and tubing. We are organized into four operating segments based on our differentiated products – Steelmaking, Tubular, Tooling and Stamping, and European Operations. We have one reportable segment – Steelmaking. The operating segment results of our Tubular, Tooling and Stamping, and European Operations that do not constitute reportable segments are combined and disclosed in the Other Businesses category. Our Steelmaking segment operates as a leading North America-based steel producer with focus on value-added sheet products, primarily serving the automotive, infrastructure and manufacturing, and distributors and converters markets. Our Other Businesses primarily include the operating segments that provide customer solutions with carbon and stainless steel tubing products, advanced-engineered solutions, tool design and build, hot- and cold-stamped steel components, and complex assemblies. All intersegment transactions were eliminated in consolidation. Corporate assets and capital additions are primarily related to and support the operations of the Steelmaking segment and therefore have been incorporated within the Steelmaking segment total assets and capital additions below. We allocate Corporate Selling, general and administrative expenses to our operating segments.
Our CODM, Lourenco Goncalves, Chairman, President and Chief Executive Officer, evaluates performance on an operating segment basis, as well as a consolidated basis, based on Adjusted EBITDA, which is a non-GAAP measure. This measure is used by our CODM, management, investors, lenders and other external users of our financial statements to assess our operating performance and to compare operating performance to other companies in the steel industry. In addition, our CODM believes Adjusted EBITDA is a useful measure to assess the earnings power of the business without the impact of capital structure and can be used to assess our ability to service debt and fund future capital expenditures in the business.
The following tables provide our results by segment as well as a reconciliation from consolidated Adjusted EBITDA to our consolidated Net income (loss):
| | | | | | | | | | | | | | | | | | | | | | | |
| Three Months Ended June 30, 2025 |
| (In millions) | Steelmaking | | Other Businesses | | Eliminations | | Total |
| Revenues | $ | 4,808 | | | $ | 163 | | | $ | (37) | | | $ | 4,934 | |
| Cost of goods sold | (5,031) | | | (147) | | | 35 | | | (5,143) | |
| Selling, general and administrative expenses | (130) | | | (7) | | | — | | | (137) | |
| Net periodic benefit credits other than service cost component | 43 | | | — | | | — | | | 43 | |
| Excluding depreciation, depletion and amortization | 386 | | | 7 | | | — | | | 393 | |
Other segment items1 | 7 | | | — | | | — | | | 7 | |
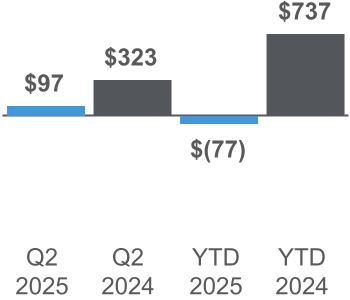
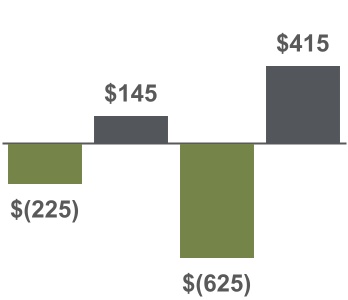
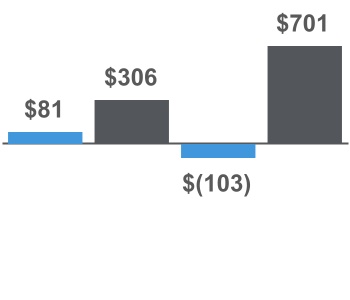
| Total Adjusted EBITDA | $ | 83 | | | $ | 16 | | | $ | (2) | | | $ | 97 | |
| | | | | | | |
| Interest expense, net | | | | | | | (149) | |
| Income tax benefit | | | | | | | 148 | |
| Depreciation, depletion and amortization | | | | | | | (393) | |
EBITDA from noncontrolling interests2 | | | | | | | 20 | |
| Idled facilities charges | | | | | | | (204) | |
| Changes in fair value of derivatives, net | | | | | | | (15) | |
| Currency exchange | | | | | | | 48 | |
| | | | | | | |
| Severance | | | | | | | (19) | |
| Other, net | | | | | | | (3) | |
| Net loss | | | | | | | $ | (470) | |
| | | | | | | |
| Capital Additions | $ | 150 | | | $ | 2 | | | $ | — | | | $ | 152 | |
| | | | | | | |
1 Other segment items primarily consists of the exclusion of EBITDA from noncontrolling interests from Adjusted EBITDA and certain idled facilities charges and the inclusion of items within Miscellaneous – net and Other non-operating income (expense). |
2 EBITDA from noncontrolling interests includes net income attributable to noncontrolling interests of $13 million and the exclusion of depreciation, depletion, and amortization of $7 million. |
| | | | | | | | | | | | | | | | | | | | | | | |
| Three Months Ended June 30, 2024 |
| (In millions) | Steelmaking | | Other Businesses | | Eliminations | | Total |
| Revenues | $ | 4,937 | | | $ | 177 | | | $ | (22) | | | $ | 5,092 | |
| Cost of goods sold | (4,791) | | | (160) | | | 21 | | | (4,930) | |
| Selling, general and administrative expenses | (96) | | | (7) | | | — | | | (103) | |
| Net periodic benefit credits other than service cost component | 62 | | | — | | | — | | | 62 | |
| Excluding depreciation, depletion and amortization | 219 | | | 9 | | | — | | | 228 | |
Other segment items1 | (25) | | | (1) | | | — | | | (26) | |
| Total Adjusted EBITDA | $ | 306 | | | $ | 18 | | | $ | (1) | | | $ | 323 | |
| | | | | | | |
| Interest expense, net | | | | | | | (69) | |
| Income tax benefit | | | | | | | 15 | |
| Depreciation, depletion and amortization | | | | | | | (228) | |
EBITDA from noncontrolling interests2 | | | | | | | 15 | |
| Idled facilities charges | | | | | | | (40) | |
| | | | | | | |
| | | | | | | |
| Loss on extinguishment of debt | | | | | | | (6) | |
| Severance | | | | | | | (1) | |
| | | | | | | |
| Net income | | | | | | | $ | 9 | |
| | | | | | | |
| Capital Additions | $ | 187 | | | $ | 2 | | | $ | — | | | $ | 189 | |
| | | | | | | |
1 Other segment items primarily consists of the exclusion of EBITDA from noncontrolling interests from Adjusted EBITDA and the inclusion of items within Miscellaneous – net and Other non-operating income (loss). |
2 EBITDA from noncontrolling interests includes net income attributable to noncontrolling interests of $7 million and the exclusion of depreciation, depletion, and amortization of $8 million. |
| | | | | | | | | | | | | | | | | | | | | | | |
| Six Months Ended June 30, 2025 |
| (In millions) | Steelmaking | | Other Businesses | | Eliminations | | Total |
| Revenues | $ | 9,303 | | | $ | 325 | | | $ | (65) | | | $ | 9,563 | |
| Cost of goods sold | (9,926) | | | (300) | | | 63 | | | (10,163) | |
| Selling, general and administrative expenses | (256) | | | (14) | | | — | | | (270) | |
| Net periodic benefit credits other than service cost component | 100 | | | — | | | — | | | 100 | |
| Excluding depreciation, depletion and amortization | 660 | | | 15 | | | — | | | 675 | |
Other segment items1 | 18 | | | — | | | — | | | 18 | |
| Total Adjusted EBITDA | $ | (101) | | | $ | 26 | | | $ | (2) | | | $ | (77) | |
| | | | | | | |
| Interest expense, net | | | | | | | (289) | |
| Income tax benefit | | | | | | | 295 | |
| Depreciation, depletion and amortization | | | | | | | (675) | |
EBITDA from noncontrolling interests2 | | | | | | | 38 | |
| Idled facilities charges | | | | | | | (248) | |
| Changes in fair value of derivatives, net | | | | | | | (24) | |
| Currency exchange | | | | | | | 46 | |
| | | | | | | |
| Severance | | | | | | | (20) | |
| Other, net | | | | | | | 1 | |
| Net loss | | | | | | | $ | (953) | |
| | | | | | | |
| Capital Additions | $ | 273 | | | $ | 8 | | | $ | — | | | $ | 281 | |
| | | | | | | |
1 Other segment items primarily consists of the exclusion of EBITDA from noncontrolling interests from Adjusted EBITDA and certain idled facilities charges and the inclusion of items within Miscellaneous – net and Other non-operating income (expense). |
2 EBITDA from noncontrolling interests includes net income attributable to noncontrolling interests of $25 million and the exclusion of depreciation, depletion, and amortization of $13 million. |
| | | | | | | | | | | | | | | | | | | | | | | |
| Six Months Ended June 30, 2024 |
| (In millions) | Steelmaking | | Other Businesses | | Eliminations | | Total |
| Revenues | $ | 9,990 | | | $ | 349 | | | $ | (48) | | | $ | 10,291 | |
| Cost of goods sold | (9,576) | | | (317) | | | 49 | | | (9,844) | |
| Selling, general and administrative expenses | (221) | | | (14) | | | — | | | (235) | |
| Net periodic benefit credits other than service cost component | 122 | | | — | | | — | | | 122 | |
| Excluding depreciation, depletion and amortization | 441 | | | 17 | | | — | | | 458 | |
Other segment items1 | (55) | | | — | | | — | | | (55) | |
| Total Adjusted EBITDA | $ | 701 | | | $ | 35 | | | $ | 1 | | | $ | 737 | |
| | | | | | | |
| Interest expense, net | | | | | | | (133) | |
| Income tax benefit | | | | | | | 23 | |
| Depreciation, depletion and amortization | | | | | | | (458) | |
EBITDA from noncontrolling interests2 | | | | | | | 36 | |
| Idled facilities charges | | | | | | | (217) | |
| | | | | | | |
| | | | | | | |
| Loss on extinguishment of debt | | | | | | | (27) | |
| Severance | | | | | | | (3) | |
| Other, net | | | | | | | (2) | |
| Net loss | | | | | | | $ | (44) | |
| | | | | | | |
| Capital Additions | $ | 343 | | | $ | 3 | | | $ | — | | | $ | 346 | |
| | | | | | | |
1 Other segment items primarily consists of the exclusion of EBITDA from noncontrolling interests from Adjusted EBITDA and the inclusion of items within Miscellaneous – net and Other non-operating income (loss). |
2 EBITDA from noncontrolling interests includes net income attributable to noncontrolling interests of $21 million and the exclusion of depreciation, depletion, and amortization of $15 million. |
The following summarizes our assets by segment:
| | | | | | | | | | | |
| (In millions) | June 30,
2025 | | December 31,
2024 |
| Assets: | | | |
| Steelmaking | $ | 19,848 | | | $ | 20,327 | |
| Other Businesses | 623 | | | 620 | |
| Total segment assets | $ | 20,471 | | | $ | 20,947 | |
NOTE 6 - PROPERTY, PLANT AND EQUIPMENT
The following table indicates the carrying value of each of the major classes of our depreciable assets:
| | | | | | | | | | | |
| (In millions) | June 30,
2025 | | December 31,
2024 |
| Land, land improvements and mineral rights | $ | 1,457 | | | $ | 1,451 | |
| Buildings | 1,114 | | | 1,104 | |
| Equipment | 11,319 | | | 11,119 | |
| Other | 358 | | | 349 | |
| Construction in progress | 751 | | | 728 | |
Total property, plant and equipment1 | 14,999 | | | 14,751 | |
| Allowance for depreciation and depletion | (5,379) | | | (4,809) | |
| Property, plant and equipment, net | $ | 9,620 | | | $ | 9,942 | |
| | | |
1 Includes right-of-use assets related to finance leases of $547 million and $505 million as of June 30, 2025 and December 31, 2024, respectively. |
We recorded depreciation and depletion expense of $374 million and $638 million for the three and six months ended June 30, 2025, respectively, and $227 million and $454 million for the three and six months ended June 30, 2024, respectively.
During the second quarter of 2025, the decision to indefinitely idle our Steelton, Conshohocken, and Riverdale facilities occurred. This resulted in a $39 million Asset impairment to Property, plant and equipment, net and accelerated depreciation of $119 million for both the three and six months ended June 30, 2025, included within depreciation and depletion expense.
NOTE 7 - GOODWILL AND INTANGIBLE ASSETS AND LIABILITIES
GOODWILL
The following is a summary of Goodwill by segment:
| | | | | | | | | | | |
| (In millions) | June 30,
2025 | | December 31,
2024 |
| Steelmaking | $ | 1,765 | | | $ | 1,719 | |
| Other Businesses | 49 | | | 49 | |
| Total | $ | 1,814 | | | $ | 1,768 | |
The increase of $46 million in the balance of Goodwill in our Steelmaking segment as of June 30, 2025, compared to December 31, 2024, is primarily due to fluctuation in foreign currency exchange rates. Additionally, to a lesser extent, the change is attributable to an increase in estimated identified goodwill as a result of measurement period adjustments to the preliminary purchase price allocation for the Stelco Acquisition. Refer to NOTE 3 - ACQUISITIONS for further details.
INTANGIBLE ASSETS AND LIABILITIES
The following is a summary of our intangible assets and liabilities:
| | | | | | | | | | | | | | | | | | | | | | | | | | | | | | | | | | | |
| June 30, 2025 | | December 31, 2024 |
| Gross Amount | | Accumulated Amortization | | Net Amount | | Gross Amount | | Accumulated Amortization | | Net Amount |
Intangible assets1: | | | | | | | | | | | |
| Customer relationships | $ | 1,067 | | | $ | (69) | | | $ | 998 | | | $ | 1,015 | | | $ | (34) | | | $ | 981 | |
| Developed technology | 60 | | | (19) | | | 41 | | | 60 | | | (17) | | | 43 | |
| Trade names and trademarks | 91 | | | (11) | | | 80 | | | 87 | | | (8) | | | 79 | |
| Mining permits | 72 | | | (29) | | | 43 | | | 72 | | | (29) | | | 43 | |
| Supplier relationships | 29 | | | (6) | | | 23 | | | 29 | | | (5) | | | 24 | |
| Total intangible assets | $ | 1,319 | | | $ | (134) | | | $ | 1,185 | | | $ | 1,263 | | | $ | (93) | | | $ | 1,170 | |
Intangible liabilities2: | | | | | | | | | | | |
| Above-market supply contracts | $ | (71) | | | $ | 33 | | | $ | (38) | | | $ | (71) | | | $ | 30 | | | $ | (41) | |
| | | | | | | | | | | |
1 Intangible assets are classified as Other non-current assets. Amortization related to mining permits and supplier relationships is recognized in Cost of goods sold. Amortization of all other intangible assets is recognized in Selling, general and administrative expenses. |
2 Intangible liabilities are classified as Other non-current liabilities. Amortization of all intangible liabilities is recognized in Cost of goods sold. |
Amortization expense related to Intangible assets was $21 million and $3 million for the three months ended June 30, 2025 and 2024, respectively. Amortization expense related to Intangible assets was $40 million and $7 million for the six months ended June 30, 2025 and 2024, respectively. Estimated future amortization expense is $42 million for the remainder of 2025 and $83 million annually for the years 2026 through 2030. Additionally, customer relationships and trade names and trademarks intangibles are impacted by period over period fluctuations in foreign currency exchange rates.
Income from amortization related to the intangible liabilities was $2 million for both the three months ended June 30, 2025 and 2024. Income from amortization related to the intangible liabilities was $3 million for both the six months ended June 30, 2025 and 2024. Estimated future income from amortization is $2 million for the remainder of 2025 and $5 million annually for the years 2026 through 2030.
NOTE 8 - DEBT AND CREDIT FACILITIES
The following represents a summary of our long-term debt:
| | | | | | | | | | | | | | | | | | | | | | | | | | |
| (In millions) |
| Debt Instrument | | Issuer1 | | Annual Effective
Interest Rate | | June 30,
2025 | | December 31,
2024 |
| Senior Unsecured Notes: | | | | | | | | |
7.000% 2027 Senior Notes | | Cliffs | | 9.240% | | $ | 73 | | | $ | 73 | |
7.000% 2027 AK Senior Notes | | AK Steel | | 9.240% | | 56 | | | 56 | |
5.875% 2027 Senior Notes | | Cliffs | | 6.490% | | 556 | | | 556 | |
4.625% 2029 Senior Notes | | Cliffs | | 4.625% | | 368 | | | 368 | |
6.875% 2029 Senior Notes | | Cliffs | | 6.875% | | 900 | | | 900 | |
6.750% 2030 Senior Notes | | Cliffs | | 6.750% | | 750 | | | 750 | |
4.875% 2031 Senior Notes | | Cliffs | | 4.875% | | 325 | | | 325 | |
7.500% 2031 Senior Notes | | Cliffs | | 7.500% | | 850 | | | — | |
7.000% 2032 Senior Notes | | Cliffs | | 7.054% | | 1,425 | | | 1,425 | |
7.375% 2033 Senior Notes | | Cliffs | | 7.375% | | 900 | | | 900 | |
6.250% 2040 Senior Notes | | Cliffs | | 6.340% | | 235 | | | 235 | |
| ABL Facility | | Cliffs2 | | Variable3 | | 1,377 | | | 1,560 | |
| Total principal amount | | | | | | 7,815 | | | 7,148 | |
| Unamortized discounts and issuance costs | | | | | | (88) | | | (83) | |
| Total long-term debt | | | | | | $ | 7,727 | | | $ | 7,065 | |
| | | | | | | | |
1 Unless otherwise noted, references in this column and throughout this NOTE 8 - DEBT AND CREDIT FACILITIES to "Cliffs" are to Cleveland-Cliffs Inc., and references to "AK Steel" are to AK Steel Corporation (n/k/a Cleveland-Cliffs Steel Corporation). |
2 Refers to Cleveland-Cliffs Inc. as borrower under our ABL Facility. |
3 Our ABL Facility annual effective interest rate was 6.17% as of June 30, 2025. |
7.500% 2031 SENIOR NOTES OFFERING
On February 6, 2025, we entered into an indenture among Cliffs, the guarantors party thereto and U.S. Bank Trust Company, National Association, as trustee, relating to the issuance of $850 million aggregate principal amount of our 7.500% 2031 Senior Notes, which were issued at par. The 7.500% 2031 Senior Notes were issued in a private placement transaction exempt from the registration requirements of the Securities Act.
The 7.500% 2031 Senior Notes bear interest at a rate of 7.500% per annum, payable semi-annually in arrears on March 15 and September 15 of each year, commencing on September 15, 2025. The 7.500% 2031 Senior Notes mature on September 15, 2031.
The 7.500% 2031 Senior Notes are unsecured senior obligations and rank equally in right of payment with all of our existing and future unsecured and unsubordinated indebtedness. The 7.500% 2031 Senior Notes are guaranteed on a senior unsecured basis by our material direct and indirect wholly owned domestic subsidiaries. The 7.500% 2031 Senior Notes are structurally subordinated to all existing and future indebtedness and other liabilities of our subsidiaries that do not guarantee the 7.500% 2031 Senior Notes.
The 7.500% 2031 Senior Notes may be redeemed, in whole or in part, at any time at our option not less than 10 days nor more than 60 days after prior notice is sent to the holders of the 7.500% 2031 Senior Notes. The 7.500% 2031 Senior Notes are redeemable prior to March 15, 2028, at a redemption price equal to 100% of the principal amount thereof plus a "make-whole" premium set forth in the indenture. We may also redeem up to 35% of the aggregate principal amount of the 7.500% 2031 Senior Notes prior to March 15, 2028, at a redemption price equal to 107.500% of the principal amount thereof with the net cash proceeds of one or more equity offerings. The 7.500% 2031 Senior Notes are redeemable beginning on March 15, 2028, at a redemption price equal to 103.750% of the principal amount thereof, decreasing to 101.875% on March 15, 2029, and are redeemable at par beginning on March 15, 2030. In each case, we pay the applicable redemption or "make-whole" premiums plus accrued and unpaid interest, if any, to, but not including, the date of redemption.
In addition, if a change in control triggering event, as defined in the indenture, occurs with respect to the 7.500% 2031 Senior Notes, we will be required to offer to repurchase the notes at a purchase price equal to 101% of their principal amount, plus accrued and unpaid interest, if any, to, but not including, the date of repurchase.
The terms of the 7.500% 2031 Senior Notes contain certain customary covenants; however, there are no financial covenants.
ABL FACILITY
As of June 30, 2025, we were in compliance with the ABL Facility liquidity requirements and, therefore, the springing financial covenant requiring a minimum fixed charge coverage ratio of 1.0 to 1.0 was not applicable.
The following represents a summary of our borrowing capacity under the ABL Facility:
| | | | | | | | |
| (In millions) | | June 30,
2025 |
Available borrowing base on ABL Facility1 | | $ | 4,058 | |
| Borrowings | | (1,377) | |
Letter of credit obligations2 | | (63) | |
| Borrowing capacity available | | $ | 2,618 | |
| | |
1 As of June 30, 2025, the ABL Facility has a maximum available borrowing base of $4.75 billion. The borrowing base is determined by applying customary advance rates to eligible accounts receivable, inventory and certain mobile equipment. |
2 We issued standby letters of credit with certain financial institutions in order to support business obligations, including, but not limited to, operating agreements, employee severance, environmental obligations, workers' compensation and insurance obligations. |
DEBT MATURITIES
The following represents a summary of our maturities of debt instruments based on the principal amounts outstanding at June 30, 2025 (in millions):
| | | | | | | | | | | | | | | | | | | | | | | | | | | | | | | | | | | | | | |
| 2025 | | 2026 | | 2027 | | 2028 | | 2029 | | Thereafter | | Total |
| $ | — | | | $ | — | | | $ | 685 | | | $ | 1,377 | | | $ | 1,268 | | | $ | 4,485 | | | $ | 7,815 | |
NOTE 9 - PENSIONS AND OTHER POSTRETIREMENT BENEFITS
We offer defined benefit pension plans, defined contribution pension plans and OPEB plans to a significant portion of our employees and retirees. Benefits are also provided through multiemployer plans for certain union members.
The following are the components of defined benefit pension and OPEB costs (credits):
DEFINED BENEFIT PENSION COSTS (CREDITS)
| | | | | | | | | | | | | | | | | | | | | | | |
| Three Months Ended
June 30, | | Six Months Ended
June 30, |
| (In millions) | 2025 | | 2024 | | 2025 | | 2024 |
| Service cost | $ | 7 | | | $ | 7 | | | $ | 14 | | | $ | 14 | |
| Interest cost | 52 | | | 54 | | | 105 | | | 109 | |
| Expected return on plan assets | (80) | | | (80) | | | (159) | | | (160) | |
| Amortization: | | | | | | | |
| Prior service costs | 5 | | | 4 | | | 9 | | | 8 | |
| Net actuarial gain | (2) | | | — | | | (4) | | | — | |
| Net periodic benefit credits | $ | (18) | | | $ | (15) | | | $ | (35) | | | $ | (29) | |
OPEB COSTS (CREDITS)
| | | | | | | | | | | | | | | | | | | | | | | |
| Three Months Ended
June 30, | | Six Months Ended
June 30, |
| (In millions) | 2025 | | 2024 | | 2025 | | 2024 |
| Service cost | $ | 2 | | | $ | 2 | | | $ | 4 | | | $ | 4 | |
| Interest cost | 15 | | | 13 | | | 29 | | | 25 | |
| Expected return on plan assets | (10) | | | (10) | | | (21) | | | (21) | |
Termination benefits1 | 15 | | | — | | | 15 | | | 2 | |
| Amortization: | | | | | | | |
| Prior service credits | (4) | | | (4) | | | (7) | | | (8) | |
| Net actuarial gain | (34) | | | (39) | | | (67) | | | (77) | |
| Net periodic benefit credits | $ | (16) | | | $ | (38) | | | $ | (47) | | | $ | (75) | |
| | | | | | | |
1 The termination benefits relate to the decision to indefinitely idle our Conshohocken, Riverdale and Steelton facilities in the second quarter of 2025 and the indefinite idle of our Weirton tinplate production facility in the first quarter of 2024. |
Based on funding requirements, we made $14 million and $29 million of defined benefit pension contributions for the three and six months ended June 30, 2025, respectively. Based on funding requirements, we made $16 million of defined benefit pension
contributions for both the three and six months ended June 30, 2024. Based on funding requirements, we made no contributions to our voluntary employee benefit association trust plans for any of the three and six months ended June 30, 2025 and 2024.
NOTE 10 - INCOME TAXES
Our income tax benefit for the three and six months ended June 30, 2025 is $148 million and $295 million, respectively, compared to income tax benefit of $15 million and $23 million, respectively, for the three and six months ended June 30, 2024, primarily due to an increase in Loss before income taxes and the impact of immaterial discrete items relative to those losses.
NOTE 11 - ASSET RETIREMENT AND ENVIRONMENTAL OBLIGATIONS
ASSET RETIREMENT OBLIGATIONS
The accrued closure obligation provides for contractual and legal obligations related to our indefinitely idled and closed operations and for the eventual closure of our active operations. The closure date for each of our active mine sites was determined based on the exhaustion date of the remaining mineral reserves, and the amortization of the related asset and accretion of the liability is recognized over the estimated mine lives. The closure date and expected timing of the capital requirements to meet our obligations for our indefinitely idled or closed mines is determined based on the unique circumstances of each property. For indefinitely idled or closed mines, the accretion of the liability is recognized over the anticipated timing of remediation. Asset retirement obligations at our steelmaking operations primarily include the closure and post-closure care for on-site landfills and other waste containment facilities. Asset retirement obligations have been recorded at present values using settlement dates based on when we expect these facilities to reach capacity and close.
The following is a summary of our asset retirement obligations:
| | | | | | | | | | | |
| (In millions) | June 30,
2025 | | December 31,
2024 |
Asset retirement obligations1 | $ | 534 | | | $ | 526 | |
| Less: current portion | 21 | | | 25 | |
| Long-term asset retirement obligations | $ | 513 | | | $ | 501 | |
| | | |
1 Includes $308 million and $302 million related to our active operations as of June 30, 2025 and December 31, 2024, respectively. |
The following is a roll-forward of our asset retirement obligations:
| | | | | | | | | | | |
| (In millions) | 2025 | | 2024 |
| Asset retirement obligations as of January 1 | $ | 526 | | | $ | 459 | |
| Accretion expense | 15 | | | 11 | |
| Revision in estimated cash flows | 5 | | | 50 | |
| Remediation payments | (12) | | | (14) | |
| Asset retirement obligations as of June 30 | $ | 534 | | | $ | 506 | |
During the first quarter of 2024, we announced the indefinite idle of our Weirton tinplate production plant, resulting in an increase to our asset retirement obligations as a result of acceleration of the timing and refinement in the cost required.
ENVIRONMENTAL OBLIGATIONS
Our operations currently use, and have in the past used, hazardous materials and substances, and we have generated, and expect to continue to generate, solid and hazardous waste. We have been, and may in the future be, subject to claims under laws and regulations for toxic torts, natural resource damages and other damages, as well as for the investigation and clean-up of soil, surface water, sediments, groundwater, and other natural resources and reclamation of properties. If we reasonably can, we estimate potential remediation expenditures for those sites where future remediation efforts are probable based on identified conditions, regulatory requirements, or contractual obligations arising from the sale of a business or facility. For sites involving government required investigations, including pursuant to RCRA and CERCLA, we typically make an estimate of potential remediation expenditures only after the investigation is complete and when we better understand the nature and scope of the remediation. In general, the material factors in these estimates include the costs associated with investigations, delineations, risk assessments, remedial work, governmental response and oversight, site monitoring and preparation of reports to the appropriate environmental agencies.
The following is a summary of our environmental obligations:
| | | | | | | | | | | |
| (In millions) | June 30,
2025 | | December 31,
2024 |
| Environmental obligations | $ | 112 | | | $ | 114 | |
| Less: current portion | 12 | | | 14 | |
| Long-term environmental obligations | $ | 100 | | | $ | 100 | |
NOTE 12 - FAIR VALUE MEASUREMENTS
The carrying values of certain financial instruments (e.g., Accounts receivable, net, Accounts payable and Other current liabilities) approximate fair value and, therefore, have been excluded from the table below. See NOTE 13 - DERIVATIVE INSTRUMENTS AND HEDGING for information on our derivative instruments, which are accounted for at fair value on a recurring basis.
A summary of the carrying value and fair value of other financial instruments were as follows:
| | | | | | | | | | | | | | | | | | | | | | | | | | | | | |
| | | June 30, 2025 | | December 31, 2024 |
| (In millions) | Valuation Hierarchy Classification | | Carrying
Value | | Fair
Value | | Carrying
Value | | Fair
Value |
| Senior notes | Level 1 | | $ | 6,350 | | | $ | 6,095 | | | $ | 5,505 | | | $ | 5,496 | |
| ABL Facility - outstanding balance | Level 2 | | 1,377 | | | 1,377 | | | 1,560 | | | 1,560 | |
| Total | | | $ | 7,727 | | | $ | 7,472 | | | $ | 7,065 | | | $ | 7,056 | |
The valuation of the financial asset classified in Level 2 was determined using a market approach based upon quoted prices for similar assets in active markets or other inputs that were observable.
EMPLOYEE BENEFIT COMMITMENT
In connection with the Stelco Acquisition, we have acquired funding commitments to employee life and health trusts. These obligations pertain to plans previously sponsored by Stelco prior to its bankruptcy. The commitments primarily involve fixed scheduled payments that will continue until 2042, with an additional variable component tied to Stelco's standalone operating performance. The financial liability is recorded at fair value on a recurring basis using a discounted cash flow model, which incorporates observable and unobservable inputs for risk-free interest rates and future operating estimates. The liability is classified as a Level 3 within the fair value hierarchy. The current and non-current portions of the employee benefit commitment are classified within Other current liabilities and Other non-current liabilities on the Statements of Consolidated Financial Position, respectively.
The following table summarizes the changes in fair value of the employee benefit commitment:
| | | | | | | |
| (In millions) | 2025 | | |
| Beginning balance as of January 1 | $ | (188) | | | |
| Change in fair value | (5) | | | |
| Payments | 11 | | | |
| Foreign currency translation | (11) | | | |
| Ending balance as of June 30 | $ | (193) | | | |
MINNTAC OPTION
Stelco is party to an option to purchase a 25% ownership interest in the MinnTac iron ore mine and related infrastructure located in Mt. Iron, Minnesota from U. S. Steel for $500 million. This option is exercisable by Stelco at any time until January 31, 2027. This option is recorded as a derivative instrument at fair value on a recurring basis and included within Other non-current assets on the Statements of Consolidated Financial Position. Any gain or loss recorded in relation to the fair value of this option is presented within Other non-operating income (expense). The fair value of the derivative asset is estimated using the Black-Scholes option pricing model, which incorporates observable or unobservable inputs for risk-free interest rates, foreign exchange rates, commodity prices, discount rates, corresponding market volatility levels and other market-based pricing factors. This option is classified as a Level 3 derivative asset within the fair value hierarchy.
The following table summarizes the changes in fair value of the MinnTac option:
| | | | | | | |
| (In millions) | 2025 | | |
| Beginning balance as of January 1 | $ | 95 | | | |
| Change in fair value | (24) | | | |
| Foreign currency translation | 5 | | | |
| Ending balance as of June 30 | $ | 76 | | | |
NOTE 13 - DERIVATIVE INSTRUMENTS AND HEDGING
We are exposed to price risk associated with fluctuations in the market prices of purchased raw materials and energy sources and the sales price of certain steel products. We may use cash-settled commodity purchase swaps to hedge the market risk associated with the purchase of certain of our raw materials and energy requirements and cash-settled sales swaps to hedge the
sales price risk of certain steel products. Our hedging strategy is to reduce the effect on earnings from the price volatility of these various exposures.
Our commodity purchase swaps and sales swaps are designated as cash flow hedges for accounting purposes, and we record the gains and losses for the derivatives in Accumulated other comprehensive income until we reclassify them into Cost of goods sold when we recognize the associated underlying operating costs or Revenues when we recognize the associated underlying sale. Impacts of our designated commodity purchase swaps and sales swaps are reflected within Other, net in the Statements of Unaudited Condensed Consolidated Cash Flows. Refer to NOTE 15 - ACCUMULATED OTHER COMPREHENSIVE INCOME for further information.
Our commodity purchase swaps and sales swaps are classified as Level 2 as values were determined using a market approach based upon quoted prices for similar assets in active markets or other inputs that were observable.
The following table presents the notional amount of our outstanding hedge contracts:
| | | | | | | | | | | | | | | | | | | | | | | | | | | | | | | | |
| | | | | | | | Notional Amount |
| Hedge Contract Type | | Classification | | Unit of Measure | | Maturity Dates | | June 30,
2025 | | December 31,
2024 |
| Natural Gas | | Commodity purchase swaps | | MMBtu | | July 2025 - May 2028 | | 112,900,000 | | | 143,250,000 | |
| Electricity | | Commodity purchase swaps | | Megawatt hours | | July 2025 - July 2028 | | 2,583,822 | | | 3,224,227 | |
| HRC | | Sales swaps | | Net tons | | July 2025 - August 2025 | | 91,800 | | | — | |
At June 30, 2025, we estimate $11 million of net losses related to our commodity purchase swaps and $7 million of net losses related to our sales swaps will be reclassified from Accumulated other comprehensive income into Cost of goods sold and Revenues, respectively, during the next 12 months. These estimates are based on June 30, 2025 fair values, some of which will change before their actual reclassification into Cost of goods sold and Revenues.
The following table presents the fair value of our outstanding cash flow hedges and the classification in the Statements of Unaudited Condensed Consolidated Financial Position:
| | | | | | | | | | | |
| Balance Sheet Location (In millions) | June 30,
2025 | | December 31,
2024 |
| Other current assets | $ | 17 | | | $ | 5 | |
| Other non-current assets | 19 | | | 9 | |
| Other current liabilities | (14) | | | (41) | |
| Other non-current liabilities | — | | | (6) | |
NOTE 14 - CAPITAL STOCK
SHARE REPURCHASE PROGRAM
During the first quarter of 2024, we fully utilized the remaining portion of our prior $1 billion share repurchase program, which was approved by our Board of Directors on February 10, 2022. During the second quarter of 2024, our Board of Directors authorized a new program to repurchase our outstanding common shares in the open market or in privately negotiated transactions, which may include purchases pursuant to Rule 10b5-1 plans or accelerated share repurchases, up to a maximum of $1.5 billion. We are not obligated to make any repurchases, and the program may be suspended or discontinued at any time. The share repurchase program does not have a specific expiration date.
During the three and six months ended June 30, 2025, we did not repurchase any common shares. During the three and six months ended June 30, 2024, we repurchased 7.5 million and 37.9 million common shares, respectively, at an aggregate cost of $124 million and $733 million, respectively, excluding any excise tax due under the Inflation Reduction Act of 2022. As of June 30, 2025, there was $1.4 billion remaining authorization under our active share repurchase program.
PREFERRED STOCK
We have 3 million shares of Serial Preferred Stock, Class A, without par value, authorized and 4 million shares of Serial Preferred Stock, Class B, without par value, authorized. No preferred shares are issued or outstanding.
STELCO ACQUISITION
As more fully described in NOTE 3 - ACQUISITIONS, we completed the Stelco Acquisition on November 1, 2024. At closing, each Stelco shareholder received CAD $60.00 in cash and 0.454 shares of Cliffs common stock per share of Stelco common stock. Additionally, Stelco equity award holders received CAD $60.00 in cash and 0.454 shares of Cliffs common stock per outstanding restricted share unit and deferred share unit. As a result of the Stelco Acquisition, we issued a total of 25.9 million Cliffs treasury shares at a fair value of $343 million.
NOTE 15 - ACCUMULATED OTHER COMPREHENSIVE INCOME
The components of Accumulated other comprehensive income within Cliffs shareholders’ equity and related tax effects allocated to each are shown below:
| | | | | | | | | | | | | | | | | | | | | | | |
| Three Months Ended
June 30, | | Six Months Ended
June 30, |
| (In millions) | 2025 | | 2024 | | 2025 | | 2024 |
| Foreign Currency Translation | | | | | | | |
| Beginning balance | $ | (69) | | | $ | (1) | | | $ | (70) | | | $ | — | |
| Other comprehensive income (loss) before reclassifications | 108 | | | — | | | 109 | | | (1) | |
| Income tax | (6) | | | — | | | (6) | | | — | |
| Other comprehensive income (loss) before reclassifications, net of tax | 102 | | | — | | | 103 | | | (1) | |
| Ending balance | $ | 33 | | | $ | (1) | | | $ | 33 | | | $ | (1) | |
| | | | | | | |
| Derivative Instruments | | | | | | | |
| Beginning balance | $ | 48 | | | $ | (150) | | | $ | (53) | | | $ | (170) | |
| Other comprehensive income (loss) before reclassifications | (93) | | | 2 | | | 8 | | | (31) | |
| Income tax | 22 | | | — | | | (2) | | | 8 | |
| Other comprehensive income (loss) before reclassifications, net of tax | (71) | | | 2 | | | 6 | | | (23) | |
Losses (gains) reclassified from AOCI to net income (loss)1 | 34 | | | 61 | | | 66 | | | 120 | |
Income tax expense (benefit)2 | (8) | | | (16) | | | (16) | | | (30) | |
| Net losses (gains) reclassified from AOCI to net income (loss) | 26 | | | 45 | | | 50 | | | 90 | |
| Ending balance | $ | 3 | | | $ | (103) | | | $ | 3 | | | $ | (103) | |
| | | | | | | |
| Pension and OPEB | | | | | | | |
| Beginning balance | $ | 1,633 | | | $ | 1,799 | | | $ | 1,660 | | | $ | 1,827 | |
Gains reclassified from AOCI to net income (loss)3 | (34) | | | (39) | | | (69) | | | (77) | |
Income tax expense2 | 9 | | | 10 | | | 17 | | | 20 | |
| Net gains reclassified from AOCI to net income (loss) | (25) | | | (29) | | | (52) | | | (57) | |
| Ending balance | $ | 1,608 | | | $ | 1,770 | | | $ | 1,608 | | | $ | 1,770 | |
| | | | | | | |
| Total AOCI Ending Balance | $ | 1,644 | | | $ | 1,666 | | | $ | 1,644 | | | $ | 1,666 | |
| | | | | | | |
1 Amounts recognized in Revenues and Cost of goods sold for sales swaps and commodity purchase swaps, respectively, within the Statements of Unaudited Condensed Consolidated Operations. |
2 Amounts recognized in Income tax benefit in the Statements of Unaudited Condensed Consolidated Operations. |
3 Amounts recognized in Net periodic benefit credits other than service cost component in the Statements of Unaudited Condensed Consolidated Operations. |
NOTE 16 - VARIABLE INTEREST ENTITIES
SUNCOKE MIDDLETOWN
We purchase all the coke and electrical power generated from SunCoke Middletown’s plant under long-term supply agreements and have committed to purchase all the expected production from the facility through 2032. We consolidate SunCoke Middletown as a VIE because we are the primary beneficiary despite having no ownership interest in SunCoke Middletown. SunCoke Middletown had income before income taxes of $14 million and $29 million for the three and six months ended June 30, 2025, respectively, compared to $9 million and $24 million for the three and six months ended June 30, 2024, respectively, that was included in our consolidated Loss before income taxes. Additionally, SunCoke Middletown had cash used for capital expenditures of a nominal amount for each of the three and six months ended June 30, 2025, compared to $8 million and $12 million for the three and six months ended June 30, 2024, respectively, that are included in our consolidated Purchase of property, plant and equipment on the Statements of Unaudited Condensed Consolidated Cash Flows.
The assets of the consolidated VIE can only be used to settle the obligations of the consolidated VIE and not obligations of the Company. The creditors of SunCoke Middletown do not have recourse to the assets or general credit of the Company to satisfy liabilities of the VIE. The Statements of Unaudited Condensed Consolidated Financial Position includes the following amounts for SunCoke Middletown:
| | | | | | | | | | | |
| (In millions) | June 30,
2025 | | December 31,
2024 |
| | | |
| Inventories | $ | 32 | | | $ | 27 | |
| Property, plant and equipment, net | 279 | | | 288 | |
| Accounts payable | (18) | | | (19) | |
| Other assets (liabilities), net | (53) | | | (47) | |
| Noncontrolling interests | (240) | | | (249) | |
NOTE 17 - EARNINGS PER SHARE
The following table summarizes the computation of basic and diluted EPS:
| | | | | | | | | | | | | | | | | | | | | | | |
| Three Months Ended
June 30, | | Six Months Ended
June 30, |
| (In millions, except per share amounts) | 2025 | | 2024 | | 2025 | | 2024 |
| Net income (loss) | $ | (470) | | | $ | 9 | | | $ | (953) | | | $ | (44) | |
| Net income attributable to noncontrolling interests | (13) | | | (7) | | | (25) | | | (21) | |
| Net income (loss) attributable to Cliffs shareholders | $ | (483) | | | $ | 2 | | | $ | (978) | | | $ | (65) | |
| | | | | | | |
| Weighted average number of shares: | | | | | | | |
| Basic | 495 | | | 473 | | | 495 | | 483 |
Employee stock plans1 | — | | | 1 | | | — | | — |
| Diluted | 495 | | | 474 | | | 495 | | 483 |
| | | | | | | |
| Earnings (loss) per common share attributable to Cliffs shareholders: | | | | | | | |
| Basic | $ | (0.97) | | | $ | 0.00 | | | $ | (1.97) | | | $ | (0.13) | |
| Diluted | $ | (0.97) | | | $ | 0.00 | | | $ | (1.97) | | | $ | (0.13) | |
| | | | | | | |
1 For the three and six months ended June 30, 2025, 4 million and 2 million potentially dilutive shares, respectively, were excluded from the computation of diluted earnings per share because their effect would have been anti-dilutive. For both the three and six months ended June 30, 2024, 2 million potentially dilutive shares were excluded from the computation of diluted earnings per share because their effect would have been anti-dilutive. |
NOTE 18 - COMMITMENTS AND CONTINGENCIES
PURCHASE COMMITMENTS
We purchase portions of the principal raw materials required for our steel manufacturing operations under annual and multi-year agreements, some of which have minimum quantity requirements. We also use large volumes of natural gas, electricity and industrial gases in our operations. We negotiate most of our purchases of chrome, industrial gases and a portion of our electricity under multi-year agreements. Our purchases of coke and iron ore are made under annual or multi-year agreements with periodic price adjustments. We typically purchase coal under annual fixed price agreements. We also purchase certain transportation services under multi-year contracts with minimum quantity requirements.
OTHER COMMERCIAL COMMITMENTS
We use surety bonds and letters of credit to provide financial assurance for certain obligations and statutory requirements. As of June 30, 2025, we had $268 million of surety-backed letters of credit and surety bonds outstanding. Additionally, as of June 30, 2025, we had $63 million of outstanding letters of credit issued under our ABL Facility.
CONTINGENCIES
We are currently the subject of, or party to, various claims and legal proceedings incidental to our current and historical operations. These claims and legal proceedings are subject to inherent uncertainties and unfavorable rulings could occur. An unfavorable ruling could include monetary damages, additional funding requirements or an injunction. If an unfavorable ruling were to occur, there exists the possibility of a material adverse effect on our financial position and results of operations for the period in which the ruling occurs or future periods. However, based on currently available information, we do not believe that any pending claims or legal proceedings will result in a material adverse effect in relation to our consolidated financial statements.
ENVIRONMENTAL CONTINGENCIES
Our environmental remediation obligations for known environmental matters at active and closed operations have been recognized based on estimates of the cost of investigation and remediation at each facility. We cannot predict the ultimate costs for each site with certainty because of the evolving nature of the investigation and remediation process. Rather, to estimate the probable costs, we must make certain assumptions. The most significant of these assumptions is for the nature and scope of the work that will be necessary to investigate and remediate a particular site and the cost of that work. Other significant assumptions include the cleanup technology that will be used, whether and to what extent any other parties will participate in paying the investigation and remediation costs, reimbursement of past response costs and future oversight costs by governmental agencies, and the reaction of the governing environmental agencies to the proposed work plans. Costs for future investigation and remediation are not discounted to their present value, unless the amount and timing of the cash disbursements are readily known. To the extent that we have been able to reasonably estimate future liabilities, we do not believe that there is a reasonable possibility that we will incur a loss or losses that exceed the amounts we accrued that would, either individually or in the aggregate, have a material adverse effect on our consolidated financial condition, results of operations or cash flows. However, since we recognize amounts in the consolidated financial statements in accordance with GAAP that exclude potential losses that are not probable or that may not be currently estimable, the ultimate costs of these environmental matters may be higher than the liabilities we currently have recorded in our consolidated financial statements.
Pursuant to RCRA, which governs the treatment, handling and disposal of hazardous waste, the EPA and authorized state environmental agencies may conduct inspections of RCRA-regulated facilities to identify areas where there have been releases of hazardous waste or hazardous constituents into the environment and may order the facilities to take corrective action to remediate such releases. Likewise, the EPA or the states may require closure or post-closure care of residual, industrial and hazardous waste management units. Environmental regulators have the authority to inspect all of our facilities. While we cannot predict the future actions of these regulators, it is possible that they may identify conditions in future inspections of these facilities that they believe require corrective action.
Pursuant to CERCLA, the EPA and state environmental authorities have conducted site investigations at some of our facilities and other third-party facilities, portions of which previously may have been used for disposal of materials that are currently regulated. The results of certain of these investigations remain pending, and we could be directed to spend funds for remedial activities at the former disposal areas. Because of the uncertain status of these investigations, however, we cannot reasonably predict whether or when such spending might be required or its magnitude.
In addition to the foregoing matters, we are or may be involved in proceedings with various regulatory authorities that may require us to pay fines, comply with more rigorous standards or other requirements, or incur capital and operating expenses for environmental compliance. We believe that the ultimate disposition of any such proceedings will not have, individually or in the aggregate, a material adverse effect on our consolidated financial condition, results of operations or cash flows.
TAX MATTERS
The calculation of our tax liabilities involves dealing with uncertainties in the application of complex tax regulations. We recognize liabilities for anticipated tax audit issues based on our estimate of whether, and the extent to which, additional taxes will be due. If we ultimately determine that payment of these amounts is unnecessary, we reverse the liability and recognize a tax benefit during the period in which we determine that the liability is no longer necessary. We also recognize tax benefits to the extent that it is more likely than not that our positions will be sustained when challenged by the taxing authorities. To the extent we prevail in matters for which liabilities have been established, or are required to pay amounts in excess of our liabilities, our effective tax rate in a given period could be materially affected. An unfavorable tax settlement would require use of our cash and result in an increase in our effective tax rate in the year of resolution. A favorable tax settlement would be recognized as a reduction in our effective tax rate in the year of resolution. Refer to NOTE 10 - INCOME TAXES for further information.
OTHER CONTINGENCIES
In addition to the matters discussed above, there are various pending and potential claims against us and our subsidiaries involving antitrust, product liability, personal injury, commercial, employee benefits and other matters arising in the ordinary course of business. Because of the considerable uncertainties that exist for any claim, it is difficult to reliably or accurately estimate what the amount of a loss would be if a claimant prevails. If material assumptions or factual understandings we rely on to evaluate exposure for these contingencies prove to be inaccurate or otherwise change, we may be required to record a liability for an adverse outcome. If, however, we have reasonably evaluated potential future liabilities for all of these contingencies, including those described more specifically above, it is our opinion, unless we otherwise noted, that the ultimate liability from these contingencies, individually or in the aggregate, should not have a material adverse effect on our consolidated financial position, results of operations or cash flows.
NOTE 19 - SUBSEQUENT EVENTS
We have evaluated subsequent events through the date of financial statement issuance.
| | |
|
| ITEM 2. MANAGEMENT'S DISCUSSION AND ANALYSIS OF FINANCIAL CONDITION AND RESULTS OF OPERATIONS |
Management's Discussion and Analysis of Financial Condition and Results of Operations is designed to provide a reader of our financial statements with a narrative from the perspective of management on our financial condition, results of operations, liquidity and other factors that may affect our future results. We believe it is important to read our Management's Discussion and Analysis of Financial Condition and Results of Operations in conjunction with our Annual Report on Form 10-K for the year ended December 31, 2024, as well as other publicly available information.
OVERVIEW
We are a leading North America-based steel producer with focus on value-added sheet products, particularly for the automotive industry. We are vertically integrated from the mining of iron ore, production of pellets and direct reduced iron, and processing of ferrous scrap through primary steelmaking and downstream finishing, stamping, tooling, and tubing. Headquartered in Cleveland, Ohio, we employ approximately 30,000 people across our operations in the United States and Canada.
FINANCIAL SUMMARY
The following is a summary of our consolidated results for the three and six months ended June 30, 2025 and 2024 (in millions, except for diluted EPS):
| | | | | | | | | | | | | | | | | | | | |
| Total Revenue | | Net Income (loss) | | Adjusted EBITDA | | Diluted EPS |
See "— Non-GAAP Financial Measures" below for a reconciliation of our Net income (loss) to Adjusted EBITDA.
ECONOMIC OVERVIEW
STEEL MARKET OVERVIEW
We continued to navigate volatile but improving market conditions throughout the second quarter of 2025. Steel market conditions in the second quarter of 2025 benefited from higher HRC pricing and lower import levels, but demand remained impacted by weak light vehicle production and inconsistent buying behavior from customers. The price for domestic HRC, the most significant index impacting our revenues and profitability, averaged $910 per net ton during the second quarter of 2025, 16% higher than the second quarter of 2024. Finished steel import levels declined in the second quarter of 2025 after being elevated in early 2025 in anticipation of the recently implemented steel tariffs, which helped support domestic steel pricing. Looking forward, we expect domestic steel demand to grow, as recently implemented steel and automotive tariffs support demand for domestically produced steel, other end-user demand improves, and incremental steel demand stimulated by recent government legislation and manufacturing on-shoring is realized. Steel and light vehicles remain at the top of the Trump administration's trade agenda, and we are at the intersection of both of these industries.
We believe that steel tariffs play a crucial role in protecting the U.S. economy, national security and industrial base from violators of fair trade. The steel industry has long faced significant challenges due to overcapacity and overproduction of steel beyond certain countries' domestic needs, along with other unfair trade practices. The overproduction by certain countries results in dumping of steel in the U.S. at below market value. The U.S. remains the only major steel-producing country that produces less steel than it consumes. Additionally, foreign steel producers often take advantage of government subsidies, currency manipulation and weak environmental regulations. Furthermore, there is an overall lack of foreign countries holding their own steel producers accountable for unfair trade practices. We believe that the steel tariffs recently implemented by President Trump are critical to addressing global overproduction issues, confronting unfair trade practices and supporting a healthy domestic steel market. As a leading domestic steel producer, we expect to benefit for years to come from the recently implemented tariffs, not only for steel but also for the automotive industry.
During 2025, to appropriately respond to market conditions and to optimize our footprint, we made the decision to fully or partially idle six of our operations. As a consequence of continued weak automotive production, we made the decision to idle our blast furnace, BOF steel shop, and continuous casting facilities at our Dearborn Works facility. We also made the decision to idle Conshohocken, Riverdale and Steelton due to financial underperformance at these operations. Additionally, we made the decision to idle the Minorca mine and partially idle the Hibbing Taconite mine in order to consume excess pellet inventory produced in 2024.
These operational changes allow us to streamline our operations and enhance efficiency, with minimal expected impact to our flat-rolled steel output.
OTHER KEY DRIVERS
The largest market for our steel products is the automotive industry in North America, which makes light vehicle production a key driver of demand. North American light vehicle production in the second quarter of 2025 was approximately 4.0 million units, down from approximately 4.1 million units in the second quarter of 2024. During the second quarter of 2025, light vehicle sales in the U.S. saw an average seasonally adjusted annualized rate of 16.1 million units sold, representing a 3% increase compared to the second quarter of 2024. The seasonally adjusted annualized rate reached 17.3 million units sold during the second quarter of 2025, indicating healthy consumer demand. Additionally, the average age of light vehicles on the road in the U.S. is at an all-time high of 12.8 years, surpassing the previous record set in 2024, which should support demand as older vehicles need to be replaced. Furthermore, we expect the recently implemented 25% tariff on imports of automobiles and certain automobile parts to lead to increased demand for domestically produced vehicles that consume domestically made steel. As a leading supplier of automotive-grade steel in the U.S., we expect to benefit from healthier domestic vehicle production over the coming years as we continue to be an established and reliable supplier.
Since 2021, the price for busheling scrap, a necessary input for flat-rolled steel production in EAFs in the U.S., has continued to average well above the prior annual ten-year average of approximately $400 per long ton. The busheling price averaged $466 per long ton during the second quarter of 2025, representing a 9% increase compared to the second quarter of 2024. We expect the supply of busheling scrap to further tighten due to decreasing prime scrap generation from original equipment manufacturers as they improve their production efficiency, the growth of EAF capacity in the U.S., reduced metallics imports due to recently announced tariffs on all Brazilian imports, potential for higher prices as a result of tariffs, and a push for expanded scrap use globally. As we are fully integrated and have primarily a blast furnace footprint, increased prices for busheling scrap in the U.S. bolster our competitive advantage, as we source the majority of our iron feedstock from our stable-cost mining and pelletizing operations in Minnesota and Michigan.
COMPETITIVE STRENGTHS
As a leading North America-based steel producer, we benefit from having the size and scale necessary in a competitive, capital intensive business. We have a unique vertically integrated profile from mined raw materials, direct reduced iron, and ferrous scrap to primary steelmaking and downstream finishing, stamping, tooling and tubing. This positioning gives us more predictable costs throughout our supply chain and more control over both our manufacturing inputs and our end-product destination.
One of our most critical strengths that differentiates us from others in our industry is a unique and powerful partnership with our unionized workforce, particularly the USW. With over 20,000 employees subject to collective bargaining agreements, our strong and productive labor relationships are key to our long-term success and allow us to work together in achieving our goals. A clear example of the strength of our relationship is how we partner together to fight against dumped and illegally subsidized imported steel products. Our deep alignment with our represented employees is also recognized by our political leaders, who often publicly support us as a significant employer of a unionized workforce with a track record of working to maintain and increase middle class jobs.
Our primary competitive strength lies within our automotive steel business. We are a leading supplier of automotive-grade steel in the U.S. Compared to other steel end markets, automotive steel is generally higher quality, more operationally and technologically intensive to produce, and requires significantly more devotion to customer service than other steel end markets. This dedication to service and the infrastructure in place to meet our automotive customers’ demanding needs took decades to develop. We have continued to invest capital and resources to meet the requirements needed to serve the automotive industry. We continue to be an established and reliable supplier of automotive-grade steel and intend to bolster our position as an industry leader going forward.
Due to its demanding nature, the automotive steel business typically generates higher through-the-cycle margins, making it a desirable end market. Demand for our automotive-grade steel is expected to be healthier in the coming years as a result of government support for domestically produced vehicles, low unemployment rate, declining interest rates and the replacement of older vehicles. As an established and reliable supplier of domestically produced automotive-grade steel, we expect customers to continue to look to us to serve increased demand in the coming years.
Since becoming a steel company in 2020, we have dedicated significant resources to maintain and upgrade our facilities and equipment. The quality of our assets gives us a unique advantage in product offerings and operational efficiencies. After elevated spend in 2022 to perform overdue maintenance work at the facilities acquired as part of our 2020 acquisitions, we resumed normalized levels of maintenance capital and operating expenses in 2023, which continued throughout 2024 and into 2025. The necessary resources that we have invested in our footprint are expected to keep our assets at an automotive-grade level of quality and reliability for years to come.
Our utilization of fixed price contracts provides us a competitive advantage, as the steel industry is often viewed as volatile and subject to the market price of steel. Our fixed price contracts mitigate pricing volatility through the cycle. Approximately 30-35% of our volumes are sold under these contracts.
Our ability to source our primary feedstock domestically, and primarily internally, is a competitive strength. This model reduces our exposure to volatile pricing and unreliable global sourcing. The ongoing conflict between Russia and Ukraine, along with recently announced tariffs impacting Brazilian pig iron, and the Trump administration's focus on U.S. manufactured products, has displayed the importance of our North American-centric footprint, as our competitors primarily operating EAF facilities rely on imported pig iron, mostly from Brazil, to produce flat-rolled steel, the supply of which is expected to be disrupted. Additionally, the outcome of
ongoing trade discussions could result in additional tariffs on imported pig iron and other raw materials that could further elevate the cost structure for our competitors who import raw materials. The best example is our legacy business of producing iron ore pellets. By internally sourcing the vast majority of our iron ore pellet requirements, our primary steelmaking raw material feedstock can be secured at a stable and predictable cost and not be subject to as many factors outside of our control.
We believe we offer the most comprehensive flat-rolled steel product selection in the industry, along with several complementary products and services. A sampling of our offering includes advanced high-strength steel, hot-dipped galvanized, aluminized, galvalume, electrogalvanized, galvanneal, HRC, cold-rolled coil, plate, GOES, NOES, stainless steels, tool and die, stamped components, slab and cast ingot. Across the quality spectrum and the supply chain, our customers can frequently find the solutions they need from our product selection.
We are a leading producer of electrical steels referred to as GOES and NOES in the U.S., which we believe will be critical for the modernization of the electrical grid and the infrastructure needed to allow for increased electric vehicle adoption, both of which require electrical steels. Distribution transformers are critical to the maintenance and expansion of America’s electric grid. Transformers are in short supply, and that shortage stifles economic growth across the country. The shortage will continue to be exacerbated by the widespread adoption of Artificial Intelligence in virtually all sectors of the economy, which will exponentially increase the consumption of electricity in the U.S. and worldwide. Because of these industry dynamics and our current customer base, our electrical steel business is expected to continue to achieve strong profitability in the coming years.
We are the first and the only producer of HBI in the Great Lakes region. From our Toledo, Ohio facility, we produce a high-quality, low-cost and low-carbon intensive HBI product that can be used in our blast furnaces as a productivity enhancer, or in our BOFs and EAFs as a premium scrap alternative. We use HBI to stretch our hot metal production, lowering carbon intensity and reliance on coke. With increasing tightness in the scrap and metallics markets combined with our own internal needs, we expect our Toledo direct reduction plant to continue to support our operational efficiency going forward. The unique value of our HBI facility is even more evident as recent trade discussions could result in tariffs on pig iron or other imported raw materials for competitors who rely on international suppliers.
STRATEGY
MAXIMIZE OUR COMMERCIAL STRENGTHS
We offer a full suite of flat steel products encompassing effectively all of our customers' needs. We are a leading supplier to the automotive sector, where our portfolio of high-end products delivers a broad range of differentiated solutions for this highly sought after customer base. As an established and reliable supplier of domestically produced automotive-grade steel, we expect to bolster our position as an industry leader going forward.
Our unique capabilities, driven by our portfolio of assets and technical expertise, give us an advantage in our flat-rolled product offering. We offer products that have superior formability, surface quality, strength and corrosion resistance for the automotive industry. In addition, our state-of-the-art Research and Innovation Center in Middletown, Ohio gives us the ability to collaborate with our customers and create new products and develop new and efficient steel manufacturing processes.
Our five-year contract to supply semi-finished steel slabs that was initiated in connection with the closing of the acquisition of ArcelorMittal USA concludes in December 2025. This has historically represented approximately 10 percent of our sales volume and has recently become unprofitable as a result of current market conditions. The conclusion of this contract provides a significant opportunity to shift sales and product mix to higher margin business and improve efficiency within our operations.
SUPPORT DOMESTICALLY PRODUCED AUTOMOTIVE SALES
On March 7, 2025, we announced a "Buy American" incentive program for all of our employees in an effort to support President Trump's long-term vision of bringing manufacturing back to the U.S. Under this program, any Cliffs employee who purchases or leases a new American-built vehicle in 2025 with substantial Cliffs steel content will receive a $1,000 cash bonus in connection with the purchase or lease. As the domestic automotive market has long been undermined by excessive imports, we are proud to play a role in encouraging the purchase of domestically produced vehicles. Since the program's inception, feedback has been extremely positive, and employees have been very enthusiastic about the opportunity to support the sale of domestically produced vehicles.
We continue to work with our automotive partners to ensure the availability of domestically produced, automotive-grade steel. With the recently announced automotive tariffs, we expect to see an increase in demand for domestically produced vehicles, which should result in an increase in production of vehicles in the U.S. As a leading supplier of automotive-grade steel, we expect to benefit from increased production of vehicles in the U.S. over the coming years.
OPTIMIZE OUR FULLY-INTEGRATED STEELMAKING FOOTPRINT
We are a fully-integrated steel enterprise with an expansive footprint providing the opportunity to achieve healthy margins for flat-rolled steel throughout the business cycle. Our focus remains on realizing our inherent cost advantage in flat-rolled steel while continuing to optimize our footprint. The combination of our ferrous raw materials, including iron ore, scrap and HBI, allows us to do so relative to peers who must rely on more unpredictable and unreliable raw material sourcing strategies.
We have ample access to scrap, along with internally sourced iron ore pellets and HBI. Our ability to optimize use of these raw materials in our blast furnaces and BOFs ultimately boosts liquid steel output, reduces coke needs and lowers carbon emissions from our operations.
During 2025, we made the decision to fully or partially idle six of our operations. We made the decision to idle our blast furnace, BOF steel shop, and continuous casting facilities at our Dearborn Works facility. We also made the decision to idle Conshohocken, Riverdale and Steelton due to underperformance at these operations. Additionally, we made the decision to idle the Minorca mine and partially idle the Hibbing Taconite mine in order to consume excess pellet inventory produced in 2024. Our recent changes allow us to streamline our operations and enhance efficiency, with minimal impact to our flat-rolled steel output.
During the second quarter of 2025, we announced the commissioning of our new state-of-the-art vertical stainless bright anneal line at our Coshocton Works facility in Coshocton, Ohio. The $150 million capital investment will supply premium stainless steel for high-end automotive and critical appliance applications. The new annealing line uses a 100% hydrogen atmosphere, replacing the conventional acid-based processing, and includes a hydrogen recovery unit to recycle hydrogen and use a 50/50 mix of new and used hydrogen in the process. This new line is expected to improve efficiency and the quality of our products at Coshocton Works.
CAPTURE SYNERGIES FROM RECENT ACQUISITIONS
On November 1, 2024, we completed the Stelco Acquisition. The Stelco Acquisition confirms our commitment and leadership in integrated steel production in North America and strengthens our cost position by incorporating one of the lowest cost flat-rolled steelmaking assets in North America within our footprint. The Stelco Acquisition expands our existing presence in Canada and diversifies our customer base in Canada across service centers, construction and other industrial end markets with higher volumes of spot sales. As a result of the Stelco Acquisition, our exposure to the North American spot market has doubled, giving us further insight into spot market dynamics and diversifying our customer base toward spot customers.
We have demonstrated a consistent track record of exceeding our initial synergy estimates associated with value-enhancing transactions through mergers and acquisitions. Significant synergy opportunities from the Stelco Acquisition have been identified, including asset and capital expenditure optimization, procurement savings, selling, general and administrative expenses, duplicative public company costs and other opportunities. With our proven ability to integrate acquired assets and capture synergies, along with our powerful partnership with our union and non-union employees, we are confident in our ability to achieve identified synergies related to the Stelco Acquisition.
ENHANCE OUR ENVIRONMENTAL SUSTAINABILITY
We remain committed to operating our business in a more sustainable manner. In May 2024, we announced our commitment to achieve new GHG emissions reduction targets after we successfully achieved our prior commitment set in 2021 to reduce Scope 1 (direct emissions) and Scope 2 (indirect emissions from purchased electricity or other forms of energy) GHG emissions by 25% by 2030, relative to 2017 levels, well ahead of our 2030 target year. Our new goals set forth below, relative to 2023 levels, include:
•A target to reduce Scope 1 and 2 GHG emissions intensity per metric ton of crude steel by 30% by 2035;
•A target to reduce material upstream Scope 3 GHG emissions intensity per metric ton of crude steel by 20% by 2035; and
•A long-term target aligned with the Paris Agreement’s 1.5 degrees Celsius scenario to reduce Scope 1, 2 and material upstream 3 emissions intensity per metric ton of crude steel to near net zero by 2050.
We have made significant progress in reducing our emissions on a per ton basis. Since 2020, we have reduced our average Scope 1 and 2 emissions of integrated mills from 1.82 to 1.58 metric tons of CO2e per metric ton of crude steel produced in 2024, which is 27% lower than the global industry average.
MAINTAIN FINANCIAL FLEXIBILITY
Given the cyclicality of our business, it is important to us to be in the financial position to easily withstand economic cycles and be opportunistic when attractive strategic opportunities arise. Since becoming a steel company in 2020, we have demonstrated our ability to generate healthy free cash flow and use it to reduce substantial amounts of debt, return capital to shareholders through share repurchases and make investments to both improve and grow our business.
We have a track record of demonstrating that we can quickly deleverage our balance sheet and have also historically shown our ability to take advantage of volatility in the debt markets and repurchase notes at a discount. We expect to generate healthy free cash flow in the coming years and intend to utilize it to deleverage our balance sheet. We also maintain a long maturity runway with our outstanding debt, with our nearest maturities coming in 2027, have healthy liquidity, and have approximately $3.2 billion of secured debt capacity, which supports our flexibility to navigate varied economic environments for extended periods of time.
STEELMAKING RESULTS
The following is a summary of our Steelmaking segment operating results, net of intersegment eliminations, for the three and six months ended June 30, 2025 and 2024 (dollars in millions, except for average selling price, and shipments in thousands of net tons):
| | | | | | | | | | | | | | | | | | | | |
| Total Revenue | | Gross Margin | | Adjusted EBITDA | | Steel Shipments (nt) |
| | | | | | | | | | | | | | | | | | | | | | | | | | | | | | | | | | | | | | | | | | | | | | | | | | | | | | | | |
| Q2 2025 | Q2 2024 | YTD 2025 | YTD 2024 | | Q2 2025 | Q2 2024 | YTD 2025 | YTD 2024 | | Q2 2025 | Q2 2024 | YTD 2025 | YTD 2024 | | Q2 2025 | Q2 2024 | YTD 2025 | YTD 2024 |
| | | | | | | | | | | | | | |
| STEEL PRODUCT REVENUE: | | GROSS MARGIN %: | | ADJUSTED EBITDA %: | | AVERAGE SELLING PRICE PER TON OF STEEL PRODUCTS: |
| $4,354 | $4,487 | $8,410 | $9,116 | | (5)% | 3% | (7)% | 4% | | 2% | 6% | (1)% | 7% | | $1,015 | $1,125 | $998 | $1,150 |
REVENUES
The following tables represent our steel shipments by product and total revenues by market:
| | | | | | | | | | | | | | | | | | | | | | | | | | | | | | | | | | | |
| Three Months Ended
June 30, | | Six Months Ended
June 30, |
| (In thousands of net tons) | 2025 | | 2024 | | % Change | | 2025 | | 2024 | | % Change |
| Steel shipments by product: | | | | | | | | | | | |
| Hot-rolled steel | 1,727 | | | 1,393 | | | 24 | % | | 3,420 | | | 2,659 | | | 29 | % |
| Cold-rolled steel | 627 | | | 632 | | | (1) | % | | 1,235 | | | 1,295 | | | (5) | % |
| Coated steel | 1,142 | | | 1,171 | | | (2) | % | | 2,265 | | | 2,387 | | | (5) | % |
| Stainless and electrical steel | 135 | | | 151 | | | (11) | % | | 277 | | | 296 | | | (6) | % |
| Plate | 217 | | | 207 | | | 5 | % | | 420 | | | 408 | | | 3 | % |
| Slab and other steel products | 442 | | | 435 | | | 2 | % | | 813 | | | 884 | | | (8) | % |
| Total steel shipments by product | 4,290 | | | 3,989 | | | 8 | % | | 8,430 | | | 7,929 | | | 6 | % |
| | | | | | | | | | | |
| Three Months Ended
June 30, | | Six Months Ended
June 30, |
| (In millions) | 2025 | | 2024 | | % Change | | 2025 | | 2024 | | % Change |
| Steelmaking revenues by market: | | | | | | | | | | | |
| Direct automotive | $ | 1,249 | | | $ | 1,460 | | | (14) | % | | $ | 2,546 | | | $ | 3,077 | | | (17) | % |
| Infrastructure and manufacturing | 1,489 | | | 1,421 | | | 5 | % | | 2,843 | | | 2,813 | | | 1 | % |
| Distributors and converters | 1,433 | | | 1,402 | | | 2 | % | | 2,661 | | | 2,814 | | | (5) | % |
| Steel producers | 600 | | | 632 | | | (5) | % | | 1,188 | | | 1,238 | | | (4) | % |
| Total Steelmaking revenues by market | $ | 4,771 | | | $ | 4,915 | | | (3) | % | | $ | 9,238 | | | $ | 9,942 | | | (7) | % |
Revenues decreased by 3% during the three months ended June 30, 2025, as compared to the prior-year period, primarily due to:
•A decrease of $211 million, or 14%, in revenues from the direct automotive market, predominantly due to a decrease in demand; which was partially offset by
•An increase in revenues related to incremental tons sold related to the addition of Stelco.
Revenues decreased by 7% during the six months ended June 30, 2025, as compared to the prior-year period, primarily due to:
•A decrease of $531 million, or 17%, in revenues from the direct automotive market, predominantly due to a decrease in demand; and
•A decrease of $153 million, or 5%, in revenues from the distributors and converters market, predominantly due to a decrease in average selling price; which was partially offset by
•An increase in revenues related to incremental tons sold related to the addition of Stelco.
GROSS MARGIN
Gross margin decreased by $370 million during the three months ended June 30, 2025, as compared to the prior-year period, primarily due to:
•A decrease in average selling price (approximately $200 million impact), predominantly due to lower direct automotive mix. The average selling price was additionally impacted as a result of incremental hot-rolled steel tons sold related to the addition of Stelco; and
•An increase in depreciation expense of approximately $120 million as a result of the indefinite idling of our Conshohocken and Riverdale facilities.
Gross margin decreased by $1,040 million during the six months ended June 30, 2025, as compared to the prior-year period, primarily due to:
•A decrease in average selling price (approximately $700 million impact), predominantly due to lower direct automotive mix and lower index prices. The average selling price was additionally impacted as a result of incremental hot-rolled steel tons sold related to the addition of Stelco;
•An increase in depreciation expense of approximately $120 million as a result of the indefinite idling of our Conshohocken and Riverdale facilities; and
•An increase in idled facilities charges of approximately $60 million as a result of the operational adjustments related to our Hibbing, Minorca and Dearborn facilities.
ADJUSTED EBITDA
Adjusted EBITDA from our Steelmaking segment for the three months ended June 30, 2025, decreased by $225 million, as compared to the three months ended June 30, 2024, primarily due to the decreased gross margin from our operations. Additionally, our Steelmaking Adjusted EBITDA included $130 million and $96 million of Selling, general and administrative expenses for the three months ended June 30, 2025 and 2024, respectively.
Adjusted EBITDA from our Steelmaking segment for the six months ended June 30, 2025, decreased by $804 million, as compared to the six months ended June 30, 2024, primarily due to the decreased gross margin from our operations. Additionally, our Steelmaking Adjusted EBITDA included $256 million and $221 million of Selling, general and administrative expenses for the six months ended June 30, 2025 and 2024, respectively.
RESULTS OF OPERATIONS
REVENUES & GROSS MARGIN
During the three and six months ended June 30, 2025, our consolidated Revenues decreased by $158 million and $728 million, respectively, and our consolidated gross margin decreased by $371 million and $1,047 million, respectively, as compared to the prior-year periods. See "— Steelmaking Results" above for further detail on our operating results.
RESTRUCTURING AND OTHER CHARGES AND ASSET IMPAIRMENT
As a result of the announcements to indefinitely idle two of our non-core Steelmaking assets, we recorded both Restructuring and other charges and Asset impairment. The indefinite idling of our Steelton rail production facility occurred in the second quarter of 2025, while the idling of our Weirton tinplate production facility was announced in the first quarter of 2024.
In connection with these decisions, we recorded $86 million and $89 million of Restructuring and other charges during the three and six months ended June 30, 2025, respectively, and $25 million and $129 million for the three and six months ended June 30, 2024, respectively. Additionally, Asset impairment of $39 million was recorded for both the three and six months ended June 30, 2025, and $15 million and $79 million for the three and six months ended June 30, 2024, respectively.
MISCELLANEOUS - NET
During the three and six months ended June 30, 2025, Miscellaneous – net increased by $14 million and $2 million, respectively, as compared to the prior-year periods. Both the three and six months ended June 30, 2025 included idled facilities charges of $48 million related to the indefinite idling of our Conshohocken and Riverdale facilities. Additionally recorded during these periods, and included within Miscellaneous – net, is approximately $20 million in severance related to a reduction in salaried workforce. These increases were largely offset by increases in miscellaneous income from currency exchange during both the three and six months ended June 30, 2025.
LOSS ON EXTINGUISHMENT OF DEBT
During the six months ended June 30, 2024, we used a portion of the net proceeds from the issuance of the 7.000% 2032 Senior Notes to repurchase $829 million in aggregate principal amount of our 6.750% 2026 Secured Senior Notes, resulting in a $6 million and $27 million of Loss on extinguishment of debt for the three and six months ended June 30, 2024, respectively. During the three and six months ended June 30, 2025, we did not repurchase any outstanding senior notes. Refer to NOTE 8 - DEBT AND CREDIT FACILITIES for further information.
INTEREST EXPENSE, NET
During the three and six months ended June 30, 2025, our consolidated Interest expense, net increased by $80 million and $156 million, respectively, as compared to the prior-year period. This increase is primarily due to an increase in our outstanding borrowings.
INCOME TAXES
Our effective tax rate is impacted by state and foreign income taxes as well as permanent items, such as depletion. It also is affected by discrete items that may occur in any given period but are not consistent from period to period.
During the three and six months ended June 30, 2025, our consolidated Income tax benefit increased by $133 million and $272 million, respectively, as compared to the prior-year period. This increase is primarily due to an increase in Loss before income taxes and the impact of immaterial discrete items relative to those losses.
LIQUIDITY, CASH FLOWS AND CAPITAL RESOURCES
OVERVIEW
Our capital allocation decision-making process is focused on preserving healthy liquidity levels, strengthening our balance sheet, and creating financial flexibility to manage through the cyclical demand for our products and volatility in commodity prices. We are focused on maximizing the cash generation of our operations, reducing debt, and aligning capital investments with our strategic priorities and the requirements of our business plan, including regulatory and permission-to-operate related projects.
The following table provides a summary of our cash flow:
| | | | | | | | | | | |
| Six Months Ended
June 30, |
| (In millions) | 2025 | | 2024 |
| Cash flows provided (used) by: | | | |
| Operating activities | $ | (306) | | | $ | 661 | |
| Investing activities | (256) | | | (331) | |
| Financing activities | 567 | | | (418) | |
| Net increase (decrease) in cash, cash equivalents and restricted cash | $ | 5 | | | $ | (88) | |
| | | |
Free cash flow1 | $ | (570) | | | $ | 322 | |
| | | |
1See "— Non-GAAP Financial Measures" for a reconciliation of our free cash flow. |
CASH FLOWS
OPERATING ACTIVITIES
| | | | | | | | | | | | | | | | | |
| Six Months Ended
June 30, |
| (In millions) | 2025 | | 2024 | | Variance |
| Net loss | $ | (953) | | | $ | (44) | | | $ | (909) | |
| Non-cash adjustments to net loss | 483 | | | 636 | | | (153) | |
| Working capital: | | | | | |
| Accounts receivable, net | (199) | | | 67 | | | (266) | |
| Inventories | 396 | | | 227 | | | 169 | |
| Income taxes | 10 | | | (12) | | | 22 | |
| Pension and OPEB payments and contributions | (73) | | | (62) | | | (11) | |
| Payables, accrued employment and accrued expenses | (3) | | | (176) | | | 173 | |
| Other, net | 33 | | | 25 | | | 8 | |
| Total working capital | 164 | | | 69 | | | 95 | |
| Net cash provided (used) by operating activities | $ | (306) | | | $ | 661 | | | $ | (967) | |
The variance was primarily driven by:
•A $1.1 billion decrease in net loss after adjustments for non-cash items primarily due to lower gross margins resulting from a decrease in selling prices for our steel products as compared to the first half of 2024. See "— Steelmaking Results" above for further detail on our operating results; and
•A $266 million decrease in cash primarily related to increasing average selling prices of our steel products during the first half of 2025 as compared to the end of 2024, resulting in growing accounts receivable balances; which was partially offset by
•A $173 million increase in cash primarily as a result of lower incentive-based compensation paid in the first half of 2025, as compared to the prior-year period; and
•A $169 million increase in cash primarily related to a reduction in raw material inventories, including iron ore pellets and coke, during the first half of 2025.
INVESTING ACTIVITIES
| | | | | | | | | | | | | | | | | |
| Six Months Ended
June 30, | | |
| (In millions) | 2025 | | 2024 | | Variance |
| Purchase of property, plant and equipment | $ | (264) | | | $ | (339) | | | $ | 75 | |
| Other investing activities | 8 | | | 8 | | | — | |
| Net cash used by investing activities | $ | (256) | | | $ | (331) | | | $ | 75 | |
Our capital expenditures primarily relate to sustaining capital spend, which includes infrastructure, mobile equipment, fixed equipment, product quality, environmental, and health and safety spend. Our cash used for capital expenditures during the first half of 2025 was $75 million less as compared to the prior-year period. Included within cash used for capital expenditures was a nominal amount related to our non-owned SunCoke Middletown VIE for the six months ended June 30, 2025, compared to $12 million for the six months ended June 30, 2024.
We anticipate total cash used for capital expenditures during the next 12 months to be approximately $700 million, which primarily consists of sustaining capital spend.
FINANCING ACTIVITIES
| | | | | | | | | | | | | | | | | |
| Six Months Ended
June 30, | | |
| (In millions) | 2025 | | 2024 | | Variance |
| Net proceeds (repayments) of senior notes | $ | 850 | | | $ | (20) | | | $ | 870 | |
| Net borrowings (repayments) under credit facilities | (183) | | | 370 | | | (553) | |
| Repurchase of common shares | — | | | (733) | | | 733 | |
| Other financing activities | (100) | | | (35) | | | (65) | |
| Net cash provided (used) by financing activities | $ | 567 | | | $ | (418) | | | $ | 985 | |
The variance was primarily driven by:
•The repurchase of 37.9 million common shares during the six months ended June 30, 2024, while no shares were repurchased during the six months ended June 30, 2025; and
•A net increase in cash provided from proceeds of senior notes issued and borrowings under the ABL Facility. These proceeds were used for general operational purposes.
LIQUIDITY AND CAPITAL RESOURCES
Our primary sources of liquidity are Cash and cash equivalents, cash generated from our operations, availability under the ABL Facility and access to capital markets. Cash and cash equivalents, which totaled $61 million as of June 30, 2025, include cash on hand and on deposit, as well as short-term securities held for the primary purpose of general liquidity. The combination of cash and availability under our ABL Facility equated to $2.7 billion in liquidity as of June 30, 2025.
On February 6, 2025, we issued $850 million aggregate principal amount of 7.500% Senior Notes due 2031 at par. The net proceeds were used for general corporate purposes, including repayment of borrowings under our ABL Facility. We believe our liquidity and access to capital markets will be adequate to fund our cash requirements for the next 12 months and for the foreseeable future. However, our ability in the future to issue additional notes could be limited by market conditions.
Our ABL Facility, which matures in June 2028, has a maximum borrowing base of $4.75 billion, including a $500 million multicurrency sub-facility, a $555 million sublimit for the issuance of letters of credit and a $200 million sublimit for swingline loans. The available borrowing base is determined by applying customary advance rates to eligible accounts receivable, inventory and certain mobile equipment. As of June 30, 2025, outstanding letters of credit totaled $63 million, which reduced availability. We issue standby letters of credit with certain financial institutions in order to support business obligations, including, but not limited to, workers' compensation, operating agreements, employee severance, environmental obligations and insurance. Our ABL Facility agreement contains various financial and other covenants. As of June 30, 2025, we were in compliance with all of our ABL Facility covenants.
We have the capability to issue additional unsecured notes and, subject to the limitations set forth in our existing senior notes indentures and ABL Facility, additional secured debt, if we elect to access the debt capital markets. We currently have approximately $3.2 billion of secured debt capacity. We intend from time to time to seek to redeem or repurchase our outstanding senior notes with cash on hand, borrowings from existing credit sources or new debt financings and/or exchanges for debt or equity securities, in open market purchases, privately negotiated transactions or otherwise. Such redemptions or repurchases, if any, will
depend on prevailing market conditions, our liquidity requirements, contractual restrictions and other factors, and the amounts involved may be material. We also have the potential to generate liquidity from the sale of non-core assets.
Refer to NOTE 8 - DEBT AND CREDIT FACILITIES for more information on our ABL Facility and debt.
NON-GAAP FINANCIAL MEASURES
The following provides a description and reconciliation of each of our non-GAAP financial measures to its most directly comparable respective GAAP measure. The presentation of these measures is not intended to be considered in isolation from, as a substitute for, or as superior to, the financial information prepared and presented in accordance with GAAP. The presentation of these measures may be different from non-GAAP financial measures used by other companies.
ADJUSTED EBITDA
We evaluate performance on an operating segment basis, as well as a consolidated basis, based on Adjusted EBITDA, which is a non-GAAP measure. This measure is used by management, investors, lenders and other external users of our financial statements to assess our operating performance and to compare operating performance to other companies in the steel industry. In addition, management believes Adjusted EBITDA is a useful measure to assess the earnings power of the business without the impact of capital structure and can be used to assess our ability to service debt and fund future capital expenditures in the business.
The following table provides a reconciliation of our Net income (loss) to Adjusted EBITDA:
| | | | | | | | | | | | | | | | | | | | | | | |
| Three Months Ended
June 30, | | Six Months Ended
June 30, |
| (In millions) | 2025 | | 2024 | | 2025 | | 2024 |
| Net loss | $ | (470) | | | $ | 9 | | | $ | (953) | | | $ | (44) | |
| Less: | | | | | | | |
| Interest expense, net | (149) | | | (69) | | | (289) | | | (133) | |
| Income tax benefit | 148 | | | 15 | | | 295 | | | 23 | |
| Depreciation, depletion and amortization | (393) | | | (228) | | | (675) | | | (458) | |
| Total EBITDA | (76) | | | 291 | | | (284) | | | 524 | |
| Less: | | | | | | | |
EBITDA from noncontrolling interests1 | 20 | | | 15 | | | 38 | | | 36 | |
| Idled facilities charges | (204) | | | (40) | | | (248) | | | (217) | |
| Changes in fair value of derivatives, net | (15) | | | — | | | (24) | | | — | |
| Currency exchange | 48 | | | — | | | 46 | | | — | |
| Loss on extinguishment of debt | — | | | (6) | | | — | | | (27) | |
| Severance | (19) | | | (1) | | | (20) | | | (3) | |
| Other, net | (3) | | | — | | | 1 | | | (2) | |
| Total Adjusted EBITDA | $ | 97 | | | $ | 323 | | | $ | (77) | | | $ | 737 | |
| | | | | | | |
1 EBITDA from noncontrolling interests includes the following: |
| Net income attributable to noncontrolling interests | $ | 13 | | | $ | 7 | | | 25 | | | 21 | |
| Depreciation, depletion and amortization | 7 | | | 8 | | | 13 | | | 15 | |
| EBITDA from noncontrolling interests | $ | 20 | | | $ | 15 | | | $ | 38 | | | $ | 36 | |
| | | | | | | |
2 Refer to NOTE 2 - SUPPLEMENTARY FINANCIAL STATEMENT INFORMATION for further information. |
The following table provides a summary of our Adjusted EBITDA by segment:
| | | | | | | | | | | | | | | | | | | | | | | |
| Three Months Ended
June 30, | | Six Months Ended
June 30, |
| (In millions) | 2025 | | 2024 | | 2025 | | 2024 |
| Adjusted EBITDA: | | | | | | | |
| Steelmaking | $ | 83 | | | $ | 306 | | | $ | (101) | | | $ | 701 | |
| Other Businesses | 16 | | | 18 | | | 26 | | | 35 | |
| Intersegment Eliminations | (2) | | | (1) | | | (2) | | | 1 | |
| Total Adjusted EBITDA | $ | 97 | | | $ | 323 | | | $ | (77) | | | $ | 737 | |
FREE CASH FLOW
Free cash flow is a non-GAAP measure defined as operating cash flow less purchase of property, plant and equipment. Management believes it is an important measure to assess the cash generation available to service debt, strategic initiatives or other financing activities.
The following table provides a reconciliation of our Net cash provided (used) by operating activities to free cash flow:
| | | | | | | | | | | |
| Six Months Ended
June 30, |
| (In millions) | 2025 | | 2024 |
| Net cash provided (used) by operating activities | $ | (306) | | | $ | 661 | |
| Purchase of property, plant and equipment | (264) | | | (339) | |
| Free cash flow | $ | (570) | | | $ | 322 | |
INFORMATION ABOUT OUR GUARANTORS AND THE ISSUER OF OUR GUARANTEED SECURITIES
The accompanying summarized financial information has been prepared and presented pursuant to SEC Regulation S-X, Rule 3-10, “Financial Statements of Guarantors and Issuers of Guaranteed Securities Registered or Being Registered,” and Rule 13-01 "Financial Disclosures about Guarantors and Issuers of Guaranteed Securities and Affiliates Whose Securities Collateralized a Registrant's Securities." Certain of our subsidiaries (the "Guarantor subsidiaries") as of June 30, 2025 have fully and unconditionally, and jointly and severally, guaranteed the obligations under the 5.875% 2027 Senior Notes, the 7.000% 2027 Senior Notes, the 4.625% 2029 Senior Notes, the 6.875% 2029 Senior Notes, the 6.750% 2030 Senior Notes, the 4.875% 2031 Senior Notes, the 7.500% 2031 Senior Notes, the 7.000% 2032 Senior Notes and the 7.375% 2033 Senior Notes issued by Cleveland-Cliffs Inc. on a senior unsecured basis. See NOTE 8 - DEBT AND CREDIT FACILITIES for further information.
The following presents the summarized financial information on a combined basis for Cleveland-Cliffs Inc. (parent company and issuer of the guaranteed obligations) and the Guarantor subsidiaries, collectively referred to as the obligated group. Transactions between the obligated group have been eliminated. Information for the non-Guarantor subsidiaries was excluded from the combined summarized financial information of the obligated group.
Each Guarantor subsidiary is consolidated by Cleveland-Cliffs Inc. as of June 30, 2025. Refer to Exhibit 22, incorporated herein by reference, for the detailed list of entities included within the obligated group as of June 30, 2025. As of June 30, 2025, the guarantee of a Guarantor subsidiary with respect to the 5.875% 2027 Senior Notes, the 7.000% 2027 Senior Notes, the 4.625% 2029 Senior Notes, the 6.875% 2029 Senior Notes, the 6.750% 2030 Senior Notes, the 4.875% 2031 Senior Notes, the 7.500% 2031 Senior Notes, the 7.000% 2032 Senior Notes and the 7.375% 2033 Senior Notes will be automatically and unconditionally released and discharged, and such Guarantor subsidiary’s obligations under the guarantee and the related indentures (the “Indentures”) will be automatically and unconditionally released and discharged, upon the occurrence of any of the following, along with the delivery to the trustee of an officer’s certificate and an opinion of counsel, each stating that all conditions precedent provided for in the applicable Indenture relating to the release and discharge of such Guarantor subsidiary’s guarantee have been complied with:
(a) any sale, exchange, transfer or disposition of such Guarantor subsidiary (by merger, consolidation, or the sale of) or the capital stock of such Guarantor subsidiary after which the applicable Guarantor subsidiary is no longer a subsidiary of the Company or the sale of all or substantially all of such Guarantor subsidiary’s assets (other than by lease), whether or not such Guarantor subsidiary is the surviving entity in such transaction, to a person which is not the Company or a subsidiary of the Company; provided that (i) such sale, exchange, transfer or disposition is made in compliance with the applicable Indenture, including the covenants regarding consolidation, merger and sale of assets and, as applicable, dispositions of assets that constitute notes collateral, and (ii) all the obligations of such Guarantor subsidiary under all debt of the Company or its subsidiaries terminate upon consummation of such transaction;
(b) designation of any Guarantor subsidiary as an “excluded subsidiary” (as defined in the Indentures); or
(c) defeasance or satisfaction and discharge of the Indentures.
Each entity in the summarized combined financial information follows the same accounting policies as described in the consolidated financial statements. The accompanying summarized combined financial information does not reflect investments of the obligated group in non-Guarantor subsidiaries. The financial information of the obligated group is presented on a combined basis; intercompany balances and transactions within the obligated group have been eliminated. The obligated group's amounts due from, amounts due to, and transactions with, non-Guarantor subsidiaries and related parties have been presented in separate line items.
SUMMARIZED COMBINED FINANCIAL INFORMATION OF THE ISSUER AND GUARANTOR SUBSIDIARIES
The following table is summarized combined financial information from the Statements of Unaudited Condensed Consolidated Financial Position of the obligated group:
| | | | | | | | | | | |
| (In millions) | June 30, 2025 | | December 31, 2024 |
| Current assets | $ | 6,408 | | | $ | 6,463 | |
| Non-current assets | 11,659 | | | 11,856 | |
| Current liabilities | (3,900) | | | (4,121) | |
| Non-current liabilities | (9,690) | | | (9,241) | |
| | | |
The following table is summarized combined financial information from the Statements of Unaudited Condensed Consolidated Operations of the obligated group:
| | | | | |
| Six Months Ended |
| (In millions) | June 30, 2025 |
| Revenues | $ | 8,663 | |
| Cost of goods sold | (9,235) | |
| Net loss | (813) | |
| Net loss attributable to Cliffs shareholders | (813) | |
The obligated group had the following balances with non-Guarantor subsidiaries and other related parties:
| | | | | | | | | | | |
| (In millions) | June 30, 2025 | | December 31, 2024 |
| Balances with non-Guarantor subsidiaries: | | | |
| Accounts receivable, net | $ | 740 | | | $ | 755 | |
| Accounts payable | (1,076) | | | (1,279) | |
| | | |
| Balances with other related parties: | | | |
| Accounts receivable, net | $ | 7 | | | $ | 9 | |
| Accounts payable | (12) | | | (20) | |
Additionally, for the six months ended June 30, 2025, the obligated group had Revenues of $39 million and Cost of goods sold of $35 million, in each case, with other related parties.
MARKET RISKS
We are subject to a variety of risks, including those caused by changes in commodity prices, foreign currency exchange rates, and interest rates. We have established policies and procedures to manage such risks; however, certain risks are beyond our control.
PRICING RISKS
In the ordinary course of business, we are exposed to price fluctuations in both the production and sale of our products. Price fluctuations related to the production of our products are impacted by market prices for natural gas, electricity, ferrous and stainless steel scrap, metallurgical coal, coke, zinc, chrome, nickel and other alloys. Price fluctuations related to the sale of our products are primarily impacted by market prices for HRC and other related spot indices. Our financial results can vary for our operations as a result of these fluctuations.
Our strategy to address the risk of changes in the prices of both energy and raw materials that are purchased and utilized in our operations includes improving efficiency in energy usage, identifying alternative providers, utilizing the lowest cost alternative fuels and making forward physical purchases.
Some customer contracts have fixed pricing terms, which increase our exposure to fluctuations in raw material and energy costs. To reduce our exposure, we enter into annual, fixed price agreements for certain raw materials. Some of our existing multi-year raw material supply agreements have required minimum purchase quantities. Under adverse economic conditions, those minimums may exceed our needs. Absent exceptions for force majeure and other circumstances affecting the legal enforceability of the agreements, these minimum purchase requirements may compel us to purchase quantities of raw materials that could significantly exceed our anticipated needs or pay damages to the supplier for shortfalls. In these circumstances, we would attempt to negotiate agreements for new purchase quantities. There is a risk, however, that we would not be successful in reducing purchase quantities, either through negotiation or litigation. If that occurred, we would likely be required to purchase more of a particular raw material in a particular year than we need, negatively affecting our results of operations and cash flows.
Certain of our customer contracts include variable-pricing mechanisms that adjust selling prices in response to changes in the costs of certain raw materials and energy, while other of our customer contracts exclude such mechanisms. We may enter into multi-year purchase agreements for certain raw materials with similar variable-price mechanisms, allowing us to achieve natural hedges between the customer contracts and supplier purchase agreements. Therefore, in some cases, price fluctuations for energy (particularly natural gas and electricity), raw materials (such as scrap, chrome, zinc and nickel) or other commodities may be, in part, passed on to customers rather than absorbed solely by us. There is a risk, however, that the variable-price mechanisms in the sales contracts may not necessarily change in tandem with the variable-price mechanisms in our purchase agreements, negatively affecting our results of operations and cash flows.
If we are unable to align fixed and variable components between customer contracts and supplier purchase agreements, we routinely evaluate the use of derivative instruments to hedge market risk. As a result, we use cash-settled commodity price swaps to hedge a portion of our exposure from our natural gas and electricity requirements. Our hedging strategy is designed to protect us from excessive pricing volatility. However, since we do not typically hedge 100% of our exposure, abnormal price increases in any of these commodity markets might still negatively affect operating costs.
Our strategy to address price fluctuations related to the selling price of our products has generally been to obtain competitive prices for our products and allow operating results to reflect market price movements dictated by supply and demand; however, to an extent, we also utilize sales swaps to manage our exposure to HRC price fluctuations in the average selling price of our products.
The following table summarizes the negative effect of a hypothetical change in the fair value of our derivative instruments outstanding as of June 30, 2025, due to a 10% and 25% change in the market price of each of the hedge contracts:
| | | | | | | | | | | | | | |
| Contract Type (In millions) | | 10% Change | | 25% Change |
| Natural gas | | $ | 45 | | | $ | 113 | |
| Electricity | | 13 | | | 32 | |
| HRC | | 8 | | | 20 | |
Any resulting changes in fair value would be recorded as adjustments to AOCI, net of income taxes, or recognized in net earnings, as appropriate. These hypothetical losses would be partially offset by the benefit of lower prices paid for the related commodities or the benefit of higher selling prices related to the HRC price, respectively.
VALUATION OF GOODWILL AND OTHER LONG-LIVED ASSETS
GOODWILL
We assign goodwill arising from acquired companies to the reporting units that are expected to benefit from the synergies of the acquisition. Goodwill is tested on a qualitative or quantitative basis for impairment at the reporting unit level on an annual basis (October 1) and between annual tests if a triggering event occurs or circumstances change that would more likely than not reduce the fair value of a reporting unit below its carrying value. We have an unconditional option to bypass the qualitative test for any reporting unit in any period and proceed directly to performing the quantitative test. Should our qualitative test indicate that it is more likely than not that the fair value of a reporting unit is less than its carrying value, we perform a quantitative test to determine the amount of impairment, if any, to the carrying value of the reporting unit and its associated goodwill.
Triggering events could include a significant and sustained change in the business climate, including, among other factors, declines in historical or projected revenue, operating income, Adjusted EBITDA or cash flows, and declines in the stock price or market capitalization, considered both in absolute terms and relative to peers, legal factors, competition, or sale or disposition of a significant portion of a reporting unit. Automotive production and sales are cyclical and sensitive to general economic conditions and other factors, including interest rates, consumer credit, spending and preferences, and supply chain disruptions. Additionally, to the extent that commodity prices, including the HRC price, coated and other specialty steel prices, international steel prices and scrap metal prices, significantly decline for an extended period, we may have to further revise our operating plans. As a result, testing for potential impairment on our goodwill may be adversely affected by uncertain market conditions for the global steel industry, as well as changes in interest rates, inflation, commodity prices and general economic conditions. Changes in general economic and/or industry specific conditions, such as the impacts of significant recent shifts in trade policies, including the imposition of tariffs, retaliatory tariff measures and subsequent modifications or suspensions thereof, and market reactions to such policies and resulting trade disputes, could further impact our impairment assessments. We do not believe the current challenging macroeconomic and industry conditions, or our depressed market capitalization, have significantly changed our assessment of the fair value of our reporting units.
Application of a goodwill impairment test requires judgment, including the identification of reporting units, assignment of assets and liabilities to reporting units, assignment of goodwill to reporting units, and the determination of the fair value of each reporting unit, if a quantitative assessment is deemed necessary. The fair value of each reporting unit is estimated using the guideline public company method, the discounted cash flow methodology, or a combination of both, which considers forecasted cash flows discounted at an estimated weighted average cost of capital. Assessing the recoverability of our goodwill requires significant assumptions regarding discount rates, market multiples, the estimated future cash flows and other factors to determine the fair value of a reporting unit, including, among other things, estimates related to forecasts of future revenues, Adjusted EBITDA, capital expenditures and working capital requirements, which are based upon our long-range plan estimates. The assumptions used to calculate the fair value of a reporting unit may change based on operating results, market conditions and other factors. Changes in these assumptions could materially affect the determination of fair value for each reporting unit.
OTHER LONG-LIVED ASSETS
Long-lived assets are reviewed for impairment upon the occurrence of events or changes in circumstances that would indicate that the carrying value of the assets may not be recoverable. Such indicators may include: a significant decline in expected future cash flows; a sustained, significant decline in market pricing; a significant adverse change in legal or environmental factors or in the business climate; changes in estimates of our recoverable reserves; and unanticipated competition. Any adverse change in these factors could have a significant impact on the recoverability of our long-lived assets and could have a material impact on our consolidated statements of operations and statements of financial position.
A comparison of each asset group's carrying value to the estimated undiscounted net future cash flows expected to result from the use of the assets, including cost of disposition, is used to determine if an asset is recoverable. Projected future cash flows reflect management's best estimate of economic and market conditions over the projected period, including growth rates in revenues and costs, and estimates of future expected changes in operating margins and capital expenditures. If the carrying value of the asset group is higher than its undiscounted net future cash flows, the asset group is measured at fair value and the difference is recorded as a reduction to the long-lived assets. We estimate fair value using a market approach, an income approach or a cost approach. For the three and six months ended June 30, 2025, we concluded that there were no additional triggering events resulting in the
need for an impairment assessment except for the announcement of the indefinite idle of our Steelton rail production facility, which resulted in a $34 million impairment charge to Property, plant and equipment, net for the six months ended June 30, 2025.
The triggering events discussed above related to goodwill additionally apply to testing for potential impairment of other long-lived assets, including property, plant and equipment and/or intangible assets.
FOREIGN CURRENCY EXCHANGE RATE RISK
We are subject to changes in foreign currency exchange rates primarily as a result of our operations in Canada, which could impact our financial condition. Foreign exchange rate risk arises from our exposure to fluctuations in foreign currency exchange rates because our reporting currency is the U.S. dollar, but the functional currency of our Stelco subsidiaries is the Canadian dollar. Specifically, we are primarily exposed to fluctuations in foreign currency rates in relation to an intercompany note with our Stelco subsidiary that is denominated in the Canadian dollar. Changes in the Canadian dollar exchange rate may result in volatility in our financial condition due to the routine remeasurement of this note. As of June 30, 2025, a 1% change in the Canadian dollar foreign currency exchange rate would result in a $9 million change in currency exchange income (expense). Additionally, we engage in routine transactions denominated in foreign currencies, such as the purchases of goods and services. However, the potential impact of these transactions to our financial condition is significantly less than the potential impact of the routine remeasurement of the intercompany note.
INTEREST RATE RISK
Interest payable on our senior notes is at fixed rates. Interest payable under our ABL Facility is at a variable rate based upon the applicable base rate plus the applicable base rate margin depending on the excess availability. As of June 30, 2025, we had $1,377 million of outstanding borrowings under our ABL Facility. An increase in prevailing interest rates would increase interest expense and interest paid for any outstanding borrowings under our ABL Facility. For example, a 100 basis point change to interest rates under our ABL Facility at the June 30, 2025 borrowing level would result in a change of $14 million to interest expense on an annual basis.
SUPPLY CONCENTRATION RISKS
Many of our operations and mines rely on one source each of electric power and natural gas. A significant interruption or change in service or rates from our energy suppliers could materially impact our production costs, margins and profitability.
FORWARD-LOOKING STATEMENTS
This report contains statements that constitute "forward-looking statements" within the meaning of the federal securities laws. As a general matter, forward-looking statements relate to anticipated trends and expectations rather than historical matters. Forward-looking statements are subject to uncertainties and factors relating to our operations and business environment that are difficult to predict and may be beyond our control. Such uncertainties and factors may cause actual results to differ materially from those expressed or implied by the forward-looking statements. These statements speak only as of the date of this report, and we undertake no ongoing obligation, other than that imposed by law, to update these statements. Investors are cautioned not to place undue reliance on forward-looking statements. Uncertainties and risk factors that could affect our future performance and cause results to differ from the forward-looking statements in this report include, but are not limited to:
•continued volatility of steel, scrap metal and iron ore market prices, which directly and indirectly impact the prices of the products that we sell to our customers;
•uncertainties associated with the highly competitive and cyclical steel industry and our reliance on the demand for steel from the automotive industry;
•potential weaknesses and uncertainties in global economic conditions, excess global steelmaking capacity and production, prevalence of steel imports, reduced market demand and oversupply of iron ore;
•severe financial hardship, bankruptcy, temporary or permanent shutdowns or operational challenges of one or more of our major customers, key suppliers or contractors, which, among other adverse effects, could disrupt our operations or lead to reduced demand for our products, increased difficulty collecting receivables, and customers and/or suppliers asserting force majeure or other reasons for not performing their contractual obligations to us;
•risks related to U.S. government actions and other countries' reactions with respect to Section 232, the United States-Mexico-Canada Agreement and/or other trade agreements, tariffs, treaties or policies, as well as the uncertainty of obtaining and maintaining effective antidumping and countervailing duty orders to counteract the harmful effects of unfairly traded imports;
•impacts of existing and changing governmental regulation, including actual and potential environmental regulations relating to climate change and carbon emissions, and related costs and liabilities, including failure to receive or maintain required operating and environmental permits, approvals, modifications or other authorizations of, or from, any governmental or regulatory authority and costs related to implementing improvements to ensure compliance with regulatory changes, including potential financial assurance requirements, and reclamation and remediation obligations;
•potential impacts to the environment or exposure to hazardous substances resulting from our operations;
•our ability to maintain adequate liquidity, our level of indebtedness and the availability of capital could limit our financial flexibility and cash flow necessary to fund working capital, planned capital expenditures, acquisitions, and other general corporate purposes or ongoing needs of our business, or to repurchase our common shares;
•our ability to reduce our indebtedness or return capital to shareholders within the currently expected timeframes or at all;
•adverse changes in credit ratings, interest rates, foreign currency rates and tax laws;
•challenges to successfully implementing our business strategy to achieve operating results in line with our guidance;
•the outcome of, and costs incurred in connection with, lawsuits, claims, arbitrations or governmental proceedings relating to commercial and business disputes, antitrust claims, environmental matters, government investigations, occupational or personal injury claims, property-related matters, labor and employment matters, or suits involving legacy operations and other matters;
•supply chain disruptions or changes in the cost, quality or availability of energy sources, including electricity, natural gas and diesel fuel, critical raw materials and supplies, including iron ore, industrial gases, graphite electrodes, scrap metal, chrome, zinc, other alloys, coke and metallurgical coal, and critical manufacturing equipment and spare parts;
•problems or disruptions associated with transporting products to our customers, moving manufacturing inputs or products internally among our facilities, or suppliers transporting raw materials to us;
•the risk that the cost or time to implement a strategic or sustaining capital project may prove to be greater than originally anticipated;
•our ability to consummate any public or private acquisition or divestiture transactions and to realize any or all of the anticipated benefits or estimated future synergies, as well as to successfully integrate any acquired businesses into our existing businesses;
•uncertainties associated with natural or human-caused disasters, adverse weather conditions, unanticipated geological conditions, critical equipment failures, infectious disease outbreaks, tailings dam failures and other unexpected events;
•cybersecurity incidents relating to, disruptions in, or failures of, information technology systems that are managed by us or third parties that host or have access to our data or systems, including the loss, theft or corruption of our or third parties' sensitive or essential business or personal information and the inability to access or control systems;
•liabilities and costs arising in connection with any business decisions to temporarily or indefinitely idle or permanently close an operating facility or mine, which could adversely impact the carrying value of associated assets, trigger contractual liabilities or termination costs, and give rise to impairment charges or closure and reclamation obligations, as well as uncertainties associated with restarting any previously idled operating facility or mine;
•our ability to realize the anticipated synergies or other expected benefits of the Stelco Acquisition, as well as the impact of additional liabilities and obligations incurred in connection with the Stelco Acquisition;
•our level of self-insurance and our ability to obtain sufficient third-party insurance to adequately cover potential adverse events and business risks;
•uncertainties associated with our ability to meet customers’ and suppliers’ decarbonization goals and reduce our GHG emissions in alignment with our own announced targets;
•challenges to maintaining our social license to operate with our stakeholders, including the impacts of our operations on local communities, reputational impacts of operating in a carbon-intensive industry that produces GHG emissions, and our ability to foster a consistent operational and safety track record;
•our actual economic mineral reserves or reductions in current mineral reserve estimates, and any title defect or loss of any lease, license, option, easement or other possessory interest for any mining property;
•our ability to maintain satisfactory labor relations with unions and employees;
•unanticipated or higher costs associated with pension and OPEB obligations resulting from changes in the value of plan assets or contribution increases required for unfunded obligations;
•uncertain availability or cost of skilled workers to fill critical operational positions and potential labor shortages caused by experienced employee attrition or otherwise, as well as our ability to attract, hire, develop and retain key personnel; and
•potential significant deficiencies or material weaknesses in our internal control over financial reporting.
For additional factors affecting our business, refer to Part II – Item 1A. Risk Factors of this Quarterly Report on Form 10-Q. You are urged to carefully consider these risk factors.
Forward-looking and other statements in this Quarterly Report on Form 10-Q regarding our GHG reduction plans and goals are not an indication that these statements are necessarily material to investors or required to be disclosed in our filings with the SEC. In addition, historical, current and forward-looking GHG-related statements may be based on standards for measuring progress that are still developing, internal controls and processes that continue to evolve and assumptions that are subject to change in the future.
| | |
|
| ITEM 3. QUANTITATIVE AND QUALITATIVE DISCLOSURES ABOUT MARKET RISK |
Information regarding our market risk is presented under the caption "Market Risks," which is included in our Annual Report on Form 10-K for the year ended December 31, 2024, and Part I – Item 2. Management's Discussion and Analysis of Financial Condition and Results of Operations of this Quarterly Report on Form 10-Q.
| | |
|
| ITEM 4. CONTROLS AND PROCEDURES |
We maintain disclosure controls and procedures that are designed to ensure that information required to be disclosed in our Exchange Act reports is recorded, processed, summarized and reported within the time periods specified in the SEC’s rules and forms, and that such information is accumulated and communicated to our management, including our President and Chief Executive Officer and Chief Financial Officer, as appropriate, to allow timely decisions regarding required disclosure based solely on the definition of “disclosure controls and procedures” in Rule 13a-15(e) promulgated under the Exchange Act. In designing and evaluating the disclosure controls and procedures, management recognized that any controls and procedures, no matter how well designed and operated, can provide only reasonable assurance of achieving the desired control objectives, and management necessarily was required to apply its judgment in evaluating the cost-benefit relationship of possible controls and procedures.
As of the end of the period covered by this report, we carried out an evaluation under the supervision and with the participation of our management, including our President and Chief Executive Officer and our Chief Financial Officer, of the effectiveness of the design and operation of our disclosure controls and procedures. Based on the foregoing, our President and Chief Executive Officer and Chief Financial Officer concluded that our disclosure controls and procedures were effective.
There was no change in the Company’s internal control over financial reporting during the quarter ended June 30, 2025 that materially affected, or is reasonably likely to materially affect, our internal control over financial reporting.
PART II - OTHER INFORMATION
| | |
|
| ITEM 1. LEGAL PROCEEDINGS |
Mesabi Metallics Adversary Proceeding. On September 7, 2017, Mesabi Metallics Company LLC (f/k/a Essar Steel Minnesota LLC) ("Mesabi Metallics") filed a complaint against Cleveland-Cliffs Inc. in the Essar Steel Minnesota LLC and ESML Holdings Inc. bankruptcy proceeding in the United States Bankruptcy Court, District of Delaware (the "Bankruptcy Court"). Mesabi Metallics alleged tortious interference with its contractual rights and business relations involving certain vendors, suppliers and contractors, violations of federal and Minnesota antitrust laws through monopolization, attempted monopolization and restraint of trade, violation of the automatic stay, and civil conspiracy with unnamed Doe defendants. Mesabi Metallics amended its complaint to add additional defendants, including, among others, our subsidiary, Cleveland-Cliffs Minnesota Land Development Company LLC ("Cliffs Minnesota Land"), and to add additional claims, including avoidance and recovery of unauthorized post-petition transfers of real estate interests, claims disallowance, civil contempt and declaratory relief. Mesabi Metallics seeks to hold the defendants jointly and severally liable for, among other things, antitrust damages and injunctive relief. The parties filed various dispositive motions on certain of the claims, including a motion for partial summary judgment to settle a dispute over real estate transactions between Cliffs Minnesota Land and Glacier Park Iron Ore Properties LLC ("GPIOP"). A ruling in favor of Cliffs, Cliffs Minnesota Land and GPIOP was issued on July 23, 2018, finding that Mesabi Metallics' leases had terminated and upholding Cliffs' and Cliffs Minnesota Land's purchase and lease of the contested real estate interests. Mesabi Metallics filed a Motion for Leave to File an Interlocutory Appeal, which was denied on September 10, 2019. Discovery was completed, and the parties filed cross-motions for summary judgment. On October 8, 2024, the Bankruptcy Court issued an order granting and denying parts of the cross-motions. On February 14, 2025, Mesabi Metallics' motion for the case to be withdrawn from the Bankruptcy Court and proceed in the United States District Court for the District of Delaware (the “District Court”) was granted. On June 3, 2025, the District Court issued an order setting the case for trial in May of 2027. We continue to believe the claims asserted against us are without merit, and we intend to continue vigorously defending against all remaining claims in the lawsuit.
Environmental Matters. SEC regulations require us to disclose certain information about administrative or judicial proceedings involving the environment and to which a governmental authority is a party if we reasonably believe that such proceedings may result in monetary sanctions above a stated threshold. Pursuant to SEC regulations, we use a threshold of $1 million for purposes of determining whether disclosure of any such proceedings is required. We believe that this threshold is reasonably designed to result in disclosure of any such proceedings that are material to our business or financial condition.
We have described the other material pending legal proceedings, including administrative or judicial proceedings involving the environment, to which we are a party in our Annual Report on Form 10-K for the year ended December 31, 2024.
We caution readers that our business activities involve risks and uncertainties that could cause actual results to differ materially from those currently expected by management. We described the most significant risks that could impact our results in Part I, Item 1A. "Risk Factors" in our Annual Report on Form 10-K for the year ended December 31, 2024.
| | |
|
| ITEM 2. UNREGISTERED SALES OF EQUITY SECURITIES AND USE OF PROCEEDS |
The following table presents information with respect to repurchases by the Company of our common shares during the periods indicated:
ISSUER PURCHASES OF EQUITY SECURITIES
| | | | | | | | | | | | | | | | | | | | | | | | | | |
| Period | | Total Number of Shares (or Units) Purchased1 | | Average Price Paid per Share (or Unit) | | Total Number of Shares (or Units) Purchased as Part of Publicly Announced Plans or Programs | | Maximum Number (or Approximate Dollar Value) of Shares (or Units) that May Yet Be Purchased Under the Plans or Programs2 |
| April 1 - 30, 2025 | | 5,747 | | | $ | 8.03 | | | — | | | $ | 1,375,931,379 | |
| May 1 - 31, 2025 | | 7,340 | | | $ | 7.13 | | | — | | | $ | 1,375,931,379 | |
| June 1 - 30, 2025 | | 3,860 | | | $ | 7.17 | | | — | | | $ | 1,375,931,379 | |
| Total | | 16,947 | | | $ | 7.44 | | | — | | | |
| | | | | | | | |
1Shares that were delivered to us in order to satisfy tax withholding obligations due upon the vesting or payment of stock awards. |
2 On April 22, 2024, we announced that our Board of Directors authorized a program to repurchase our outstanding common shares in the open market or in privately negotiated transactions, which may include purchases pursuant to Rule 10b5-1 plans or accelerated share repurchases, up to a maximum of $1.5 billion. We are not obligated to make any repurchases, and the program may be suspended or discontinued at any time. The share repurchase program does not have a specific expiration date. |
| | |
|
| ITEM 4. MINE SAFETY DISCLOSURES |
We are committed to protecting the occupational health and well-being of each of our employees. Safety is one of our core values and we strive to ensure that safe production is the first priority for all employees. Our internal objective is to achieve zero injuries and incidents across the Company by focusing on proactively identifying needed prevention activities, establishing standards and evaluating performance to mitigate any potential loss to people, equipment, production and the environment. We have implemented intensive employee training that is geared toward maintaining a high level of awareness and knowledge of safety and health issues in the work environment through the development and coordination of requisite information, skills and attitudes. We believe that through these policies, we have developed an effective safety management system.
Under the Dodd-Frank Act, each operator of a coal or other mine is required to include certain mine safety results within its periodic reports filed with the SEC. As required by the reporting requirements included in §1503(a) of the Dodd-Frank Act and Item 104 of Regulation S-K, the information concerning mining safety and health or other regulatory matters for each of our mine locations that are covered under the scope of the Dodd-Frank Act are included in Exhibit 95 of Part II – ITEM 6. EXHIBITS of this Quarterly Report on Form 10-Q.
| | |
|
| ITEM 5. OTHER INFORMATION |
During the quarter ended June 30, 2025, no director or officer (as defined in Rule 16a-1(f) promulgated under the Exchange Act) of the Company adopted or terminated a "Rule 10b5-1 trading arrangement" or "non-Rule 10b5-1 trading arrangement" (as each term is defined in Item 408 of Regulation S-K).
All documents referenced below have been filed pursuant to the Securities Exchange Act of 1934 by Cleveland-Cliffs Inc., file number 1-09844, unless otherwise indicated.
| | | | | | | | |
Exhibit
Number | | Exhibit |
| | |
| | Schedule of the obligated group, including the parent and issuer and the subsidiary guarantors that have guaranteed the obligations under the 5.875% 2027 Senior Notes, the 7.000% 2027 Senior Notes, the 4.625% 2029 Senior Notes, the 6.875% 2029 Senior Notes, the 6.750% 2030 Senior Notes, the 4.875% 2031 Senior Notes, the 7.500% 2031 Senior Notes, the 7.000% 2032 Senior Notes and the 7.375% 2033 Senior Notes issued by Cleveland-Cliffs Inc. (filed herewith). |
| | Certification Pursuant to 15 U.S.C. Section 7241, as Adopted Pursuant to Section 302 of the Sarbanes-Oxley Act of 2002, signed and dated by Lourenco Goncalves as of July 23, 2025 (filed herewith). |
| | Certification Pursuant to 15 U.S.C. Section 7241, as Adopted Pursuant to Section 302 of the Sarbanes-Oxley Act of 2002, signed and dated by Celso L. Goncalves Jr. as of July 23, 2025 (filed herewith). |
| | Certification Pursuant to 18 U.S.C. Section 1350, as Adopted Pursuant to Section 906 of the Sarbanes-Oxley Act of 2002, signed and dated by Lourenco Goncalves, Chairman, President and Chief Executive Officer of Cleveland-Cliffs Inc., as of July 23, 2025 (filed herewith). |
| | Certification Pursuant to 18 U.S.C. Section 1350, as Adopted Pursuant to Section 906 of the Sarbanes-Oxley Act of 2002, signed and dated by Celso L. Goncalves Jr., Executive Vice President, Chief Financial Officer of Cleveland-Cliffs Inc., as of July 23, 2025 (filed herewith). |
| | Mine Safety Disclosures (filed herewith). |
| 101 | | The following financial information from Cleveland-Cliffs Inc.'s Quarterly Report on Form 10-Q for the quarterly period ended June 30, 2025 formatted in Inline XBRL (Extensible Business Reporting Language) includes: (i) the Statements of Unaudited Condensed Consolidated Financial Position, (ii) the Statements of Unaudited Condensed Consolidated Operations, (iii) the Statements of Unaudited Condensed Consolidated Comprehensive Income (Loss), (iv) the Statements of Unaudited Condensed Consolidated Cash Flows, (v) the Statements of Unaudited Condensed Consolidated Changes in Equity, and (vi) Notes to the Unaudited Condensed Consolidated Financial Statements. |
| 104 | | The cover page from this Quarterly Report on Form 10-Q, formatted in Inline XBRL and contained in Exhibit 101. |
SIGNATURES
Pursuant to the requirements of the Securities Exchange Act of 1934, the Registrant has duly caused this report to be signed on its behalf by the undersigned, thereunto duly authorized.
| | | | | | | | | | | | | | | | | | | | | | | |
| | | CLEVELAND-CLIFFS INC. |
| | | | |
| | | By: | | /s/ Kimberly A. Floriani |
| | | | | Name: | | Kimberly A. Floriani |
| | | | | Title: | | Senior Vice President, Controller & Chief Accounting Officer |
| | | | | | | |
| Date: | July 23, 2025 | | | | | | |